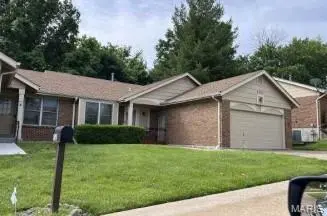
6587 Dolphin Cir Unit B · Black Jack, MO
Flood risk 1/10 · Minimal
- FEMA flood zone
- X (unshaded)
- Chance of flooding over 30 yrs
- 0.0%
- Est. flood insurance / yr
- $473 – $860
Fire risk 1/10 · Minimal
- Est. fire insurance / yr
- $1,054 – $1,958
Heat risk 5/10 · Moderate
- Hot days now (above 106°F)
- 7 days/yr
- Hot days in 30 yrs
- 21 days/yr
Wind risk 2/10 · Minimal
- Chance of severe wind over 30 yrs
- 1.0%
Air-quality risk 4/10 · Minor
- Unhealthy air days now
- 4 days/yr
- Unhealthy air days in 30 yrs
- 5 days/yr
Risk factors via First Street. Map © Google.
Why this score? — see what drove the C- grade
The composite is a weighted blend of 9 inputs, each scored 0–100. Each bar is that input's sub-score; the figure is the points it added to the 100-point composite (weight × sub-score).
- ARV discount +15.0/15.0
- Appreciation +10.0/10.0
- 1% rule +6.8/10.0
- Cash flow +6.6/30.0
- Rent growth +4.4/5.0
- Livability +3.5/5.0
- Condition / age +2.2/5.0
- Schools +1.7/10.0
- DSCR +0.8/10.0
$104,900
🖨 Deal sheet 📄 Offer letter ✓ Due diligence
Listing remarks MLS
AUCTION Occupied - Great opportunity to own this spacious single-story condo/villa, built in 1990 and featuring 1 bedroom, 2 baths, and a garage. NO ACCESS, OR VIEWINGS of this property. Please DO NOT DISTURB the occupant. "As is" cash only sale with no contingencies or inspections. Buyer will be responsible for obtaining possession of the property upon closing. ***Please read all disclaimers before placing a bid***
Key facts
- 0.26 acre lot
- 2 garage spots
- Built 1990
Neighborhood map
What this means for you Summary
Snapshot
- This is a 1-bed/2.0-bath single-family listed at $105k. Condition is rated fair.
Deal economics
- At list price, monthly cash flow is $-175 ($-2k/yr) — negative.
- To cash-flow at today's rent, offer at most $80k (24.1% below list).
- Meets the 1% rule at list price ($1k rent vs $105k).
- Recommended offer: $80k (24.1% below list) — sets the bar for cash-flow.
- Cap rate 4.3% vs local median 6.2% in Black Jack — below-typical yield; the buyer is paying a premium for something (appreciation thesis, condition, location) that the cap rate doesn't capture.
Location & tenants
- Location reads 70/100 on livability (#132 in MO) — a middle-class / working-renter tenant base. Strengths: cost of living A+, housing A+; Watch: health & safety C-, crime D+, amenities F.
- Hazelwood (suburban): math 11% / reading 26% proficiency, ranked #306 of 324 in MO (top 94%) — low school quality limits family demand, transient renter base, plan for 1-2y turnover.
- Market conditions: Rents rising fast (+7.5%/yr); 218 active listings in the ZIP; 1 comparable units currently listed for rent nearby; 920 units permitted in St. Louis County in 2024 (250 in 5+ unit buildings).
Forward outlook
- In year one you build about $11k of equity ($725 loan paydown + $10k appreciation (10.0% local appreciation)).
- By year 4, paydown + projected appreciation supports a ~$40k cash-out refi (75% LTV) — recoverable capital for the next deal without selling this one.
Negotiation context
- It's been on market 167 days — a 12% lower offer ($92k) is reasonable based on typical stale-listing flexibility.
Risks & watch-outs
- Watch-outs: HOA is 34% of rent.
- Climate carrying-cost: extreme-heat days projected 7→21/yr by 2055 (HVAC capex compounding) — expect insurance premiums to compound above CPI over the hold.
Questions for the listing agent
- What do current leases actually rent for vs. the listed asking? Can we see a recent rent roll and the last 12 months of T-12 income?
- It's been on market 167 days. Have you received any prior offers? Is the seller open to a 24% concession, seller financing, or rate buy-down credit?
- Have any recent inspections been done? Can we get a copy of the seller's disclosures and any deferred-maintenance estimates?
- What does the HOA fee cover, when was the last increase, and are there any pending special assessments or reserve-fund shortfalls?
- Why hasn't it sold? Are there any deal-killer items the seller is aware of (foundation, flood, title, zoning, code violations)?
- Is there a deadline driving the sale (1031 exchange, divorce, estate, relocation)? That informs how much negotiation room exists.
- Crime grade is D in this area — have there been break-ins, vandalism, or insurance claims at this property in the last 3 years? What carrier currently insures it and at what premium?
- What's the average days-on-market for RENTAL listings here right now (not sales)? A rising rental-DOM trend means longer vacancies and softer asking-rent achievability than the comps imply.
- What's the recent tenant-quality profile in this submarket — average credit score on applications, eviction rate, late-payment / NSF rate, and stable-employment percentage? A property-management company in the area should have these aggregated.
- How much new for-sale + rental construction is in the pipeline within 1–3 miles? Heavy new supply typically softens prices + rents 12–24 months out; constrained supply supports both.
Investment metrics
- 1% rule
- 1.18% ✓
- Cap rate
- 4.30%
- Cash-on-cash
- -7.13%
- DSCR
- 0.68
- GRM
- 7.1
CMA / ARV
- ARV (median comp)
- $126,413
- List price
- $104,900
- Delta
- -17.02%
- Verdict
- UNDERPRICED
- Comps
- 7 within 1.0 mi
Show comp detail 2 sales within ~0.75 mi
| Address | Dist | Beds/Ba | Sqft | Sold | Price | $/sf | Match |
|---|---|---|---|---|---|---|---|
| 6558 Dolphin Cir | 0.08mi | 2/3.0 (+1) | 1,517 (+1%) | 11mo | $159,000 | $105 | 76 |
| 13595 Old Jamestown Rd | 0.70mi | 2/2.0 (+1) | 1,692 (+13%) | 22mo | $400,000 | $236 | 22 |
Match score weights: distance 35% · size 25% · config 20% · recency 20%. Top-matched comps best support the ARV.
Projected returns pro-forma
10.0% appreciation · 7.51% rent growth · sell at horizon
- IRR
- 21.5%
- Equity multiple
- 2.78×
- Total profit
- $52,160
- Equity at exit
- $94,502
- IRR
- 21.2%
- Equity multiple
- 7.03×
- Total profit
- $177,151
- Equity at exit
- $203,798
Cash invested: $29,372 (down + closing). Projections, not guarantees.
Landlord ↔ Tenant lean methodology
- Overall (STATE)
- 81 Strongly Landlord-Friendly
- State Missouri
- 81 Strongly Landlord-Friendly · R+10
- County
- — inherits STATE
- City
- — inherits STATE
ZIP-level market 63033
- Home prices YoY
- 2.5%
- Rents YoY
- 7.5%
- Active inventory
- 218
- Price-to-rent
- 7.1×
Monthly cashflow live
- Estimated rent
- $1,236 medium interval (Pro) →
- Mortgage (P&I)
- −$550
- Tax est. 1.5%
- −$131 /mo · $1,574/yr
- Insurance
- −$44
- HOA
- −$426
- Vacancy / Maint / Mgmt
- −$260
- Net cashflow
- $-175
Break-even live
UW: 25.0% down · 7.5% · 30yr · 1.5% tax · 5.0% vac · 8.0% maint · 8.0% mgmt
Financing live
Cash to close
- Down payment
- $26,225
- Closing costs
- $3,147
- Reserves months
- —
- Total cash needed
- —
Loan-product check · same deal, 3 products live
Conventional
25% down · 7.5% · 30yr
- Down + closing
- —
- Monthly P&I
- —
- Monthly cashflow
- —
- DSCR
- —
- Eligible?
- —
Personal DTI + credit; lowest rate.
DSCR
20% down · 8.5% · 30yr
- Down + closing
- —
- Monthly P&I
- —
- Monthly cashflow
- —
- DSCR
- —
- Eligible?
- —
No personal income docs; deal must DSCR.
Hard money
10% down · 12.0% · 12mo
- Down + closing
- —
- Monthly P&I
- —
- Monthly cashflow
- —
- DSCR
- —
- Eligible?
- —
Short-term bridge; refi at stabilization.
Rent comps 1 comps
| Address | Beds | Baths | Sqft | Rent | $/sqft | DOM | Units | Dist |
|---|---|---|---|---|---|---|---|---|
| 11969 Continental Dr St. Louis, MO | 2.0–3.0 | 1.5 | 1075 | $1,035 | $0.96 | 2d | 3 | 1.24mi |
HOA detail
- Monthly dues
- $426 · $5,112/yr
Listing history 15 events
-
2026-06-18days on market $104,900 Active 167 DOM
-
2026-06-17days on market $104,900 Active 166 DOM
-
2026-06-16days on market $104,900 Active 165 DOM
-
2026-06-15days on market $104,900 Active 164 DOM
-
2026-06-13days on market $104,900 Active 162 DOM
-
2026-06-13days on market $104,900 Active 161 DOM
-
2026-06-09days on market $104,900 Active 158 DOM
-
2026-06-08days on market $104,900 Active 157 DOM
-
2026-06-07days on market $104,900 Active 156 DOM
-
2026-06-05days on market $104,900 Active 153 DOM
-
2026-06-03days on market $104,900 Active 152 DOM
-
2026-06-02days on market $104,900 Active 151 DOM
-
2026-06-01days on market $104,900 Active 150 DOM
-
2026-05-31days on market $104,900 Active 149 DOM
-
2026-01-02$104,900 Active 429-char remark
Show marketing remark (429 chars)
AUCTION Occupied - Great opportunity to own this spacious single-story condo/villa, built in 1990 and featuring 1 bedroom, 2 baths, and a garage. NO ACCESS, OR VIEWINGS of this property. Please DO NOT DISTURB the occupant. "As is" cash only sale with no contingencies or inspections. Buyer will be responsible for obtaining possession of the property upon closing. ***Please read all disclaimers before placing a bid***
ⓘ Source: listings_history table (triggers on properties + properties_extension) + one-shot
backfill from property_details.listing_events for pre-trigger history.
Climate risk First Street
- Flood 1/10 Low FEMA zone X (unshaded) · 0% chance over 30 yrs
- Wildfire 1/10 Low
- Heat 5/10 Major 7 d/yr ≥106°F today · 21 d/yr by 30 yrs out
- Wind 2/10 Low 100% chance of damaging wind over 30 yrs
- Air quality 4/10 Moderate 4 unhealthy d/yr today · 5 by 30 yrs out
Nearby sold comps map
Loading sold comps map…
Walkable amenities ~0.75 mi
Loading nearby amenities…
Taxation est. · year 1
- Rental income
- $14,832
- − Mortgage interest
- −$5,876
- − Property taxes
- −$1,574
- − Insurance
- −$524
- − Repairs & maintenance
- −$1,187
- − Management
- −$1,187
- − HOA
- −$5,112
- − Depreciation
- −$3,052
- Taxable loss
- −$3,679
- Est. tax savings @ 24.0%
- +$883
- After-tax cash flow
- $-1,211/yr
For passive investors: Depreciation is non-cash, so a rental often shows a tax loss while cash-flowing — sheltering income. Rental losses are passive: they offset passive income freely, and up to $25,000/yr can offset ordinary (W-2) income if you actively participate and your MAGI is under $100k (phasing out to $0 by $150k); unused losses carry forward. On sale, claimed depreciation is recaptured at up to 25%, and gains may owe capital-gains tax (a 1031 exchange can defer both). Figures are a year-1 estimate at your 24.0% rate — not tax advice; consult a CPA.
Condition & rehab AI · 3 photos
This single-story home requires moderate repairs and maintenance to improve its condition and value. Painting the exterior and sealing driveway cracks would significantly enhance its curb appeal and marketability.
Repairs flagged
- Minor Driveway — Cracks in concrete
- Minor Exterior siding — Some discoloration
Value-add opportunities
- Both Paint exterior walls — Enhances curb appeal and value
- Both Seal driveway cracks — Improves appearance and prevents further damage
Renovation cost estimate screening
| Repair item | Severity | Est. cost |
|---|---|---|
| Driveway · Cracks in concrete | Minor | $500–3,000 |
| Exterior siding · Some discoloration | Minor | $500–3,000 |
| Total estimated repair cost · 2 items | $1,000–6,000 |
Value-add ROI direction
- Both Paint exterior walls — Enhances curb appeal and value ↑
- Both Seal driveway cracks — Improves appearance and prevents further damage ↑
ⓘ Cost ranges are severity-bucket heuristics (US national rule-of-thumb). Get contractor quotes + a written scope before underwriting a rehab budget.
Schools (NCES district)
- District
- Hazelwood
- NCES district ID
- 2913830
- Math proficiency
- 11% ▼ -13.00%
- Reading proficiency
- 26% ▼ -6.00%
- Median HH income
- $51,621
- Composite
- 16.77/100
- National rank
- #9156
- State rank
- #306 of 324 in MO
Livability — Black Jack
- Score
- 70/100
- State rank
- #132
- US rank
- #7706
Category grades
Schools grade is shown separately in the Schools card above.
Census & demographics
- County
- Saint Louis County · 888,823 people
- City population
- 42,258
- Metro
- St. Louis, MO-IL
- Population (ZIP)
- 43,056
- Household income
- $66,776
- Rent vs Own
- Severe rent burden
- 1429.0
Population outlook (St. Louis County) Hauer SSP2
- Today (2025)
- 1,025,227 people
- By 2030
- 1,028,023 · +0.3%
- By 2040
- 1,020,940 · -0.4%
- By 2050
- 1,007,280 · -1.8%
- By 2075
- 987,277 · -3.7%
- By 2100
- 921,984 · -10.1%
Race, ethnicity, and origin ACS 2023
- Neighborhood character
- Predominantly Black (71%)
- Race & ethnicity
- Black 71% White 23% Two or more races 4% Hispanic / Latino 1%
- Common ancestry
- Romanian 1% Lithuanian 1% Italian 1%
- Foreign-born
- 3% · Canada, Vietnam
- Languages at home
- 95% English-only · Spanish 1% French/Haitian/Cajun 1%
Political lean MEDSL · St. Louis
- 2024 margin
- Strong D (+23.4) · D 60.8% · R 37.4% · Other 1.7%
- 2008→2024 swing
- +3.5pp toward D · 2008: 19.9pp · 2024: 23.4pp
- All cycles
- 2024: D+23.4 2020: D+24.0 2016: D+16.2 2012: D+13.7 2008: D+19.9
Not yet ingested
- Civics
- —
Market trends
- HPI YoY
- ▲ 13.78%
- Current HPI
- 570.6
- Rent YoY
- ▲ 7.51%
- Metro
- St. Louis, MO-IL
- State GDP YoY
- ▲ 1.84%
- F500 in state
- 20
Industry mix (Fortune 500 HQ in MO)
| Industry | F500 HQs | Revenue |
|---|---|---|
| Healthcare | 1 | $163B |
|
||
| Insurance | 1 | $21B |
|
||
| Industrial Technology | 1 | $17B |
|
||
| Retail | 1 | $16B |
|
||
| Industrial Distribution | 1 | $10B |
|
||
| Utilities | 1 | $9B |
|
||
Price history
1 event — show timeline
- 2026-01-02 Listed $104,900 MARIS as Distributed by MLS Grid
Cash-flow waterfall
monthlySold comps — $/sqft
last 12 mo · ≤1 miLoading sold comps…