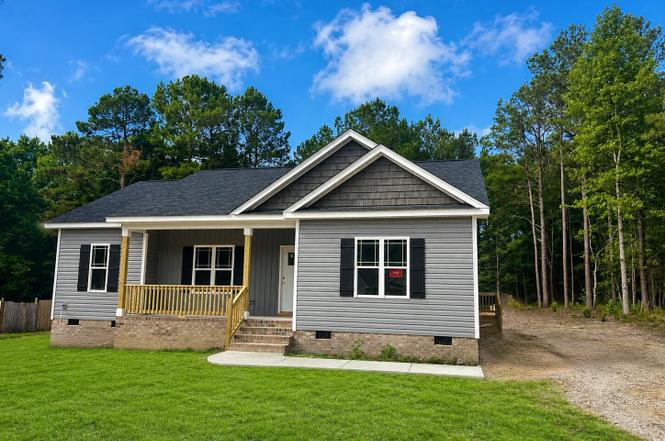
 🏗️ New Construction
368 Bald Eagle Ln · Kenly, NC
Flood risk 1/10 · Minimal
- FEMA flood zone
- X (unshaded)
- Chance of flooding over 30 yrs
- 0.0%
- Est. flood insurance / yr
- $507 – $1,088
Fire risk 4/10 · Minor
- Est. fire insurance / yr
- $906 – $1,684
Heat risk 7/10 · Major
- Hot days now (above 108°F)
- 7 days/yr
- Hot days in 30 yrs
- 17 days/yr
Wind risk 6/10 · Moderate
- Chance of severe wind over 30 yrs
- 73.0%
Air-quality risk 2/10 · Minimal
- Unhealthy air days now
- 1 days/yr
- Unhealthy air days in 30 yrs
- 2 days/yr
Risk factors via First Street. Map © Google.
Why this score? — see what drove the D grade
The composite is a weighted blend of 9 inputs, each scored 0–100. Each bar is that input's sub-score; the figure is the points it added to the 100-point composite (weight × sub-score).
- Appreciation +10.0/10.0
- Cash flow +8.0/30.0
- ARV discount +7.5/15.0
- Schools +3.5/10.0
- Livability +3.4/5.0
- Rent growth +2.5/5.0
- Condition / age +2.5/5.0
- 1% rule +2.4/10.0
- DSCR +2.0/10.0
$269,900
🖨 Deal sheet (PDF) 📄 Offer letter ✓ Due diligence
Listing remarks MLS
The Dustin Plan!~This NEW CONSTRUCTION home features a SPLIT Bedroom Plan! Step inside to the spacious Family Room with vaulted ceiling ~Kitchen and DR combo with walk-in laundry room just off the kitchen ~The Primary bedroom features an ensuite bath with double vanity, soaking tub, separate shower and linen closet ~Tucked away on the other side of the home are 2 guest rooms and another full bath ~NO HOA fees and NO City Taxes! ~Welcome Home
Key facts
- Double vanity
- New construction
- Ensuite bath
Tags
Property features AI
Finance
- Other: Lot size approximately 0.6 acres; Zoning: RAG
- HOA & community: No homeowners association
Exterior
- Parking: Concrete driveway
- Utilities: Public water; Septic tank; Sewer connected; Water connected
- Home design: Site-built single-story home; Entry level: 1; New construction
- Construction: Vinyl siding construction; Shingle roof
- Exterior features: Shingle roof; Vinyl siding; Paved, publicly maintained road access
Interior
- Kitchen: Dishwasher; Microwave; Range
- Bedrooms: 3 bedrooms (all on the main level)
- Flooring: Carpet
- Bathrooms: 2 full bathrooms
- Heating & cooling: Electric forced air heating; Central air conditioning; Ceiling fans
- Interior features: Pantry; Smooth ceilings
- Laundry & utility: Dedicated laundry room
Neighborhood map
What this means for you Summary
Snapshot
- This is a 3-bed/2.0-bath single-family listed at $270k.
Deal economics
- At list price, monthly cash flow is $-271 ($-3k/yr) — negative.
- To cash-flow at today's rent, offer at most $223k (17.4% below list).
- To meet the 1% rule (rent ≥ 1% of price), the offer needs to be $195k (27.8% below list).
- Recommended offer: $195k (27.8% below list) — sets the bar for 1% rule.
- Cap rate 5.1% vs local median 3.5% in Kenly — top-decile yield for the area; either an underpriced asset or a hidden risk that comps aren't pricing in. Stress-test before assuming the spread holds.
Location & tenants
- Location reads 68/100 on livability (#183 in NC) — a middle-class / working-renter tenant base. Strengths: cost of living A+, housing A+, health & safety A+; Watch: amenities F, commute F, employment F.
- Johnston County Public Schools (rural): math 39% / reading 42% proficiency, ranked #105 of 178 in NC (top 59%) — families likely to look elsewhere, expect single-tenant / working-renter base with shorter leases.
- Zoned schools: Princeton Elementary (math 44% / reading 38%, grade F, #680 of 1,410 statewide, top 48%, 713 students, 60% FRL); Johnston Co Early College Academy (math 84% / reading 95%, grade A+, #40 of 535 statewide, top 8%, 281 students, 28% FRL) — zoned schools at 44% FRL track the district average.
- Zoned-school proficiency averages 65% at this address vs 40% district-wide (+25 pts) — the actual schools serving this property are materially stronger than the Johnston County Public Schools average implies; a family-tenant draw the district grade alone would hide.
- Market conditions: 89 active listings in the ZIP; 2,783 units permitted in Johnston County in 2024 (6 in 5+ unit buildings).
Forward outlook
- In year one you build about $28k of equity ($2k loan paydown + $26k appreciation (10.0% local appreciation)).
- Johnston County population projected at +37% by 2050 — long-run rental-demand tailwind backs the buy-and-hold thesis.
- By year 2, paydown + projected appreciation supports a ~$45k cash-out refi (75% LTV) — recoverable capital for the next deal without selling this one.
Negotiation context
- Only 3 days on market — expect competitive offers; lowballing is unlikely to land.
- 2 sale attempts with the ask held roughly flat each time — persistent listings suggest the price (not the market) is what's stuck; bring a comps-based counter.
Risks & watch-outs
- Climate carrying-cost: major wind risk, 73% chance of damaging wind over 30y; extreme-heat days projected 7→17/yr by 2055 (HVAC capex compounding) — expect insurance premiums to compound above CPI over the hold.
Questions for the listing agent
- What do current leases actually rent for vs. the listed asking? Can we see a recent rent roll and the last 12 months of T-12 income?
- Is there a deadline driving the sale (1031 exchange, divorce, estate, relocation)? That informs how much negotiation room exists.
- Schools are F-rated, which usually means shorter tenancies and higher turnover. Who's the typical renter profile here, and what's been the actual vacancy rate?
- The area grade is low — what's the realistic commute time and amenity access for the typical tenant pool here? Any planned neighborhood developments (good or bad) we should know about?
- What's the average days-on-market for RENTAL listings here right now (not sales)? A rising rental-DOM trend means longer vacancies and softer asking-rent achievability than the comps imply.
- What's the recent tenant-quality profile in this submarket — average credit score on applications, eviction rate, late-payment / NSF rate, and stable-employment percentage? A property-management company in the area should have these aggregated.
- How much new for-sale + rental construction is in the pipeline within 1–3 miles? Heavy new supply typically softens prices + rents 12–24 months out; constrained supply supports both.
Investment metrics
- 1% rule
- 0.74% ✗
- Cap rate
- 5.05%
- Cash-on-cash
- -4.43%
- DSCR
- 0.80
- GRM
- 11.2
CMA / ARV
- ARV (on-the-fly)
- $262,052
- Comps found
- 2
Show comp detail 2 sales within ~0.75 mi
| Address | Dist | Beds/Ba | Sqft | Sold | Price | $/sf | Match |
|---|---|---|---|---|---|---|---|
| 39 Blue Heron Ct | 0.15mi | 3/2.0 | 1,391 (+1%) | 11mo | $265,000 | $191 | 82 |
| 4275 Hickory Crossroads Rd | 0.34mi | 3/2.0 | 1,361 (-1%) | 14mo | $240,000 | $176 | 71 |
Match score weights: distance 35% · size 25% · config 20% · recency 20%. Top-matched comps best support the ARV.
Projected returns pro-forma
10.0% appreciation · 3.0% rent growth · sell at horizon
- IRR
- 21.1%
- Equity multiple
- 2.71×
- Total profit
- $125,499
- Equity at exit
- $236,077
- IRR
- 19.1%
- Equity multiple
- 6.22×
- Total profit
- $383,198
- Equity at exit
- $509,109
Cash invested: $73,375 (down + closing). Projections, not guarantees.
Landlord ↔ Tenant lean methodology
- Overall (STATE)
- 85 Strongly Landlord-Friendly
- State North Carolina
- 85 Strongly Landlord-Friendly · R+3
- County
- — inherits STATE
- City
- — inherits STATE
ZIP-level market 27542
- Home prices YoY
- 16.6%
- Active inventory
- 89
- Price-to-rent
- 11.5×
Monthly cashflow live
- Estimated rent
- $1,950 medium interval (Pro) →
- Mortgage (P&I)
- −$1,374
- Tax est. 1.5%
- −$328 /mo · $3,931/yr
- Insurance
- −$109
- HOA
- −$0
- Vacancy / Maint / Mgmt
- −$409
- Net cashflow
- $-271
Break-even live
Sensitivity live
| Price | -10% $-90 | -5% $-180 | +0% $-271 | +5% $-361 | +10% $-452 |
|---|---|---|---|---|---|
| Rent | -10% $-425 | -5% $-348 | +0% $-271 | +5% $-194 | +10% $-117 |
| Rate | -1.0pp $-139 | -0.5pp $-204 | base $-271 | +0.5pp $-339 | +1.0pp $-408 |
UW: 25.0% down · 7.5% · 30yr · 1.5% tax · 5.0% vac · 8.0% maint · 8.0% mgmt
Financing live
Cash to close
- Down payment
- $65,513
- Closing costs
- $7,862
- Reserves months
- —
- Total cash needed
- —
Loan-product check · same deal, 3 products live
Conventional
25% down · 7.5% · 30yr
- Down + closing
- —
- Monthly P&I
- —
- Monthly cashflow
- —
- DSCR
- —
- Eligible?
- —
Personal DTI + credit; lowest rate.
DSCR
20% down · 8.5% · 30yr
- Down + closing
- —
- Monthly P&I
- —
- Monthly cashflow
- —
- DSCR
- —
- Eligible?
- —
No personal income docs; deal must DSCR.
Hard money
10% down · 12.0% · 12mo
- Down + closing
- —
- Monthly P&I
- —
- Monthly cashflow
- —
- DSCR
- —
- Eligible?
- —
Short-term bridge; refi at stabilization.
Listing history 4 events
-
2026-06-21remarks 469-char remark
-
2026-06-21days on market $269,900 Active 3 DOM
-
2026-06-19remarks 446-char remark
-
2026-06-19$269,900 Active 1 DOM
ⓘ Source: listings_history table (triggers on properties + properties_extension) + one-shot
backfill from property_details.listing_events for pre-trigger history.
Climate risk First Street
- Flood 1/10 Low FEMA zone X (unshaded) · 0% chance over 30 yrs
- Wildfire 4/10 Moderate
- Heat 7/10 Severe 7 d/yr ≥108°F today · 17 d/yr by 30 yrs out
- Wind 6/10 Major 73% chance of damaging wind over 30 yrs
- Air quality 2/10 Low 1 unhealthy d/yr today · 2 by 30 yrs out
Nearby sold comps map
Loading sold comps map…
Walkable amenities ~0.75 mi
Loading nearby amenities…
Taxation est. · year 1
- Rental income
- $23,394
- − Mortgage interest
- −$14,679
- − Property taxes
- −$3,931
- − Insurance
- −$1,310
- − Repairs & maintenance
- −$1,872
- − Management
- −$1,872
- − Depreciation
- −$7,623
- Taxable loss
- −$7,892
- Est. tax savings @ 24.0%
- +$1,894
- After-tax cash flow
- $-1,356/yr
For passive investors: Depreciation is non-cash, so a rental often shows a tax loss while cash-flowing — sheltering income. Rental losses are passive: they offset passive income freely, and up to $25,000/yr can offset ordinary (W-2) income if you actively participate and your MAGI is under $100k (phasing out to $0 by $150k); unused losses carry forward. On sale, claimed depreciation is recaptured at up to 25%, and gains may owe capital-gains tax (a 1031 exchange can defer both). Figures are a year-1 estimate at your 24.0% rate — not tax advice; consult a CPA.
Schools (NCES district)
- District
- Johnston County Public Schools
- NCES district ID
- 3702370
- Math proficiency
- 39% ▲ 4.00%
- Reading proficiency
- 42% ▲ 2.00%
- Median HH income
- $50,912
- Composite
- 34.99/100
- National rank
- #5052
- State rank
- #105 of 178 in NC
Livability — Kenly
- Score
- 68/100
- State rank
- #183
- US rank
- #9261
Category grades
Schools grade is shown separately in the Schools card above.
Census & demographics
- Population (ZIP)
- 9,441
Population outlook (Johnston County) Hauer SSP2
- Today (2025)
- 222,440 people
- By 2030
- 240,227 · +8.0%
- By 2040
- 274,616 · +23.5%
- By 2050
- 304,915 · +37.1%
- By 2075
- 369,507 · +66.1%
- By 2100
- 406,280 · +82.6%
Race, ethnicity, and origin ACS 2023
- Neighborhood character
- Predominantly White (74%)
- Race & ethnicity
- White 74% Black 13% Hispanic / Latino 9% Two or more races 9%
- Hispanic origin (detail)
- Mexican 8%
- Common ancestry
- Scotch-Irish 3% Serbian 1% Scottish 1%
- Foreign-born
- 4% · Canada
- Languages at home
- 91% English-only · Spanish 9%
Political lean MEDSL · Johnston
- 2024 margin
- Strong R (+21.5) · D 38.7% · R 60.2% · Other 1.1%
- 2008→2024 swing
- +2.2pp toward D · 2008: -23.7pp · 2024: -21.5pp
- All cycles
- 2024: R+21.5 2020: R+24.3 2016: R+30.7 2012: R+27.8 2008: R+23.7
Not yet ingested
- Civics
- —
Market trends
- HPI YoY
- ▲ 40.03%
- Current HPI
- 280.6408
- Rent YoY
- —
- Metro
- —
- State GDP YoY
- ▲ 3.28%
- F500 in state
- 26
Industry mix (Fortune 500 HQ in NC)
| Industry | F500 HQs | Revenue |
|---|---|---|
| Financial Services | 2 | $213B |
|
||
| Retail | 2 | $95B |
|
||
| Industrial Conglomerate | 1 | $38B |
|
||
| Metals / Steel | 1 | $35B |
|
||
| Utilities | 1 | $30B |
|
||
| Industrial Machinery | 1 | $19B |
|
||
Price history
+0.0% since first listed2 events — show timeline
- 2026-06-18 Listed $269,900 Hive MLS
- 2026-06-18 Listed $269,900 TMLS
Cash-flow waterfall
monthlySold comps — $/sqft
last 12 mo · ≤1 miLoading sold comps…