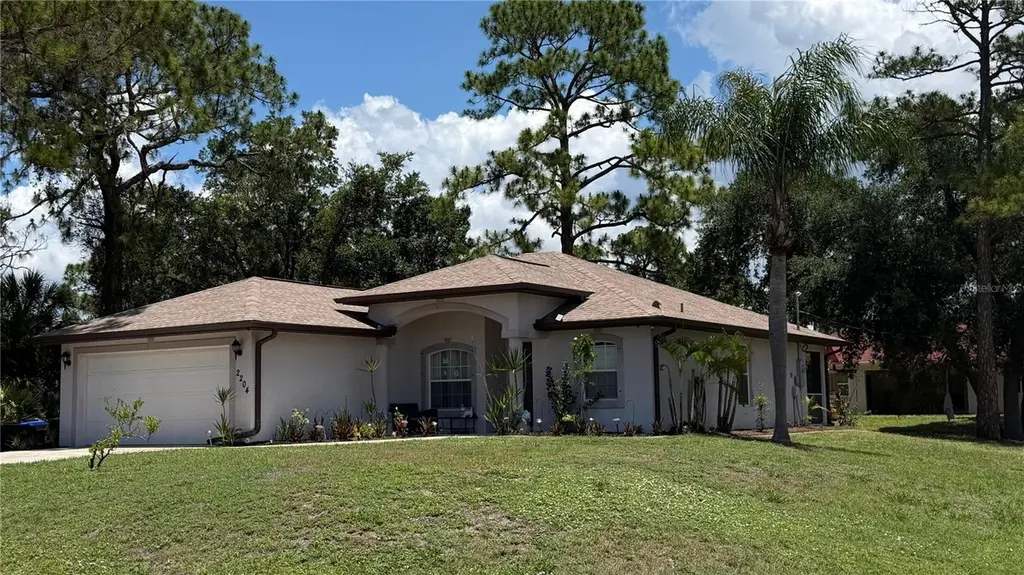
2204 Sparkle Ln · North Port, FL
Flood risk 4/10 · Minor
- FEMA flood zone
- X (unshaded)
- Chance of flooding over 30 yrs
- 0.13%
- Est. flood insurance / yr
- $507 – $1,088
Fire risk 1/10 · Minimal
- Est. fire insurance / yr
- $947 – $1,759
Heat risk 10/10 · Severe
- Hot days now (above 108°F)
- 7 days/yr
- Hot days in 30 yrs
- 28 days/yr
Wind risk 10/10 · Severe
- Chance of severe wind over 30 yrs
- 99.0%
Air-quality risk 3/10 · Minor
- Unhealthy air days now
- 2 days/yr
- Unhealthy air days in 30 yrs
- 3 days/yr
Risk factors via First Street. Map © Google.
Why this score? — see what drove the D grade
The composite is a weighted blend of 9 inputs, each scored 0–100. Each bar is that input's sub-score; the figure is the points it added to the 100-point composite (weight × sub-score).
- Cash flow +12.0/30.0
- ARV discount +7.5/15.0
- Schools +5.4/10.0
- Livability +3.8/5.0
- DSCR +3.5/10.0
- Rent growth +2.8/5.0
- 1% rule +2.6/10.0
- Condition / age +2.5/5.0
- Appreciation +0.0/10.0
$295,000
🖨 Deal sheet 📄 Offer letter ✓ Due diligence
Listing remarks MLS
Located on corner lot, cute traditional home offers shaded yard, ample living space, & screened lanai. close to Heron Creek & Bobcat Trail golf clubs, & North Carlotte Regional Park.
Key facts
- Walk-in closet
- Shaded yard
- Private shower
Tags
Property features AI
Finance
- Other: Partially furnished
- Financial info: No lease restrictions indicated; Annual taxes reported (2025) — amount provided in listing records
- HOA & community: No HOA association indicated
Exterior
- Parking: Attached garage; 2-car garage
- Utilities: Well water; Septic tank; Electricity connected; Public utilities available
- Home design: Single-family residence; One story; Faces southwest
- Construction: Stucco exterior; Shingle roof; Slab foundation; Built on a 0.23-acre lot (approx. 80 x 125)
- Exterior features: Sliding doors; Paved lot; Asphalt road frontage
Interior
- Kitchen: Dishwasher; Range
- Bedrooms: 3 bedrooms
- Flooring: Ceramic tile; Laminate
- Bathrooms: 2 full bathrooms
- Heating & cooling: Central heating; Central air conditioning
- Interior features: Ceiling fans
- Laundry & utility: Indoor laundry
Neighborhood map
What this means for you Summary
Snapshot
- This is a 3-bed/2.0-bath single-family listed at $295k.
Deal economics
- At list price, monthly cash flow is $-71 ($-855/yr) — negative.
- To cash-flow at today's rent, offer at most $282k (4.3% below list).
- To meet the 1% rule (rent ≥ 1% of price), the offer needs to be $225k (23.6% below list).
- Recommended offer: $225k (23.6% below list) — sets the bar for 1% rule.
- Cap rate 6.0% vs local median 3.6% in North Port — top-decile yield for the area; either an underpriced asset or a hidden risk that comps aren't pricing in. Stress-test before assuming the spread holds.
Location & tenants
- Location reads 75/100 on livability (#252 in FL, #3,975 nationally) — a middle-class / working-renter tenant base. Strengths: crime A+, housing A+, health & safety A+; Watch: amenities F, commute F.
- Sarasota (urban): math 63% / reading 63% proficiency, ranked #7 of 73 in FL (top 10%) — acceptable for families but not a draw, mixed tenant base, ~2y average lease.
- Zoned schools: Cranberry Elementary School (math 69% / reading 68%, grade B+, #409 of 2,144 statewide, top 20%, 785 students, 68% FRL); North Port High School (math 44% / reading 57%, grade D+, #171 of 667 statewide, top 26%, 2,562 students, 54% FRL) — zoned schools average 61% FRL vs 42% district-wide (19 pts higher); higher-poverty schools than district average — tighter screening recommended.
- Market conditions: Rents rising (+1.1%/yr); 837 active listings in the ZIP; 3 comparable units currently listed for rent nearby; rentals at typical pace (median 21d on market — plan ~3-4 weeks tenant-placement turnaround); solid renter incomes; 7,466 units permitted in Sarasota County in 2024 (2,138 in 5+ unit buildings).
- This rent runs 34% of the median local income ($81k/yr) — at the standard rent-burdened threshold; future hikes will face affordability resistance.
Forward outlook
- Local home prices are declining (-3.0%/yr); year-one equity from $2k of loan paydown is wiped out by about $9k of value loss. Plan a longer hold.
- Sarasota County population projected at +20% by 2050 — long-run rental-demand tailwind backs the buy-and-hold thesis.
Negotiation context
- It's been on market 16 days — a 2% lower offer ($291k) is reasonable based on typical stale-listing flexibility.
- 2 sale attempts since 15y ago; this cycle's ask has dropped $20k (6%) from the opening price — seller is motivated, your offer sets the floor, not the list.
- Current owner paid $77k; list at $295k implies a 282% gain — meaningful room to come down on a strong offer.
Risks & watch-outs
- Climate carrying-cost: severe wind risk, 99% chance of damaging wind over 30y; extreme-heat days projected 7→28/yr by 2055 (HVAC capex compounding) — expect insurance premiums to compound above CPI over the hold.
Questions for the listing agent
- What do current leases actually rent for vs. the listed asking? Can we see a recent rent roll and the last 12 months of T-12 income?
- Is there a deadline driving the sale (1031 exchange, divorce, estate, relocation)? That informs how much negotiation room exists.
- Schools are B-rated — typically a magnet for longer-tenancy family renters. What's the average tenant stay here, and is there a school-zone premium baked into asking?
- The area grade is low — what's the realistic commute time and amenity access for the typical tenant pool here? Any planned neighborhood developments (good or bad) we should know about?
- What's the average days-on-market for RENTAL listings here right now (not sales)? A rising rental-DOM trend means longer vacancies and softer asking-rent achievability than the comps imply.
- What's the recent tenant-quality profile in this submarket — average credit score on applications, eviction rate, late-payment / NSF rate, and stable-employment percentage? A property-management company in the area should have these aggregated.
- How much new for-sale + rental construction is in the pipeline within 1–3 miles? Heavy new supply typically softens prices + rents 12–24 months out; constrained supply supports both.
Investment metrics
- 1% rule
- 0.76% ✗
- Cap rate
- 6.00%
- Cash-on-cash
- -1.03%
- DSCR
- 0.95
- GRM
- 10.9
CMA / ARV
No comps found within radius.
Projected returns pro-forma
-3.0% appreciation · 1.12% rent growth · sell at horizon
- IRR
- -20.0%
- Equity multiple
- 0.31×
- Total profit
- $-56,604
- Equity at exit
- $43,985
- IRR
- -17.1%
- Equity multiple
- 0.13×
- Total profit
- $-71,994
- Equity at exit
- $25,506
Cash invested: $82,600 (down + closing). Projections, not guarantees.
Landlord ↔ Tenant lean methodology
- Overall (STATE)
- 87 Strongly Landlord-Friendly
- State Florida
- 87 Strongly Landlord-Friendly · R+3
- County
- — inherits STATE
- City
- — inherits STATE
ZIP-level market 34286
- Home prices YoY
- -9.5%
- Rents YoY
- 1.1%
- Active inventory
- 837
- Price-to-rent
- 10.9×
Monthly cashflow live
- Estimated rent
- $2,253 medium interval (Pro) →
- Mortgage (P&I)
- −$1,547
- Tax from tax record
- −$182 /mo · $2,178/yr
- Insurance
- −$123
- HOA
- −$0
- Vacancy / Maint / Mgmt
- −$473
- Net cashflow
- $-71
Break-even live
UW: 25.0% down · 7.5% · 30yr · 1.5% tax · 5.0% vac · 8.0% maint · 8.0% mgmt
Financing live
Cash to close
- Down payment
- $73,750
- Closing costs
- $8,850
- Reserves months
- —
- Total cash needed
- —
Loan-product check · same deal, 3 products live
Conventional
25% down · 7.5% · 30yr
- Down + closing
- —
- Monthly P&I
- —
- Monthly cashflow
- —
- DSCR
- —
- Eligible?
- —
Personal DTI + credit; lowest rate.
DSCR
20% down · 8.5% · 30yr
- Down + closing
- —
- Monthly P&I
- —
- Monthly cashflow
- —
- DSCR
- —
- Eligible?
- —
No personal income docs; deal must DSCR.
Hard money
10% down · 12.0% · 12mo
- Down + closing
- —
- Monthly P&I
- —
- Monthly cashflow
- —
- DSCR
- —
- Eligible?
- —
Short-term bridge; refi at stabilization.
Rent comps 3 comps
| Address | Beds | Baths | Sqft | Rent | $/sqft | DOM | Units | Dist |
|---|---|---|---|---|---|---|---|---|
| 17031 Hillsborough Blvd Port Charlotte, FL | 3.0 | 2.0 | 1751 | $1,850 | $1.06 | 21d | 1 | 1.19mi |
| 16466 Bauers Ave Port Charlotte, FL | 3.0 | 2.0 | 1610 | $2,100 | $1.30 | 21d | 1 | 1.28mi |
| 73 Flamingo Blvd Port Charlotte, FL | 3.0 | 2.0 | 1656 | $2,150 | $1.30 | 21d | 1 | 1.29mi |
Listing history 13 events
-
2026-06-18days on market $295,000 Active 16 DOM
-
2026-06-17days on market $295,000 Active 15 DOM
-
2026-06-16pricedays on market $295,000 Active 14 DOM
-
2026-06-15days on market $315,000 Active 13 DOM
-
2026-06-13days on market $315,000 Active 11 DOM
-
2026-06-13days on market $315,000 Active 10 DOM
-
2026-06-10days on market $315,000 Active 8 DOM
-
2026-06-09days on market $315,000 Active 7 DOM
-
2026-06-08days on market $315,000 Active 6 DOM
-
2026-06-07days on market $315,000 Active 5 DOM
-
2026-06-05days on market $315,000 Active 2 DOM
-
2026-06-03remarks 699-char remark
-
2026-06-03$315,000 Active 1 DOM
ⓘ Source: listings_history table (triggers on properties + properties_extension) + one-shot
backfill from property_details.listing_events for pre-trigger history.
Tax reassessment forecast FL · Resets to sale price
- Current annual tax
- $2,178 · $182/mo
- Projected year-2 tax
- $2,448 · $204/mo
- Expected delta
- +$270/yr (+$23/mo · 12.4%)
ⓘ Screening estimate from a state-policy table — verify with the county assessor before closing.
Climate risk First Street
- Flood 4/10 Moderate FEMA zone X (unshaded) · 13% chance over 30 yrs
- Wildfire 1/10 Low
- Heat 10/10 Extreme 7 d/yr ≥108°F today · 28 d/yr by 30 yrs out
- Wind 10/10 Extreme 99% chance of damaging wind over 30 yrs
- Air quality 3/10 Moderate 2 unhealthy d/yr today · 3 by 30 yrs out
Nearby sold comps map
Loading sold comps map…
Walkable amenities ~0.75 mi
Loading nearby amenities…
Taxation est. · year 1
- Rental income
- $27,042
- − Mortgage interest
- −$16,525
- − Property taxes
- −$2,178
- − Insurance
- −$1,475
- − Repairs & maintenance
- −$2,163
- − Management
- −$2,163
- − Depreciation
- −$8,582
- Taxable loss
- −$6,045
- Est. tax savings @ 24.0%
- +$1,451
- After-tax cash flow
- $596/yr
For passive investors: Depreciation is non-cash, so a rental often shows a tax loss while cash-flowing — sheltering income. Rental losses are passive: they offset passive income freely, and up to $25,000/yr can offset ordinary (W-2) income if you actively participate and your MAGI is under $100k (phasing out to $0 by $150k); unused losses carry forward. On sale, claimed depreciation is recaptured at up to 25%, and gains may owe capital-gains tax (a 1031 exchange can defer both). Figures are a year-1 estimate at your 24.0% rate — not tax advice; consult a CPA.
Schools (NCES district)
- District
- Sarasota
- NCES district ID
- 1201680
- Math proficiency
- 63% ▼ -8.00%
- Reading proficiency
- 63% ▼ -3.00%
- Median HH income
- $51,167
- Composite
- 53.68/100
- National rank
- #1428
- State rank
- #7 of 73 in FL
Livability — North Port
- Score
- 75/100
- State rank
- #252
- US rank
- #3975
Category grades
Schools grade is shown separately in the Schools card above.
Census & demographics
- Census place
- North Port, FL
- County
- Sarasota County · 448,376 people
- City population
- 75,324
- Metro
- North Port-Sarasota-Bradenton, FL
- Population (ZIP)
- 22,534
- Household income
- $80,553
- Rent vs Own
- Severe rent burden
- 545.0
Population outlook (Sarasota County) Hauer SSP2
- Today (2025)
- 452,380 people
- By 2030
- 474,175 · +4.8%
- By 2040
- 511,577 · +13.1%
- By 2050
- 541,467 · +19.7%
- By 2075
- 604,947 · +33.7%
- By 2100
- 621,965 · +37.5%
Race, ethnicity, and origin ACS 2023
- Neighborhood character
- Predominantly White (81%)
- Race & ethnicity
- White 81% Hispanic / Latino 10% Two or more races 8% Black 3% Asian 1%
- Hispanic origin (detail)
- Mexican 2% Puerto Rican 4% Cuban 2%
- Common ancestry
- Romanian 7% Lithuanian 4% Subsaharan African 2%
- Foreign-born
- 9% · Canada
- Languages at home
- 86% English-only · Spanish 7% Russian/Polish/Slavic 4% Other Indo-European 1%
Political lean MEDSL · Sarasota
- 2024 margin
- R (+18.2) · D 40.5% · R 58.7%
- 2008→2024 swing
- -18.1pp toward R · 2008: -0.1pp · 2024: -18.2pp
- All cycles
- 2024: R+18.2 2020: R+10.4 2016: R+11.6 2012: R+7.4 2008: R+0.1
Not yet ingested
- Civics
- —
Market trends
- HPI YoY
- ▼ -31.36%
- Current HPI
- 297.3707
- Rent YoY
- ▲ 1.12%
- Metro
- North Port-Sarasota-Bradenton, FL
- State GDP YoY
- ▲ 3.28%
- F500 in state
- 36
Industry mix (Fortune 500 HQ in FL)
| Industry | F500 HQs | Revenue |
|---|---|---|
| Industrial Technology | 2 | $29B |
|
||
| Insurance | 2 | $17B |
|
||
| Retail | 1 | $60B |
|
||
| Technology Distribution | 1 | $58B |
|
||
| Homebuilding | 1 | $35B |
|
||
| Technology Manufacturing | 1 | $35B |
|
||
Price history
+65.8% since first listed5 events — show timeline
- 2026-06-03 Listed $315,000 Stellar MLS as Distributed by MLS Grid
- 2011-07-19 Sold (Public Records) $77,300 Public Records
- 2011-05-25 Sold (MLS) $77,300 Stellar MLS as Distributed by MLS Grid
- 2011-03-14 Listed $77,000 Stellar MLS as Distributed by MLS Grid
- 2006-07-18 Sold (Public Records) $190,000 Public Records
Property tax history
+1.7%/yrLatest (2025): $2,178 · +6.1% YoY. Source: county tax records.
Cash-flow waterfall
monthlySold comps — $/sqft
last 12 mo · ≤1 miLoading sold comps…