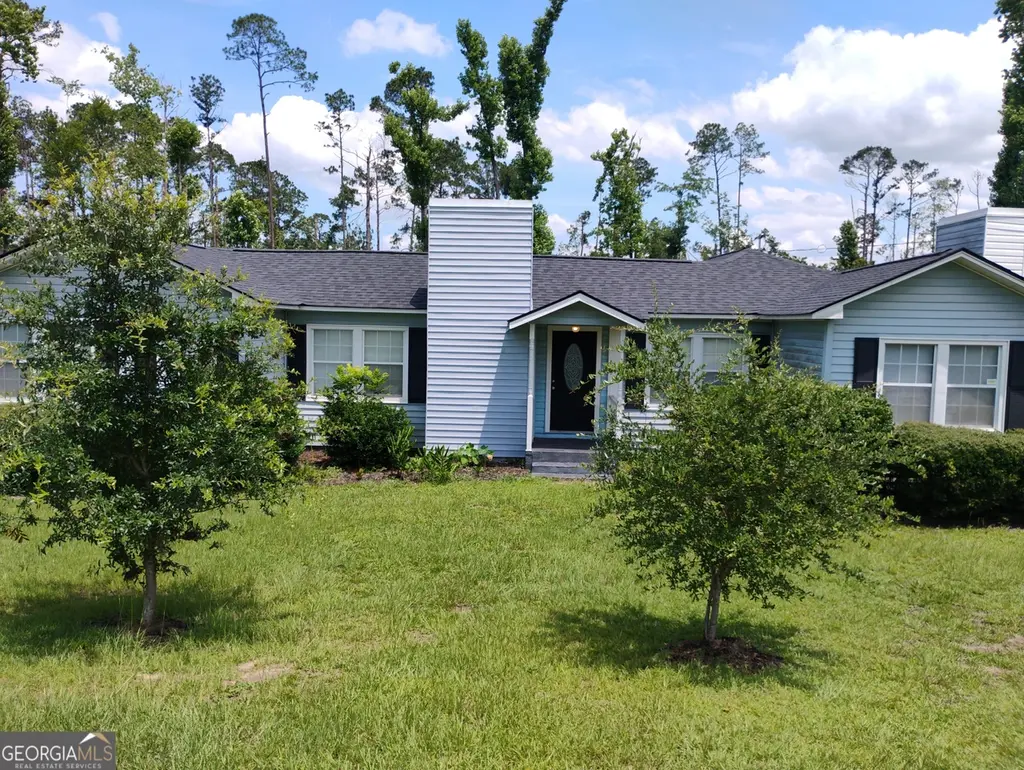
126 N Tallahassee St · Hazlehurst, GA
Flood risk 1/10 · Minimal
- FEMA flood zone
- X (unshaded)
- Chance of flooding over 30 yrs
- 0.0%
- Est. flood insurance / yr
- $507 – $1,088
Fire risk 6/10 · Moderate
- Est. fire insurance / yr
- $963 – $1,789
Heat risk 8/10 · Major
- Hot days now (above 108°F)
- 7 days/yr
- Hot days in 30 yrs
- 17 days/yr
Wind risk 8/10 · Major
- Chance of severe wind over 30 yrs
- 95.0%
Air-quality risk 2/10 · Minimal
- Unhealthy air days now
- 1 days/yr
- Unhealthy air days in 30 yrs
- 1 days/yr
Risk factors via First Street. Map © Google.
Why this score? — see what drove the D grade
The composite is a weighted blend of 9 inputs, each scored 0–100. Each bar is that input's sub-score; the figure is the points it added to the 100-point composite (weight × sub-score).
- Appreciation +10.0/10.0
- Cash flow +9.2/30.0
- ARV discount +5.4/15.0
- Livability +3.1/5.0
- 1% rule +2.6/10.0
- DSCR +2.6/10.0
- Schools +2.6/10.0
- Rent growth +2.5/5.0
- Condition / age +2.5/5.0
$155,000
🖨 Deal sheet (PDF) 📄 Offer letter ✓ Due diligence
Listing remarks MLS
(Imported from ABBR ListingId 19468) This home is a great opportunity for anyone seeking to put a little sweat equity into a property and give it their own decorative touch. It would also be ideal for an investor looking to improve and resale. It features
Key facts
- Remodeled adu
- 1.43 acres
- 1.43 acre lot
Tags
Property features AI
Finance
- Other: Listing terms: Cash or Conventional
- HOA & community: No HOA
Exterior
- Parking: Off-street parking with a parking pad; More than one parking space per unit; Open parking available
- Utilities: Public water; Public sewer; High-speed internet available; Phone service available
- Home design: Single-family residence (house); Resale property
- Construction: Built in 1952; Composition roof; Pillar/post/pier foundation
- Exterior features: Vinyl siding; Lot listed as approximately 1.43 acres; Lot features described as 'Other'
Interior
- Kitchen: Pantry; Dishwasher; Refrigerator
- Bedrooms: 3 bedrooms on the main level
- Flooring: Hardwood floors; Tile floors
- Bathrooms: 2 full bathrooms on the main level
- Heating & cooling: Central heating; Central air; Ceiling fans
- Interior features: One-level home; Public records list 1,644 above-grade finished living area; Living room fireplace
- Laundry & utility: No dedicated laundry features listed; Electric water heater
Neighborhood map
What this means for you Summary
Snapshot
- This is a 3-bed/1.5-bath single-family listed at $155k.
Deal economics
- At list price, monthly cash flow is $-116 ($-1k/yr) — negative.
- To cash-flow at today's rent, offer at most $134k (13.3% below list).
- To meet the 1% rule (rent ≥ 1% of price), the offer needs to be $118k (23.8% below list).
- Recommended offer: $118k (23.8% below list) — sets the bar for 1% rule.
Location & tenants
- Location reads 62/100 on livability (#304 in GA) — a middle-class / working-renter tenant base. Strengths: cost of living A+, housing A+, health & safety A+; Watch: crime F, amenities F, commute F.
- Jeff Davis County (town): math 37% / reading 27% proficiency, ranked #88 of 174 in GA (top 51%) — families likely to look elsewhere, expect single-tenant / working-renter base with shorter leases; 62% free/reduced lunch — lower-income household profile, screen leases tightly.
- Zoned schools: Jeff Davis Primary School (913 students, 79% FRL); Jeff Davis Middle School (math 38% / reading 32%, grade F, #191 of 470 statewide, top 41%, 675 students, 79% FRL); Jeff Davis High School (math 32% / reading 17%, grade F, #184 of 424 statewide, top 48%, 833 students, 58% FRL).
- Market conditions: 51 active listings in the ZIP; 10 units permitted in Jeff Davis County in 2024 (0 in 5+ unit buildings).
Forward outlook
- In year one you build about $17k of equity ($1k loan paydown + $16k appreciation (10.0% local appreciation)).
- Jeff Davis County population projected to shrink 7% by 2050 — rents likely to lag national; underwrite the cash flow, not the appreciation.
- By year 3, paydown + projected appreciation supports a ~$42k cash-out refi (75% LTV) — recoverable capital for the next deal without selling this one.
Negotiation context
- Only 3 days on market — expect competitive offers; lowballing is unlikely to land.
- Current owner paid $83k; list at $155k implies a 87% gain — meaningful room to come down on a strong offer.
Risks & watch-outs
- Watch-outs: built in 1952 — expect roof / HVAC / electrical / plumbing capex.
- Climate carrying-cost: severe wind risk, 95% chance of damaging wind over 30y; major wildfire risk; extreme-heat days projected 7→17/yr by 2055 (HVAC capex compounding) — expect insurance premiums to compound above CPI over the hold.
Questions for the listing agent
- What do current leases actually rent for vs. the listed asking? Can we see a recent rent roll and the last 12 months of T-12 income?
- Built in 1952 — when were the roof, HVAC, electrical panel, plumbing, and water heater last replaced?
- Is there a deadline driving the sale (1031 exchange, divorce, estate, relocation)? That informs how much negotiation room exists.
- Schools are F-rated, which usually means shorter tenancies and higher turnover. Who's the typical renter profile here, and what's been the actual vacancy rate?
- Crime grade is F in this area — have there been break-ins, vandalism, or insurance claims at this property in the last 3 years? What carrier currently insures it and at what premium?
- The area grade is low — what's the realistic commute time and amenity access for the typical tenant pool here? Any planned neighborhood developments (good or bad) we should know about?
- What's the average days-on-market for RENTAL listings here right now (not sales)? A rising rental-DOM trend means longer vacancies and softer asking-rent achievability than the comps imply.
- What's the recent tenant-quality profile in this submarket — average credit score on applications, eviction rate, late-payment / NSF rate, and stable-employment percentage? A property-management company in the area should have these aggregated.
- How much new for-sale + rental construction is in the pipeline within 1–3 miles? Heavy new supply typically softens prices + rents 12–24 months out; constrained supply supports both.
Investment metrics
- 1% rule
- 0.76% ✗
- Cap rate
- 5.39%
- Cash-on-cash
- -3.22%
- DSCR
- 0.86
- GRM
- 10.9
CMA / ARV
- ARV (on-the-fly)
- $148,096
- Comps found
- 11
Show comp detail 11 sales within ~0.75 mi
| Address | Dist | Beds/Ba | Sqft | Sold | Price | $/sf | Match |
|---|---|---|---|---|---|---|---|
| 34 Jarman St | 0.48mi | 3/2.0 | 1,678 (+1%) | 12mo | $235,000 | $140 | 64 |
| 36 N Cromartie St | 0.56mi | 2/2.0 (-1) | 1,677 (+1%) | 3mo | $126,000 | $75 | 63 |
| 10 W First Ave | 0.47mi | 3/2.0 | 1,538 (-8%) | 4mo | $137,500 | $89 | 60 |
| 39 N Tallahassee St | 0.48mi | 4/1.0 (+1) | 1,736 (+4%) | 5mo | $95,000 | $55 | 59 |
| 49 N Gill St | 0.56mi | 3/2.0 | 1,551 (-7%) | 2mo | $145,000 | $93 | 58 |
| 14 W Plum St | 0.14mi | 2/1.0 (-1) | 1,464 (-12%) | 12mo | $45,000 | $31 | 56 |
| 9 Kersey St | 0.74mi | 3/2.0 | 1,802 (+8%) | 7mo | $125,000 | $69 | 44 |
| 27 Park Ave | 0.69mi | 3/2.0 | 1,872 (+12%) | 2mo | $195,000 | $104 | 43 |
| — | 0.70mi | 3/2.0 | 1,800 (+8%) | 18mo | $844,685 | $469 | 37 |
| 12 Park Ave | 0.62mi | 3/2.0 | 1,500 (-10%) | 23mo | $190,000 | $127 | 34 |
| 150 N Gill St | 0.70mi | 3/1.5 | 1,850 (+11%) | 23mo | $90,000 | $49 | 29 |
Match score weights: distance 35% · size 25% · config 20% · recency 20%. Top-matched comps best support the ARV.
Projected returns pro-forma
10.0% appreciation · 3.0% rent growth · sell at horizon
- IRR
- 22.0%
- Equity multiple
- 2.77×
- Total profit
- $77,004
- Equity at exit
- $139,636
- IRR
- 19.8%
- Equity multiple
- 6.36×
- Total profit
- $232,605
- Equity at exit
- $301,131
Cash invested: $43,400 (down + closing). Projections, not guarantees.
Landlord ↔ Tenant lean methodology
- Overall (STATE)
- 90 Strongly Landlord-Friendly
- State Georgia
- 90 Strongly Landlord-Friendly · R+3
- County
- — inherits STATE
- City
- — inherits STATE
ZIP-level market 31539
- Home prices YoY
- 4.7%
- Active inventory
- 51
- Price-to-rent
- 10.9×
Monthly cashflow live
- Estimated rent
- $1,180 medium interval (Pro) →
- Mortgage (P&I)
- −$813
- Tax from tax record
- −$172 /mo · $2,059/yr
- Insurance
- −$65
- HOA
- −$0
- Vacancy / Maint / Mgmt
- −$248
- Net cashflow
- $-116
Break-even live
Sensitivity live
| Price | -10% $-29 | -5% $-73 | +0% $-116 | +5% $-160 | +10% $-204 |
|---|---|---|---|---|---|
| Rent | -10% $-210 | -5% $-163 | +0% $-116 | +5% $-70 | +10% $-23 |
| Rate | -1.0pp $-38 | -0.5pp $-77 | base $-116 | +0.5pp $-157 | +1.0pp $-197 |
UW: 25.0% down · 7.5% · 30yr · 1.5% tax · 5.0% vac · 8.0% maint · 8.0% mgmt
Financing live
Cash to close
- Down payment
- $38,750
- Closing costs
- $4,650
- Reserves months
- —
- Total cash needed
- —
Loan-product check · same deal, 3 products live
Conventional
25% down · 7.5% · 30yr
- Down + closing
- —
- Monthly P&I
- —
- Monthly cashflow
- —
- DSCR
- —
- Eligible?
- —
Personal DTI + credit; lowest rate.
DSCR
20% down · 8.5% · 30yr
- Down + closing
- —
- Monthly P&I
- —
- Monthly cashflow
- —
- DSCR
- —
- Eligible?
- —
No personal income docs; deal must DSCR.
Hard money
10% down · 12.0% · 12mo
- Down + closing
- —
- Monthly P&I
- —
- Monthly cashflow
- —
- DSCR
- —
- Eligible?
- —
Short-term bridge; refi at stabilization.
Listing history 4 events
-
2026-06-21days on market $155,000 Coming Soon 3 DOM
-
2026-06-21days on market $155,000 Coming Soon 2 DOM
-
2026-06-18remarks 699-char remark
-
2026-06-18$155,000 Coming Soon 1 DOM
ⓘ Source: listings_history table (triggers on properties + properties_extension) + one-shot
backfill from property_details.listing_events for pre-trigger history.
Tax reassessment forecast GA · Resets to sale price
- Current annual tax
- $2,059 · $172/mo
- Projected year-2 tax
- $2,059 · $172/mo
- Expected delta
- $0/yr ($0/mo · 0.0%)
ⓘ Screening estimate from a state-policy table — verify with the county assessor before closing.
Climate risk First Street
- Flood 1/10 Low FEMA zone X (unshaded) · 0% chance over 30 yrs
- Wildfire 6/10 Major
- Heat 8/10 Severe 7 d/yr ≥108°F today · 17 d/yr by 30 yrs out
- Wind 8/10 Severe 95% chance of damaging wind over 30 yrs
- Air quality 2/10 Low 1 unhealthy d/yr today · 1 by 30 yrs out
Nearby sold comps map
Loading sold comps map…
Walkable amenities ~0.75 mi
Loading nearby amenities…
Taxation est. · year 1
- Rental income
- $14,165
- − Mortgage interest
- −$8,682
- − Property taxes
- −$2,059
- − Insurance
- −$775
- − Repairs & maintenance
- −$1,133
- − Management
- −$1,133
- − Depreciation
- −$4,509
- Taxable loss
- −$4,127
- Est. tax savings @ 24.0%
- +$990
- After-tax cash flow
- $-407/yr
For passive investors: Depreciation is non-cash, so a rental often shows a tax loss while cash-flowing — sheltering income. Rental losses are passive: they offset passive income freely, and up to $25,000/yr can offset ordinary (W-2) income if you actively participate and your MAGI is under $100k (phasing out to $0 by $150k); unused losses carry forward. On sale, claimed depreciation is recaptured at up to 25%, and gains may owe capital-gains tax (a 1031 exchange can defer both). Figures are a year-1 estimate at your 24.0% rate — not tax advice; consult a CPA.
Schools (NCES district)
- District
- Jeff Davis County
- NCES district ID
- 1303000
- Math proficiency
- 37% ▼ -7.00%
- Reading proficiency
- 27% ▼ -9.00%
- Median HH income
- $35,039
- Composite
- 26.48/100
- National rank
- #7210
- State rank
- #88 of 174 in GA
Livability — Hazlehurst
- Score
- 62/100
- State rank
- #304
- US rank
- #16301
Category grades
Schools grade is shown separately in the Schools card above.
Census & demographics
- Census place
- Hazlehurst, GA
- Population (ZIP)
- 14,117
Population outlook (Jeff Davis County) Hauer SSP2
- Today (2025)
- 14,544 people
- By 2030
- 14,298 · -1.7%
- By 2040
- 13,871 · -4.6%
- By 2050
- 13,488 · -7.3%
- By 2075
- 12,622 · -13.2%
- By 2100
- 12,020 · -17.4%
Race, ethnicity, and origin ACS 2023
- Neighborhood character
- Predominantly White (68%)
- Race & ethnicity
- White 68% Black 14% Hispanic / Latino 14% Two or more races 12%
- Hispanic origin (detail)
- Mexican 9% Puerto Rican 1% Cuban 3%
- Common ancestry
- Slovak 2%
- Foreign-born
- 6% · Canada
- Languages at home
- 89% English-only · Spanish 11%
Political lean MEDSL · Jeff Davis
- 2024 margin
- Solid R (+68.3) · D 15.7% · R 84.0%
- 2008→2024 swing
- -20.7pp toward R · 2008: -47.6pp · 2024: -68.3pp
- All cycles
- 2024: R+68.3 2020: R+63.5 2016: R+62.9 2012: R+51.1 2008: R+47.6
Not yet ingested
- Civics
- —
Market trends
- HPI YoY
- ▲ 10.92%
- Current HPI
- 245.3619
- Rent YoY
- —
- Metro
- —
- State GDP YoY
- ▲ 2.66%
- F500 in state
- 28
Industry mix (Fortune 500 HQ in GA)
| Industry | F500 HQs | Revenue |
|---|---|---|
| Paper / Packaging | 2 | $29B |
|
||
| Retail | 1 | $160B |
|
||
| Transportation / Logistics | 1 | $91B |
|
||
| Airlines | 1 | $62B |
|
||
| Consumer Goods | 1 | $47B |
|
||
| Utilities | 1 | $25B |
|
||
Price history
+124.6% since first listed4 events — show timeline
- 2026-06-18 Coming Soon $155,000 GAMLS
- 2022-05-03 Sold (Public Records) $83,000 Public Records
- 2022-04-13 Sold (MLS) $83,000 GAMLS
- 2021-12-17 Listed $69,000 GAMLS
Property tax history
+6.5%/yrLatest (2025): $2,059 · +6.3% YoY. Source: county tax records.
Cash-flow waterfall
monthlySold comps — $/sqft
last 12 mo · ≤1 miLoading sold comps…