 🏗️ New Construction
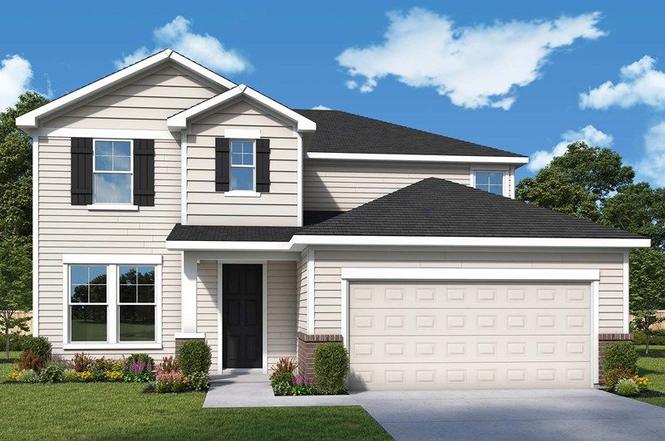
Moonshadow Plan · Jacksonville, FL
Flood risk 1/10 · Minimal
- FEMA flood zone
- X (unshaded)
- Chance of flooding over 30 yrs
- 0.0%
- Est. flood insurance / yr
- $507 – $1,088
Fire risk 7/10 · Major
- Est. fire insurance / yr
- $947 – $1,759
Heat risk 9/10 · Severe
- Hot days now (above 107°F)
- 7 days/yr
- Hot days in 30 yrs
- 20 days/yr
Wind risk 9/10 · Severe
- Chance of severe wind over 30 yrs
- 99.0%
Air-quality risk 5/10 · Moderate
- Unhealthy air days now
- 8 days/yr
- Unhealthy air days in 30 yrs
- 10 days/yr
Risk factors via First Street. Map © Google.
Why this score? — see what drove the D grade
The composite is a weighted blend of 9 inputs, each scored 0–100. Each bar is that input's sub-score; the figure is the points it added to the 100-point composite (weight × sub-score).
- Appreciation +10.0/10.0
- ARV discount +7.5/15.0
- Schools +6.0/10.0
- Cash flow +5.7/30.0
- Livability +4.2/5.0
- Rent growth +3.2/5.0
- Condition / age +2.5/5.0
- 1% rule +1.1/10.0
- DSCR +0.1/10.0
$426,900
🖨 Deal sheet (PDF) 📄 Offer letter ✓ Due diligence
Listing remarks
Award-winning design and genuine comforts make each day delightful in The Moonshadow floor plan by David Weekley Homes in Tributary. It's easy to wake up on the right side of the bed in the penthouse Owner's Retreat, which includes a contemporary en suite Owner's Bath and a walk-in closet. A pair of junior bedrooms separated by a closet wall share a full bathroom on the upper level. The main gathering areas rest on the main level of this home, and include a streamlined kitchen, adjacent dining space, sunlit study and a spacious family room overlooking the backyard and lanai. The upstairs retreat provides even more space to spend time together or pursue individual hobbies. Send the David Wee
Key facts
- Fitness center
- Resort-style pool
- 2 garage spots
Tags
Property features AI
Finance
- Other: Status: Active; Inventory type: Plan
- Financial info: List price: $421,900
Exterior
- Parking: 2 total parking spaces; 2-car garage
- Home design: Single-family home (new construction); Address: 75768 Lily Pond Ct, Yulee, FL 32097
- Exterior features: Living area of 2,656 (living area provided)
Interior
- Bedrooms: 4 bedrooms
- Bathrooms: 3 full bathrooms
- Interior features: Plan: Moonshadow (new construction plan)
Neighborhood map
What this means for you Summary
Snapshot
- This is a 4-bed/3.0-bath single-family listed at $427k.
Deal economics
- At list price, monthly cash flow is $-990 ($-12k/yr) — negative.
- To cash-flow at today's rent, offer at most $338k (20.9% below list).
- To meet the 1% rule (rent ≥ 1% of price), the offer needs to be $295k (30.8% below list).
- Recommended offer: $295k (30.8% below list) — sets the bar for 1% rule.
Location & tenants
- Location reads 83/100 on livability (#50 in FL, #911 nationally) — a professional / high-income tenant draw. Strengths: amenities A+, commute A+, housing A+.
- Nassau (town): math 74% / reading 65% proficiency, ranked #4 of 73 in FL (top 6%) — acceptable for families but not a draw, mixed tenant base, ~2y average lease.
- Market conditions: Rents rising (+2.9%/yr); 601 active listings in the ZIP; 9 comparable units currently listed for rent nearby; rentals at typical pace (median 17d on market — plan ~3-4 weeks tenant-placement turnaround); solid renter incomes; 953 units permitted in Nassau County in 2024 (24 in 5+ unit buildings).
- This rent runs 38% of the median local income ($93k/yr) — at the standard rent-burdened threshold; future hikes will face affordability resistance.
Forward outlook
- In year one you build about $51k of equity ($3k loan paydown + $48k appreciation (10.0% local appreciation)).
- Nassau County population projected at +17% by 2050 — long-run rental-demand tailwind backs the buy-and-hold thesis.
- By year 2, paydown + projected appreciation supports a ~$83k cash-out refi (75% LTV) — recoverable capital for the next deal without selling this one.
Negotiation context
- It's been on market 445 days — a 12% lower offer ($376k) is reasonable based on typical stale-listing flexibility.
Risks & watch-outs
- Climate carrying-cost: severe wind risk, 99% chance of damaging wind over 30y; major wildfire risk; extreme-heat days projected 7→20/yr by 2055 (HVAC capex compounding) — expect insurance premiums to compound above CPI over the hold.
Questions for the listing agent
- What do current leases actually rent for vs. the listed asking? Can we see a recent rent roll and the last 12 months of T-12 income?
- It's been on market 445 days. Have you received any prior offers? Is the seller open to a 31% concession, seller financing, or rate buy-down credit?
- Why hasn't it sold? Are there any deal-killer items the seller is aware of (foundation, flood, title, zoning, code violations)?
- Is there a deadline driving the sale (1031 exchange, divorce, estate, relocation)? That informs how much negotiation room exists.
- Schools are B-rated — typically a magnet for longer-tenancy family renters. What's the average tenant stay here, and is there a school-zone premium baked into asking?
- The area grade is low — what's the realistic commute time and amenity access for the typical tenant pool here? Any planned neighborhood developments (good or bad) we should know about?
- What's the average days-on-market for RENTAL listings here right now (not sales)? A rising rental-DOM trend means longer vacancies and softer asking-rent achievability than the comps imply.
- What's the recent tenant-quality profile in this submarket — average credit score on applications, eviction rate, late-payment / NSF rate, and stable-employment percentage? A property-management company in the area should have these aggregated.
- How much new for-sale + rental construction is in the pipeline within 1–3 miles? Heavy new supply typically softens prices + rents 12–24 months out; constrained supply supports both.
Investment metrics
- 1% rule
- 0.61% ✗
- Cap rate
- 3.82%
- Cash-on-cash
- -8.82%
- DSCR
- 0.61
- GRM
- 13.6
CMA / ARV
- ARV (on-the-fly)
- $480,736
- Comps found
- 12
Show comp detail 12 sales within ~0.75 mi
| Address | Dist | Beds/Ba | Sqft | Sold | Price | $/sf | Match |
|---|---|---|---|---|---|---|---|
| 75197 Pondside Ln | 0.28mi | 4/3.0 | 2,660 (+0%) | 0mo | $485,000 | $182 | 87 |
| 75077 Pondside Ln | 0.43mi | 4/3.0 | 2,659 (+0%) | 2mo | $480,000 | $181 | 78 |
| 75556 Canterwood Dr | 0.43mi | 5/3.0 (+1) | 2,640 (-1%) | 1mo | $465,000 | $176 | 73 |
| 75547 Cloverwood Ct | 0.14mi | 3/2.5 (-1) | 2,370 (-11%) | 3mo | $430,000 | $181 | 66 |
| 75263 Weathersford Pl | 0.36mi | 4/3.0 | 2,288 (-14%) | 1mo | $440,000 | $192 | 59 |
| 75751 Bayley Pl | 0.73mi | 4/3.5 | 2,772 (+4%) | 1mo | $474,606 | $171 | 56 |
| 75492 Banyan Way | 0.52mi | 4/3.0 | 2,390 (-10%) | 4mo | $430,000 | $180 | 56 |
| 75598 Banyan Way | 0.57mi | 4/3.0 | 2,390 (-10%) | 2mo | $469,290 | $196 | 55 |
| 75582 Blackbird Dr | 0.40mi | 3/2.5 (-1) | 2,350 (-12%) | 4mo | $433,675 | $185 | 52 |
| 75013 Pondside Ln | 0.49mi | 4/2.5 | 2,295 (-14%) | 3mo | $378,000 | $165 | 50 |
| 75783 Bayley Pl | 0.72mi | 5/3.5 (+1) | 2,754 (+4%) | 3mo | $460,000 | $167 | 50 |
| 75791 Bayley Pl | 0.72mi | 4/3.0 | 2,390 (-10%) | 2mo | $461,780 | $193 | 48 |
Match score weights: distance 35% · size 25% · config 20% · recency 20%. Top-matched comps best support the ARV.
Projected returns pro-forma
10.0% appreciation · 2.88% rent growth · sell at horizon
- IRR
- 18.0%
- Equity multiple
- 2.47×
- Total profit
- $198,483
- Equity at exit
- $433,085
- IRR
- 16.9%
- Equity multiple
- 5.71×
- Total profit
- $633,434
- Equity at exit
- $933,964
Cash invested: $134,606 (down + closing). Projections, not guarantees.
Landlord ↔ Tenant lean methodology
- Overall (STATE)
- 87 Strongly Landlord-Friendly
- State Florida
- 87 Strongly Landlord-Friendly · R+3
- County
- — inherits STATE
- City
- — inherits STATE
ZIP-level market 32097
- Home prices YoY
- 19.5%
- Rents YoY
- 2.9%
- Active inventory
- 601
- Price-to-rent
- 12.0×
Monthly cashflow live
- Estimated rent
- $2,953 high interval (Pro) →
- Mortgage (P&I)
- −$2,521
- Tax est. 1.5%
- −$601 /mo · $7,211/yr
- Insurance
- −$200
- HOA
- −$0
- Vacancy / Maint / Mgmt
- −$620
- Net cashflow
- $-990
Break-even live
Sensitivity live
| Price | -10% $-657 | -5% $-823 | +0% $-990 | +5% $-1,156 | +10% $-1,322 |
|---|---|---|---|---|---|
| Rent | -10% $-1,223 | -5% $-1,106 | +0% $-990 | +5% $-873 | +10% $-756 |
| Rate | -1.0pp $-747 | -0.5pp $-867 | base $-990 | +0.5pp $-1,114 | +1.0pp $-1,241 |
UW: 25.0% down · 7.5% · 30yr · 1.5% tax · 5.0% vac · 8.0% maint · 8.0% mgmt
Financing live
Cash to close
- Down payment
- $120,184
- Closing costs
- $14,422
- Reserves months
- —
- Total cash needed
- —
Loan-product check · same deal, 3 products live
Conventional
25% down · 7.5% · 30yr
- Down + closing
- —
- Monthly P&I
- —
- Monthly cashflow
- —
- DSCR
- —
- Eligible?
- —
Personal DTI + credit; lowest rate.
DSCR
20% down · 8.5% · 30yr
- Down + closing
- —
- Monthly P&I
- —
- Monthly cashflow
- —
- DSCR
- —
- Eligible?
- —
No personal income docs; deal must DSCR.
Hard money
10% down · 12.0% · 12mo
- Down + closing
- —
- Monthly P&I
- —
- Monthly cashflow
- —
- DSCR
- —
- Eligible?
- —
Short-term bridge; refi at stabilization.
Rent comps 9 comps
| Address | Beds | Baths | Sqft | Rent | $/sqft | DOM | Units | Dist |
|---|---|---|---|---|---|---|---|---|
| 75470 Sunberry Dr Yulee, FL | 5.0 | 4.0 | 2903 | $3,150 | $1.09 | 21d | 1 | 0.37mi |
| 75094 Fern Creek Dr Yulee, FL | 4.0 | 2.0 | 2193 | $2,495 | $1.14 | 4d | 1 | 1.07mi |
| 75047 Brookwood Dr Yulee, FL | 5.0 | 3.0 | 3300 | $3,405 | $1.03 | 6d | 1 | 1.12mi |
| 75094 Glenspring Way Yulee, FL | 3.0 | 2.0 | 2055 | $2,500 | $1.22 | 25d | 1 | 1.13mi |
| 76195 Deerwood Dr Yulee, FL | 4.0 | 2.5 | 2757 | $2,475 | $0.90 | 25d | 1 | 1.16mi |
| 65013 Lagoon Forest Dr Yulee, FL | 4.0 | 2.5 | 2245 | $2,800 | $1.25 | 12d | 1 | 1.22mi |
| 75008 Morning Glen Ct Yulee, FL | 4.0 | 2.0 | 1856 | $2,300 | $1.24 | 25d | 1 | 1.27mi |
| 75215 Fern Creek Dr Yulee, FL | 4.0 | 2.5 | 2898 | $2,900 | $1.00 | 16d | 1 | 1.31mi |
| 75075 Morning Glen Ct Yulee, FL | 4.0 | 2.0 | 1856 | $2,399 | $1.29 | 6d | 1 | 1.34mi |
Listing history 15 events
-
2026-06-21days on market $426,900 Active 445 DOM
-
2026-06-18days on market $426,900 Active 442 DOM
-
2026-06-17days on market $426,900 Active 441 DOM
-
2026-06-16days on market $426,900 Active 440 DOM
-
2026-06-15days on market $426,900 Active 439 DOM
-
2026-06-13days on market $426,900 Active 437 DOM
-
2026-06-13days on market $426,900 Active 436 DOM
-
2026-06-09days on market $426,900 Active 433 DOM
-
2026-06-08days on market $426,900 Active 432 DOM
-
2026-06-07pricedays on market $426,900 Active 431 DOM
-
2026-06-05days on market $421,900 Active 428 DOM
-
2026-06-03days on market $421,900 Active 427 DOM
-
2026-06-02days on market $421,900 Active 426 DOM
-
2026-06-01days on market $421,900 Active 425 DOM
-
2026-05-31days on market $421,900 Active 424 DOM
ⓘ Source: listings_history table (triggers on properties + properties_extension) + one-shot
backfill from property_details.listing_events for pre-trigger history.
Climate risk First Street
- Flood 1/10 Low FEMA zone X (unshaded) · 0% chance over 30 yrs
- Wildfire 7/10 Severe
- Heat 9/10 Extreme 7 d/yr ≥107°F today · 20 d/yr by 30 yrs out
- Wind 9/10 Extreme 99% chance of damaging wind over 30 yrs
- Air quality 5/10 Major 8 unhealthy d/yr today · 10 by 30 yrs out
Nearby sold comps map
Loading sold comps map…
Walkable amenities ~0.75 mi
Loading nearby amenities…
Taxation est. · year 1
- Rental income
- $35,433
- − Mortgage interest
- −$26,929
- − Property taxes
- −$7,211
- − Insurance
- −$2,404
- − Repairs & maintenance
- −$2,835
- − Management
- −$2,835
- − Depreciation
- −$13,985
- Taxable loss
- −$20,765
- Est. tax savings @ 24.0%
- +$4,984
- After-tax cash flow
- $-6,891/yr
For passive investors: Depreciation is non-cash, so a rental often shows a tax loss while cash-flowing — sheltering income. Rental losses are passive: they offset passive income freely, and up to $25,000/yr can offset ordinary (W-2) income if you actively participate and your MAGI is under $100k (phasing out to $0 by $150k); unused losses carry forward. On sale, claimed depreciation is recaptured at up to 25%, and gains may owe capital-gains tax (a 1031 exchange can defer both). Figures are a year-1 estimate at your 24.0% rate — not tax advice; consult a CPA.
Schools (NCES district)
- District
- Nassau
- NCES district ID
- 1201350
- Math proficiency
- 74% ▼ -2.00%
- Reading proficiency
- 65% ▼ -2.00%
- Median HH income
- $58,267
- Composite
- 59.79/100
- National rank
- #899
- State rank
- #4 of 73 in FL
Livability — Jacksonville
- Score
- 83/100
- State rank
- #50
- US rank
- #911
Category grades
Schools grade is shown separately in the Schools card above.
Census & demographics
- County
- Nassau County · 67,729 people
- City population
- 979,034
- Metro
- Jacksonville, FL
- Population (ZIP)
- 26,700
- Household income
- $93,161
- Rent vs Own
- Severe rent burden
- 404.0
Population outlook (Nassau County) Hauer SSP2
- Today (2025)
- 88,419 people
- By 2030
- 92,679 · +4.8%
- By 2040
- 99,257 · +12.3%
- By 2050
- 103,378 · +16.9%
- By 2075
- 109,726 · +24.1%
- By 2100
- 107,006 · +21.0%
Race, ethnicity, and origin ACS 2023
- Neighborhood character
- Predominantly White (75%)
- Race & ethnicity
- White 75% Two or more races 9% Black 9% Hispanic / Latino 8% Asian 1% Native American 1%
- Hispanic origin (detail)
- Mexican 2% Puerto Rican 2%
- Common ancestry
- Lithuanian 4% Italian 3% Romanian 2%
- Foreign-born
- 4% · Canada, Vietnam
- Languages at home
- 93% English-only · Spanish 5% Vietnamese 1%
Political lean MEDSL · Nassau
- 2024 margin
- Solid R (+46.9) · D 26.1% · R 73.1%
- 2008→2024 swing
- -3.1pp toward R · 2008: -43.8pp · 2024: -46.9pp
- All cycles
- 2024: R+46.9 2020: R+45.9 2016: R+50.2 2012: R+48.6 2008: R+43.8
Not yet ingested
- Civics
- —
Market trends
- HPI YoY
- ▲ 49.35%
- Current HPI
- 301.9299
- Rent YoY
- ▲ 2.88%
- Metro
- Jacksonville, FL
- State GDP YoY
- ▲ 3.28%
- F500 in state
- 36
Industry mix (Fortune 500 HQ in FL)
| Industry | F500 HQs | Revenue |
|---|---|---|
| Industrial Technology | 2 | $29B |
|
||
| Insurance | 2 | $17B |
|
||
| Retail | 1 | $60B |
|
||
| Technology Distribution | 1 | $58B |
|
||
| Homebuilding | 1 | $35B |
|
||
| Technology Manufacturing | 1 | $35B |
|
||
Cash-flow waterfall
monthlySold comps — $/sqft
last 12 mo · ≤1 miLoading sold comps…