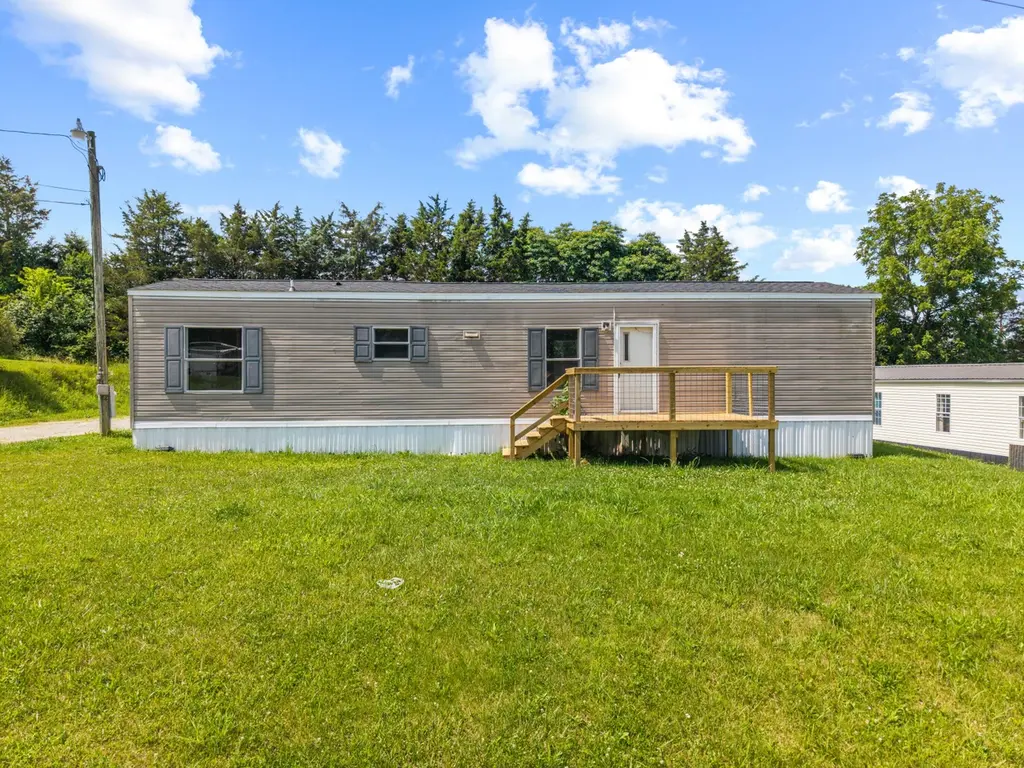
154 Trueblood Rd · Monticello, KY
Flood risk 1/10 · Minimal
- FEMA flood zone
- X (unshaded)
- Chance of flooding over 30 yrs
- 0.0%
- Est. flood insurance / yr
- $507 – $1,088
Fire risk 5/10 · Moderate
- Est. fire insurance / yr
- $839 – $1,559
Heat risk 4/10 · Minor
- Hot days now (above 101°F)
- 7 days/yr
- Hot days in 30 yrs
- 20 days/yr
Wind risk 3/10 · Minor
- Chance of severe wind over 30 yrs
- 5.0%
Air-quality risk 1/10 · Minimal
- Unhealthy air days now
- 0 days/yr
- Unhealthy air days in 30 yrs
- 0 days/yr
Risk factors via First Street. Map © Google.
Why this score? — see what drove the B- grade
The composite is a weighted blend of 9 inputs, each scored 0–100. Each bar is that input's sub-score; the figure is the points it added to the 100-point composite (weight × sub-score).
- Cash flow +30.0/30.0
- DSCR +10.0/10.0
- 1% rule +8.0/10.0
- ARV discount +7.5/15.0
- Livability +3.2/5.0
- Rent growth +2.5/5.0
- Condition / age +2.5/5.0
- Schools +2.1/10.0
- Appreciation +0.0/10.0
$84,900
🖨 Deal sheet 📄 Offer letter ✓ Due diligence
Listing remarks MLS
Great starter or weekend home. This 3 bed, 2 bath home sits on .36 acres and is ready for new owners. Located only a few miles from downtown and less than 15 minutes from Conley Bottom Resort on Lake Cumberland. Plenty of level room to park a boat, jet skis or camper. Call today to schedule a showing.
Key facts
- Lake cumberland
- Outdoor recreation
- Private bathroom
Tags
Property features AI
Exterior
- Utilities: Public water; Septic tank; Electricity connected; Cable available; Phone available; Water connected
- Home design: Manufactured house; One story
- Construction: Vinyl siding; Shingle roof; Crawl space foundation; Built area approximately 864
- Exterior features: Shed(s)
Interior
- Kitchen: Refrigerator; Oven
- Flooring: Laminate flooring
- Bathrooms: 2 full bathrooms
- Heating & cooling: Electric heating; Heat pump; Electric cooling
- Interior features: Primary bedroom on the first floor; Ceiling fan(s)
- Laundry & utility: Washer hookup; Electric dryer hookup; Laundry on main level
Neighborhood map
What this means for you Summary
Snapshot
- This is a 3-bed/2.0-bath manufactured listed at $85k.
Deal economics
- At list price, monthly cash flow is $348 ($4k/yr) — positive.
- The deal already cash-flows at list — no discount required.
- Meets the 1% rule at list price ($1k rent vs $85k).
- Recommended offer: $84k (1.5% below list) — sets the bar for market timing.
- Cap rate 11.2% vs local median 3.6% in Monticello — top-decile yield for the area; either an underpriced asset or a hidden risk that comps aren't pricing in. Stress-test before assuming the spread holds.
Location & tenants
- Location reads 65/100 on livability (#265 in KY) — a middle-class / working-renter tenant base. Strengths: crime A+, cost of living A+, housing A+; Watch: amenities F, commute F, employment F.
- Wayne County (town): math 20% / reading 33% proficiency, ranked #142 of 165 in KY (top 86%) — low school quality limits family demand, transient renter base, plan for 1-2y turnover.
- Zoned schools: Monticello Elementary School (math 21% / reading 28%, grade F, #489 of 676 statewide, top 76%, 630 students, 79% FRL); Wayne County Middle School (math 18% / reading 36%, grade F, #172 of 217 statewide, top 80%, 679 students, 75% FRL); Wayne County High School (math 24% / reading 40%, grade F, #97 of 254 statewide, top 46%, 940 students, 76% FRL) — zoned schools average 77% FRL vs 57% district-wide (19 pts higher); higher-poverty schools than district average — tighter screening recommended.
- Market conditions: 193 active listings in the ZIP.
Forward outlook
- Local home prices are declining (-3.0%/yr); year-one equity from $587 of loan paydown is wiped out by about $3k of value loss. Plan a longer hold.
- Wayne County population projected at -20% by 2050 — secular population decline; favor cash flow + early exit over multi-decade hold.
- At projected returns (-3.0% appreciation + 3.0% rent growth), your $24k cash investment doubles in ~7 years — after that, you're playing with house money.
Negotiation context
- It's been on market 20 days — a 2% lower offer ($84k) is reasonable based on typical stale-listing flexibility.
- 2 sale attempts since 4y ago with the ask held roughly flat each time — persistent listings suggest the price (not the market) is what's stuck; bring a comps-based counter.
- Current owner paid $64k; 33% above their basis — modest negotiation headroom, anchor on the comps not their cost.
Risks & watch-outs
- Climate carrying-cost: moderate wildfire risk — expect insurance premiums to compound above CPI over the hold.
Questions for the listing agent
- Is there a deadline driving the sale (1031 exchange, divorce, estate, relocation)? That informs how much negotiation room exists.
- Schools are F-rated, which usually means shorter tenancies and higher turnover. Who's the typical renter profile here, and what's been the actual vacancy rate?
- What's the average days-on-market for RENTAL listings here right now (not sales)? A rising rental-DOM trend means longer vacancies and softer asking-rent achievability than the comps imply.
- What's the recent tenant-quality profile in this submarket — average credit score on applications, eviction rate, late-payment / NSF rate, and stable-employment percentage? A property-management company in the area should have these aggregated.
- How much new for-sale + rental construction is in the pipeline within 1–3 miles? Heavy new supply typically softens prices + rents 12–24 months out; constrained supply supports both.
Investment metrics
- 1% rule
- 1.30% ✓
- Cap rate
- 11.22%
- Cash-on-cash
- 17.59%
- DSCR
- 1.78
- GRM
- 6.4
CMA / ARV
No comps found within radius.
Projected returns pro-forma
-3.0% appreciation · 3.0% rent growth · sell at horizon
- IRR
- 9.0%
- Equity multiple
- 1.35×
- Total profit
- $8,409
- Equity at exit
- $12,659
- IRR
- 18.2%
- Equity multiple
- 2.51×
- Total profit
- $35,800
- Equity at exit
- $7,341
Cash invested: $23,772 (down + closing). Projections, not guarantees.
Landlord ↔ Tenant lean methodology
- Overall (STATE)
- 83 Strongly Landlord-Friendly
- State Kentucky
- 83 Strongly Landlord-Friendly · R+16
- County
- — inherits STATE
- City
- — inherits STATE
ZIP-level market 42633
- Home prices YoY
- -11.3%
- Active inventory
- 193
- Price-to-rent
- 6.4×
Monthly cashflow live
- Estimated rent
- $1,100 medium interval (Pro) →
- Mortgage (P&I)
- −$445
- Tax from tax record
- −$40 /mo · $484/yr
- Insurance
- −$35
- HOA
- −$0
- Vacancy / Maint / Mgmt
- −$231
- Net cashflow
- $348
Break-even live
UW: 25.0% down · 7.5% · 30yr · 1.5% tax · 5.0% vac · 8.0% maint · 8.0% mgmt
Financing live
Cash to close
- Down payment
- $21,225
- Closing costs
- $2,547
- Reserves months
- —
- Total cash needed
- —
Loan-product check · same deal, 3 products live
Conventional
25% down · 7.5% · 30yr
- Down + closing
- —
- Monthly P&I
- —
- Monthly cashflow
- —
- DSCR
- —
- Eligible?
- —
Personal DTI + credit; lowest rate.
DSCR
20% down · 8.5% · 30yr
- Down + closing
- —
- Monthly P&I
- —
- Monthly cashflow
- —
- DSCR
- —
- Eligible?
- —
No personal income docs; deal must DSCR.
Hard money
10% down · 12.0% · 12mo
- Down + closing
- —
- Monthly P&I
- —
- Monthly cashflow
- —
- DSCR
- —
- Eligible?
- —
Short-term bridge; refi at stabilization.
Listing history 19 events
-
2026-06-18days on market $84,900 Active 20 DOM
-
2026-06-17days on market $84,900 Active 19 DOM
-
2026-06-16days on market $84,900 Active 18 DOM
-
2026-06-15days on market $84,900 Active 17 DOM
-
2026-06-13days on market $84,900 Active 15 DOM
-
2026-06-12statusdays on market $84,900 Active 14 DOM
-
2026-06-09days on market $84,900 Contingent 11 DOM
-
2026-06-08days on market $84,900 Contingent 10 DOM
-
2026-06-07days on market $84,900 Contingent 9 DOM
-
2026-06-05days on market $84,900 Contingent 7 DOM
-
2026-06-04days on market $84,900 Contingent 5 DOM
-
2026-06-03status $84,900 Contingent 4 DOM
-
2026-06-02days on market $84,900 Active 4 DOM
-
2026-06-01days on market $84,900 Active 3 DOM
-
2026-05-31days on market $84,900 Active 2 DOM
-
2026-05-29$84,900 Active
-
2022-04-11soldstatus $64,000 Closed 305-char remark
Show marketing remark (305 chars)
Great starter or weekend home. This 3 bed, 2 bath home sits on .36 acres and is ready for new owners. Located only a few miles from downtown and less than 15 minutes from Conley Bottom Resort on Lake Cumberland. Plenty of level room to park a boat, jet skis or camper. Call today to schedule a showing.
-
2022-03-15status Pending 305-char remark
Show marketing remark (305 chars)
Great starter or weekend home. This 3 bed, 2 bath home sits on .36 acres and is ready for new owners. Located only a few miles from downtown and less than 15 minutes from Conley Bottom Resort on Lake Cumberland. Plenty of level room to park a boat, jet skis or camper. Call today to schedule a showing.
-
2022-03-03$74,900 Active 305-char remark
Show marketing remark (305 chars)
Great starter or weekend home. This 3 bed, 2 bath home sits on .36 acres and is ready for new owners. Located only a few miles from downtown and less than 15 minutes from Conley Bottom Resort on Lake Cumberland. Plenty of level room to park a boat, jet skis or camper. Call today to schedule a showing.
ⓘ Source: listings_history table (triggers on properties + properties_extension) + one-shot
backfill from property_details.listing_events for pre-trigger history.
Tax reassessment forecast KY · Resets to sale price
- Current annual tax
- $484 · $40/mo
- Projected year-2 tax
- $730 · $61/mo
- Expected delta
- +$247/yr (+$21/mo · 51.0%)
ⓘ Screening estimate from a state-policy table — verify with the county assessor before closing.
Climate risk First Street
- Flood 1/10 Low FEMA zone X (unshaded) · 0% chance over 30 yrs
- Wildfire 5/10 Major
- Heat 4/10 Moderate 7 d/yr ≥101°F today · 20 d/yr by 30 yrs out
- Wind 3/10 Moderate 5% chance of damaging wind over 30 yrs
- Air quality 1/10 Low 0 unhealthy d/yr today · 0 by 30 yrs out
Nearby sold comps map
Loading sold comps map…
Walkable amenities ~0.75 mi
Loading nearby amenities…
Taxation est. · year 1
- Rental income
- $13,205
- − Mortgage interest
- −$4,756
- − Property taxes
- −$484
- − Insurance
- −$424
- − Repairs & maintenance
- −$1,056
- − Management
- −$1,056
- − Depreciation
- −$2,470
- Taxable income
- $2,958
- Est. tax owed @ 24.0%
- −$710
- After-tax cash flow
- $3,471/yr
For passive investors: Depreciation is non-cash, so a rental often shows a tax loss while cash-flowing — sheltering income. Rental losses are passive: they offset passive income freely, and up to $25,000/yr can offset ordinary (W-2) income if you actively participate and your MAGI is under $100k (phasing out to $0 by $150k); unused losses carry forward. On sale, claimed depreciation is recaptured at up to 25%, and gains may owe capital-gains tax (a 1031 exchange can defer both). Figures are a year-1 estimate at your 24.0% rate — not tax advice; consult a CPA.
Schools (NCES district)
- District
- Wayne County
- NCES district ID
- 2105790
- Math proficiency
- 20% ▼ -21.00%
- Reading proficiency
- 33% ▼ -21.00%
- Median HH income
- $30,391
- Composite
- 21.38/100
- National rank
- #8358
- State rank
- #142 of 165 in KY
Livability — Monticello
- Score
- 65/100
- State rank
- #265
- US rank
- #12963
Category grades
Schools grade is shown separately in the Schools card above.
Census & demographics
- Population (ZIP)
- 18,609
Population outlook (Wayne County) Hauer SSP2
- Today (2025)
- 19,477 people
- By 2030
- 18,776 · -3.6%
- By 2040
- 17,199 · -11.7%
- By 2050
- 15,602 · -19.9%
- By 2075
- 11,883 · -39.0%
- By 2100
- 8,300 · -57.4%
Race, ethnicity, and origin ACS 2023
- Neighborhood character
- Predominantly White (92%)
- Race & ethnicity
- White 92% Hispanic / Latino 5% Two or more races 3% Black 1%
- Common ancestry
- Slovak 1% Iranian 1% Scottish 1%
- Foreign-born
- 2% · Canada
- Languages at home
- 96% English-only · Spanish 3%
Political lean MEDSL · Wayne
- 2024 margin
- Solid R (+66.0) · D 16.5% · R 82.5%
- 2008→2024 swing
- -28.9pp toward R · 2008: -37.1pp · 2024: -66.0pp
- All cycles
- 2024: R+66.0 2020: R+62.0 2016: R+61.8 2012: R+47.6 2008: R+37.1
Not yet ingested
- Civics
- —
Market trends
- HPI YoY
- ▼ -29.14%
- Current HPI
- 227.5936
- Rent YoY
- —
- Metro
- —
- State GDP YoY
- ▲ 1.81%
- F500 in state
- 4
Industry mix (Fortune 500 HQ in KY)
| Industry | F500 HQs | Revenue |
|---|---|---|
| Healthcare | 1 | $118B |
|
||
| Food / Beverage | 1 | $7B |
|
||
Price history
+13.4% since first listed4 events — show timeline
- 2026-05-29 Listed $84,900 ImagineMLS
- 2022-04-11 Sold (MLS) $64,000 ImagineMLS
- 2022-03-15 Pending — ImagineMLS
- 2022-03-03 Listed $74,900 ImagineMLS
Property tax history
+13.7%/yrLatest (2025): $484 · +9.4% YoY. Source: county tax records.
Cash-flow waterfall
monthlySold comps — $/sqft
last 12 mo · ≤1 miLoading sold comps…