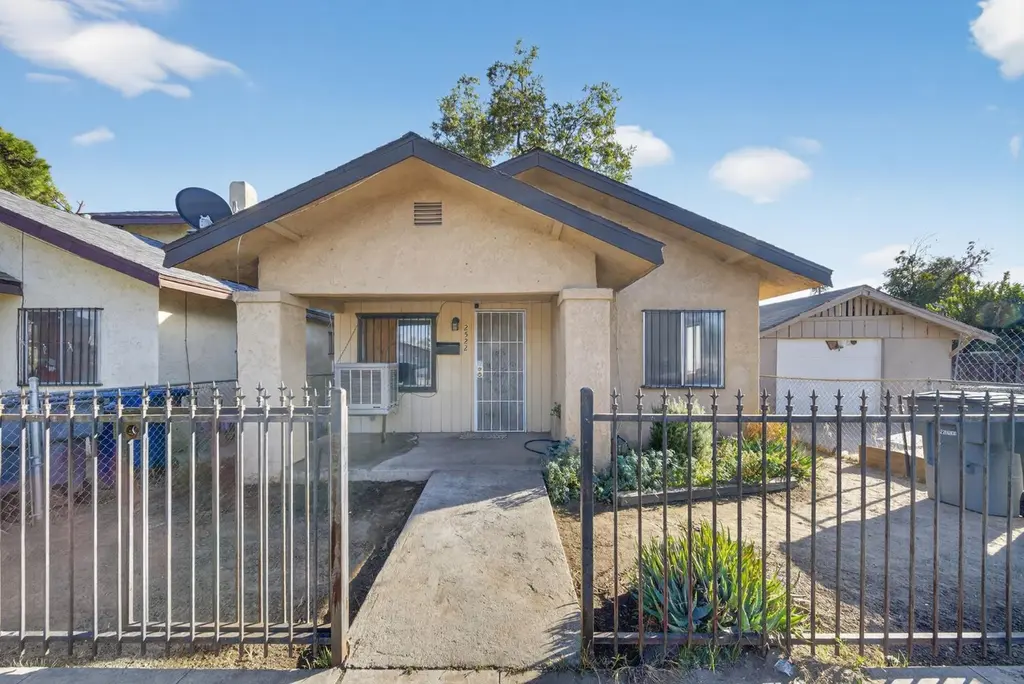
2522 E Grant Ave · Fresno, CA
Flood risk 1/10 · Minimal
- FEMA flood zone
- X (unshaded)
- Chance of flooding over 30 yrs
- 0.0%
- Est. flood insurance / yr
- $507 – $1,088
Fire risk 1/10 · Minimal
- Est. fire insurance / yr
- $659 – $1,223
Heat risk 8/10 · Major
- Hot days now (above 105°F)
- 7 days/yr
- Hot days in 30 yrs
- 17 days/yr
Wind risk 1/10 · Minimal
- Chance of severe wind over 30 yrs
- —
Air-quality risk 10/10 · Severe
- Unhealthy air days now
- 40 days/yr
- Unhealthy air days in 30 yrs
- 44 days/yr
Risk factors via First Street. Map © Google.
Why this score? — see what drove the D grade
The composite is a weighted blend of 9 inputs, each scored 0–100. Each bar is that input's sub-score; the figure is the points it added to the 100-point composite (weight × sub-score).
- ARV discount +10.9/15.0
- Appreciation +10.0/10.0
- Cash flow +7.4/30.0
- Livability +3.1/5.0
- Schools +2.7/10.0
- Rent growth +2.5/5.0
- Condition / age +2.5/5.0
- DSCR +1.6/10.0
- 1% rule +1.4/10.0
$209,000
🖨 Deal sheet 📄 Offer letter ✓ Due diligence
Listing remarks MLS
Don't Miss out on this fantastic opportunity in central Fresno! This two-story bungalow styled home features 3 bedrooms 1 bath, making it perfect for a first time home buyers or a small family looking to add their own personal touches. The home showcases tile, vinyl, and carpet flooring throughout, along with indoor laundry hook ups for added convenience. Located close to grocery stores and with easy freeway access, it combines comfort and practicality. Make this lovely Fresno home your own! Schedule your private showing today.
Key facts
- 3,750 sq ft lot
- Built 1920
- Listed 62 days
Neighborhood map
What this means for you Summary
Snapshot
- This is a 3-bed/1.0-bath single-family listed at $209k.
Deal economics
- At list price, monthly cash flow is $-267 ($-3k/yr) — negative.
- To cash-flow at today's rent, offer at most $162k (22.6% below list).
- To meet the 1% rule (rent ≥ 1% of price), the offer needs to be $133k (36.2% below list).
- Recommended offer: $133k (36.2% below list) — sets the bar for 1% rule.
- Cap rate 4.8% vs local median 3.7% in Fresno — meaningfully above typical; check what's discounted (condition, days-on-market, listing class) to confirm the premium yield is real.
Location & tenants
- Location reads 62/100 on livability (#469 in CA) — a middle-class / working-renter tenant base. Strengths: commute A+, housing A+; Watch: amenities D+, employment D+, schools D.
- Fresno Unified (urban): math 18% / reading 47% proficiency, ranked #327 of 517 in CA (top 63%) — families likely to look elsewhere, expect single-tenant / working-renter base with shorter leases; 77% free/reduced lunch — lower-income household profile, screen leases tightly.
- Market conditions: 41 active listings in the ZIP; 13 comparable units currently listed for rent nearby; rentals at typical pace (median 21d on market — plan ~3-4 weeks tenant-placement turnaround); lower-income renter base — watch delinquency; 2,426 units permitted in Fresno County in 2024 (296 in 5+ unit buildings).
- At $1,333/mo this rent would consume 49% of the median local household income ($33k/yr) (locally 1072% of renters already pay >50% of income on rent) — very limited rent-growth headroom before tenants either downsize or default.
Forward outlook
- In year one you build about $22k of equity ($1k loan paydown + $21k appreciation (10.0% local appreciation)).
- Fresno County population projected at +11% by 2050 — modest demand growth; plan on rents tracking national, not racing it.
- By year 2, paydown + projected appreciation supports a ~$36k cash-out refi (75% LTV) — recoverable capital for the next deal without selling this one.
Negotiation context
- It's been on market 62 days — a 6% lower offer ($196k) is reasonable based on typical stale-listing flexibility.
- 6 sale attempts since 21y ago with the ask held roughly flat each time — persistent listings suggest the price (not the market) is what's stuck; bring a comps-based counter.
- Current owner paid $115k; list at $209k implies a 82% gain — meaningful room to come down on a strong offer.
Risks & watch-outs
- Watch-outs: built in 1920 — expect roof / HVAC / electrical / plumbing capex.
- Climate carrying-cost: extreme-heat days projected 7→17/yr by 2055 (HVAC capex compounding) — expect insurance premiums to compound above CPI over the hold.
Questions for the listing agent
- What do current leases actually rent for vs. the listed asking? Can we see a recent rent roll and the last 12 months of T-12 income?
- It's been on market 62 days. Have you received any prior offers? Is the seller open to a 36% concession, seller financing, or rate buy-down credit?
- Built in 1920 — when were the roof, HVAC, electrical panel, plumbing, and water heater last replaced?
- Why hasn't it sold? Are there any deal-killer items the seller is aware of (foundation, flood, title, zoning, code violations)?
- Is there a deadline driving the sale (1031 exchange, divorce, estate, relocation)? That informs how much negotiation room exists.
- Schools are D-rated, which usually means shorter tenancies and higher turnover. Who's the typical renter profile here, and what's been the actual vacancy rate?
- Crime grade is F in this area — have there been break-ins, vandalism, or insurance claims at this property in the last 3 years? What carrier currently insures it and at what premium?
- The area grade is low — what's the realistic commute time and amenity access for the typical tenant pool here? Any planned neighborhood developments (good or bad) we should know about?
- What's the average days-on-market for RENTAL listings here right now (not sales)? A rising rental-DOM trend means longer vacancies and softer asking-rent achievability than the comps imply.
- What's the recent tenant-quality profile in this submarket — average credit score on applications, eviction rate, late-payment / NSF rate, and stable-employment percentage? A property-management company in the area should have these aggregated.
- How much new for-sale + rental construction is in the pipeline within 1–3 miles? Heavy new supply typically softens prices + rents 12–24 months out; constrained supply supports both.
Investment metrics
- 1% rule
- 0.64% ✗
- Cap rate
- 4.76%
- Cash-on-cash
- -5.47%
- DSCR
- 0.76
- GRM
- 13.1
CMA / ARV
- ARV (median comp)
- $226,243
- List price
- $209,000
- Delta
- -7.62%
- Verdict
- FAIR
- Comps
- 20 within 1.0 mi
Show comp detail 12 sales within ~0.75 mi
| Address | Dist | Beds/Ba | Sqft | Sold | Price | $/sf | Match |
|---|---|---|---|---|---|---|---|
| 2726 E Washington Ave | 0.14mi | 3/1.0 | 909 (-3%) | 6mo | $262,000 | $288 | 83 |
| 244 N U St | 0.19mi | 3/1.0 | 1,008 (+8%) | 6mo | $250,000 | $248 | 74 |
| 3006 E Mckenzie | 0.38mi | 2/1.0 (-1) | 938 (0%) | 6mo | $255,000 | $272 | 72 |
| 2524 E Grant Ave | 0.01mi | 2/1.0 (-1) | 821 (-12%) | 7mo | $193,000 | $235 | 68 |
| 2636 E Washington Ave | 0.11mi | 3/2.0 | 1,069 (+14%) | 4mo | $220,000 | $206 | 65 |
| 2743 E Hammond Ave | 0.73mi | 3/1.0 | 947 (+1%) | 2mo | $255,000 | $269 | 63 |
| 2743 E Hammond Ave | 0.73mi | 3/1.0 | 947 (+1%) | 2mo | $255,000 | $269 | 63 |
| 2215 E Clay Ave | 0.60mi | 2/1.0 (-1) | 903 (-4%) | 9mo | $250,000 | $277 | 53 |
| 2340 E Clay Ave | 0.54mi | 3/1.0 | 1,068 (+14%) | 4mo | $244,000 | $228 | 49 |
| 2427 E Tyler Ave | 0.50mi | 3/1.0 | 804 (-14%) | 5mo | $115,000 | $143 | 49 |
| 3348 E Mckenzie Ave | 0.72mi | 2/2.0 (-1) | 1,005 (+7%) | 2mo | $265,000 | $264 | 44 |
| 2259 E Clay Ave | 0.58mi | 3/1.0 | 807 (-14%) | 8mo | $240,000 | $297 | 43 |
Match score weights: distance 35% · size 25% · config 20% · recency 20%. Top-matched comps best support the ARV.
Projected returns pro-forma
10.0% appreciation · 3.0% rent growth · sell at horizon
- IRR
- 20.4%
- Equity multiple
- 2.65×
- Total profit
- $96,776
- Equity at exit
- $188,284
- IRR
- 18.6%
- Equity multiple
- 6.10×
- Total profit
- $298,241
- Equity at exit
- $406,041
Cash invested: $58,520 (down + closing). Projections, not guarantees.
Landlord ↔ Tenant lean methodology
- Overall (STATE)
- 18 Strongly Tenant-Friendly
- State California
- 18 Strongly Tenant-Friendly · D+13
- County
- — inherits STATE
- City
- — inherits STATE
ZIP-level market 93701
- Home prices YoY
- 6.4%
- Active inventory
- 41
- Price-to-rent
- 13.1×
Monthly cashflow live
- Estimated rent
- $1,333 high interval (Pro) →
- Mortgage (P&I)
- −$1,096
- Tax from tax record
- −$137 /mo · $1,644/yr
- Insurance
- −$87
- HOA
- −$0
- Vacancy / Maint / Mgmt
- −$280
- Net cashflow
- $-267
Break-even live
UW: 25.0% down · 7.5% · 30yr · 1.5% tax · 5.0% vac · 8.0% maint · 8.0% mgmt
Financing live
Cash to close
- Down payment
- $52,250
- Closing costs
- $6,270
- Reserves months
- —
- Total cash needed
- —
Loan-product check · same deal, 3 products live
Conventional
25% down · 7.5% · 30yr
- Down + closing
- —
- Monthly P&I
- —
- Monthly cashflow
- —
- DSCR
- —
- Eligible?
- —
Personal DTI + credit; lowest rate.
DSCR
20% down · 8.5% · 30yr
- Down + closing
- —
- Monthly P&I
- —
- Monthly cashflow
- —
- DSCR
- —
- Eligible?
- —
No personal income docs; deal must DSCR.
Hard money
10% down · 12.0% · 12mo
- Down + closing
- —
- Monthly P&I
- —
- Monthly cashflow
- —
- DSCR
- —
- Eligible?
- —
Short-term bridge; refi at stabilization.
Rent comps 13 comps
| Address | Beds | Baths | Sqft | Rent | $/sqft | DOM | Units | Dist |
|---|---|---|---|---|---|---|---|---|
| 2056 E White Ave Apt B Fresno, CA | 2.0 | 1.0 | 1050 | $1,250 | $1.19 | 43d | 1 | 0.31mi |
| 453 N Orchard St Apt C Fresno, CA | 2.0 | 1.0 | 630 | $1,250 | $1.98 | 3d | 1 | 0.34mi |
| 2995 E Nevada Ave Apt D Fresno, CA | 2.0 | 1.0 | 850 | $1,150 | $1.35 | 43d | 1 | 0.39mi |
| 3033 E Platt Ave Fresno, CA | 2.0 | 1.0 | 975 | $1,016 | $1.04 | 1d | 1 | 0.62mi |
| 109 N Glenn Ave Fresno, CA | 2.0 | 1.5 | 1100 | $1,050 | $0.95 | 1d | 1 | 0.78mi |
| 3254 E Olive Ave Apt D Fresno, CA | 2.0 | 1.0 | 750 | $1,300 | $1.73 | 21d | 1 | 0.84mi |
| 938 N Van Ness Ave Fresno, CA | 2.0 | 1.0 | 628 | $1,575 | $2.51 | 16d | 1 | 1.05mi |
| 960 N Van Ness Ave Fresno, CA | 3.0 | 1.0 | 900 | $1,350 | $1.50 | 43d | 1 | 1.05mi |
| 1230 N College Ave Unit 1232 Fresno, CA | 2.0 | 1.0 | 950 | $1,500 | $1.58 | 11d | 1 | 1.12mi |
| 1759 Fulton St Fresno, CA | 2.0 | 1.0–2.5 | 882 | $1,900 | $2.15 | 1d | 1 | 1.12mi |
| 1532 N Calaveras St Fresno, CA | 2.0 | 2.0 | 848 | $1,800 | $2.12 | 21d | 1 | 1.18mi |
| 2103 N Angus St Unit 2139-C Fresno, CA | 2.0 | 1.0 | 875 | $1,300 | $1.49 | 43d | 1 | 1.41mi |
| 1619 N 6th St Unit **21 6th-880 Fresno, CA | 2.0 | 1.0 | 950 | $1,325 | $1.39 | 43d | 1 | 1.45mi |
Listing history 37 events
-
2026-06-18days on market $209,000 Active 62 DOM
-
2026-06-17days on market $209,000 Active 61 DOM
-
2026-06-16days on market $209,000 Active 60 DOM
-
2026-06-15days on market $209,000 Active 59 DOM
-
2026-06-13days on market $209,000 Active 57 DOM
-
2026-06-10days on market $209,000 Active 54 DOM
-
2026-06-09days on market $209,000 Active 53 DOM
-
2026-06-08days on market $209,000 Active 52 DOM
-
2026-06-07days on market $209,000 Active 51 DOM
-
2026-06-05days on market $209,000 Active 48 DOM
-
2026-06-03days on market $209,000 Active 47 DOM
-
2026-06-02days on market $209,000 Active 46 DOM
-
2026-06-01days on market $209,000 Active 45 DOM
-
2026-05-31days on market $209,000 Active 44 DOM
-
2026-04-17$209,000 Active 533-char remark
Show marketing remark (533 chars)
Don't Miss out on this fantastic opportunity in central Fresno! This two-story bungalow styled home features 3 bedrooms 1 bath, making it perfect for a first time home buyers or a small family looking to add their own personal touches. The home showcases tile, vinyl, and carpet flooring throughout, along with indoor laundry hook ups for added convenience. Located close to grocery stores and with easy freeway access, it combines comfort and practicality. Make this lovely Fresno home your own! Schedule your private showing today.
-
2019-08-19price $115,000 276-char remark
Show marketing remark (276 chars)
Your Investment Opportunity Awaits you! 3/1 rental property. Rent is $785 a month. Cash preferred, all offers including financing will be entertained.Brand new plank flooring just installed this month. Property has been well maintained, new water heater & updated kitchen!
-
2019-08-16soldstatus $115,000 Sold 276-char remark
Show marketing remark (276 chars)
Your Investment Opportunity Awaits you! 3/1 rental property. Rent is $785 a month. Cash preferred, all offers including financing will be entertained.Brand new plank flooring just installed this month. Property has been well maintained, new water heater & updated kitchen!
-
2019-08-16soldstatus $115,000
Show marketing remark (276 chars)
Your Investment Opportunity Awaits you! 3/1 rental property. Rent is $785 a month. Cash preferred, all offers including financing will be entertained.Brand new plank flooring just installed this month. Property has been well maintained, new water heater & updated kitchen!
-
2019-07-30status Pending 276-char remark
Show marketing remark (276 chars)
Your Investment Opportunity Awaits you! 3/1 rental property. Rent is $785 a month. Cash preferred, all offers including financing will be entertained.Brand new plank flooring just installed this month. Property has been well maintained, new water heater & updated kitchen!
-
2019-07-28price $119,500 276-char remark
Show marketing remark (276 chars)
Your Investment Opportunity Awaits you! 3/1 rental property. Rent is $785 a month. Cash preferred, all offers including financing will be entertained.Brand new plank flooring just installed this month. Property has been well maintained, new water heater & updated kitchen!
-
2019-04-24status Active 276-char remark
Show marketing remark (276 chars)
Your Investment Opportunity Awaits you! 3/1 rental property. Rent is $785 a month. Cash preferred, all offers including financing will be entertained.Brand new plank flooring just installed this month. Property has been well maintained, new water heater & updated kitchen!
-
2019-04-24price $119,500 276-char remark
Show marketing remark (276 chars)
Your Investment Opportunity Awaits you! 3/1 rental property. Rent is $785 a month. Cash preferred, all offers including financing will be entertained.Brand new plank flooring just installed this month. Property has been well maintained, new water heater & updated kitchen!
-
2019-04-09historical 276-char remark
Show marketing remark (276 chars)
Your Investment Opportunity Awaits you! 3/1 rental property. Rent is $785 a month. Cash preferred, all offers including financing will be entertained.Brand new plank flooring just installed this month. Property has been well maintained, new water heater & updated kitchen!
-
2018-11-21status Active 276-char remark
Show marketing remark (276 chars)
Your Investment Opportunity Awaits you! 3/1 rental property. Rent is $785 a month. Cash preferred, all offers including financing will be entertained.Brand new plank flooring just installed this month. Property has been well maintained, new water heater & updated kitchen!
-
2018-11-21historical 276-char remark
Show marketing remark (276 chars)
Your Investment Opportunity Awaits you! 3/1 rental property. Rent is $785 a month. Cash preferred, all offers including financing will be entertained.Brand new plank flooring just installed this month. Property has been well maintained, new water heater & updated kitchen!
-
2018-07-31$124,500 Active 276-char remark
Show marketing remark (276 chars)
Your Investment Opportunity Awaits you! 3/1 rental property. Rent is $785 a month. Cash preferred, all offers including financing will be entertained.Brand new plank flooring just installed this month. Property has been well maintained, new water heater & updated kitchen!
-
2018-04-12price $124,995
-
2007-08-03soldstatus $105,000
-
2007-06-22price $119,927
-
2007-06-22historical
-
2007-06-22$119,927
-
2006-01-06soldstatus $125,000
-
2005-12-09historical
-
2005-12-09price $145,000
-
2005-11-17$125,000
-
1983-08-01soldstatus $21,000
-
1981-02-13soldstatus $26,500
ⓘ Source: listings_history table (triggers on properties + properties_extension) + one-shot
backfill from property_details.listing_events for pre-trigger history.
Tax reassessment forecast CA · Resets to sale price
- Current annual tax
- $1,644 · $137/mo
- Projected year-2 tax
- $1,644 · $137/mo
- Expected delta
- $0/yr ($0/mo · 0.0%)
ⓘ Screening estimate from a state-policy table — verify with the county assessor before closing.
Climate risk First Street
- Flood 1/10 Low FEMA zone X (unshaded) · 0% chance over 30 yrs
- Wildfire 1/10 Low
- Heat 8/10 Severe 7 d/yr ≥105°F today · 17 d/yr by 30 yrs out
- Wind 1/10 Low
- Air quality 10/10 Extreme 40 unhealthy d/yr today · 44 by 30 yrs out
Nearby sold comps map
Loading sold comps map…
Walkable amenities ~0.75 mi
Loading nearby amenities…
Taxation est. · year 1
- Rental income
- $15,999
- − Mortgage interest
- −$11,707
- − Property taxes
- −$1,644
- − Insurance
- −$1,045
- − Repairs & maintenance
- −$1,280
- − Management
- −$1,280
- − Depreciation
- −$6,080
- Taxable loss
- −$7,037
- Est. tax savings @ 24.0%
- +$1,689
- After-tax cash flow
- $-1,513/yr
For passive investors: Depreciation is non-cash, so a rental often shows a tax loss while cash-flowing — sheltering income. Rental losses are passive: they offset passive income freely, and up to $25,000/yr can offset ordinary (W-2) income if you actively participate and your MAGI is under $100k (phasing out to $0 by $150k); unused losses carry forward. On sale, claimed depreciation is recaptured at up to 25%, and gains may owe capital-gains tax (a 1031 exchange can defer both). Figures are a year-1 estimate at your 24.0% rate — not tax advice; consult a CPA.
Schools (NCES district)
- District
- Fresno Unified
- NCES district ID
- 0614550
- Math proficiency
- 18% ▼ -12.00%
- Reading proficiency
- 47% ▲ 9.00%
- Median HH income
- $36,095
- Composite
- 26.83/100
- National rank
- #7111
- State rank
- #327 of 517 in CA
Livability — Fresno
- Score
- 62/100
- State rank
- #469
- US rank
- #15907
Category grades
Schools grade is shown separately in the Schools card above.
Census & demographics
- Census place
- Fresno, CA
- County
- Fresno County · 834,801 people
- City population
- 593,114
- Metro
- Fresno, CA
- Population (ZIP)
- 9,808
- Household income
- $32,768
- Rent vs Own
- Severe rent burden
- 1072.0
Population outlook (Fresno County) Hauer SSP2
- Today (2025)
- 1,042,971 people
- By 2030
- 1,072,198 · +2.8%
- By 2040
- 1,122,408 · +7.6%
- By 2050
- 1,157,251 · +11.0%
- By 2075
- 1,182,575 · +13.4%
- By 2100
- 1,105,899 · +6.0%
Race, ethnicity, and origin ACS 2023
- Neighborhood character
- Predominantly Hispanic (77%)
- Race & ethnicity
- Hispanic / Latino 77% Two or more races 23% White 10% Black 6% Asian 4% Native American 3%
- Hispanic origin (detail)
- Mexican 75%
- Common ancestry
- Scotch-Irish 1% Italian 1%
- Foreign-born
- 32% · Canada
- Languages at home
- 33% English-only · Spanish 61% Other Asian/Pacific 3%
Political lean MEDSL · Fresno
- 2024 margin
- Toss-up / Even · D 46.5% · R 50.9% · Other 2.6%
- 2008→2024 swing
- -6.5pp toward R · 2008: 2.1pp · 2024: -4.4pp
- All cycles
- 2024: R+4.4 2020: D+7.8 2016: D+3.9 2012: R+2.9 2008: D+2.1
Not yet ingested
- Civics
- —
Market trends
- HPI YoY
- ▲ 27.24%
- Current HPI
- 452.1844
- Rent YoY
- —
- Metro
- Fresno, CA
- State GDP YoY
- ▲ 3.21%
- F500 in state
- 116
Industry mix (Fortune 500 HQ in CA)
| Industry | F500 HQs | Revenue |
|---|---|---|
| Technology | 27 | $1,492B |
|
||
| Financial Services | 3 | $174B |
|
||
| Retail | 3 | $44B |
|
||
| Insurance | 3 | $26B |
|
||
| Media / Entertainment | 2 | $115B |
|
||
| Pharmaceuticals / Biotech | 2 | $62B |
|
||
Price history
+688.7% since first listed23 events — show timeline
- 2026-04-17 Listed $209,000 FRESNOMLS
- 2019-08-19 Price Changed $115,000 FRESNOMLS
- 2019-08-16 Sold (Public Records) $115,000 Public Records
- 2019-08-16 Sold (MLS) $115,000 FRESNOMLS
- 2019-07-30 Pending — FRESNOMLS
- 2019-07-28 Price Changed $119,500 FRESNOMLS
- 2019-04-24 Relisted — FRESNOMLS
- 2019-04-24 Price Changed $119,500 FRESNOMLS
- 2019-04-09 Delisted — FRESNOMLS
- 2018-11-21 Relisted — FRESNOMLS
- 2018-11-21 Delisted — FRESNOMLS
- 2018-07-31 Listed $124,500 FRESNOMLS
- 2018-04-12 Price Changed $124,995 FRESNOMLS
- 2007-08-03 Sold (MLS) $105,000 FRESNOMLS
- 2007-06-22 Listed $119,927 FRESNOMLS
- 2007-06-22 Delisted — FRESNOMLS
- 2007-06-22 Price Changed $119,927 FRESNOMLS
- 2006-01-06 Sold (MLS) $125,000 FRESNOMLS
- 2005-12-09 Price Changed $145,000 FRESNOMLS
- 2005-12-09 Delisted — FRESNOMLS
- 2005-11-17 Listed $125,000 FRESNOMLS
- 1983-08-01 Sold (Public Records) $21,000 Public Records
- 1981-02-13 Sold (Public Records) $26,500 Public Records
Property tax history
+11.7%/yrLatest (2025): $1,644 · +3.9% YoY. Source: county tax records.
Cash-flow waterfall
monthlySold comps — $/sqft
last 12 mo · ≤1 miLoading sold comps…