13548 S Playa Vista Blvd · Plainfield, IL
Flood risk 1/10 · Minimal
- FEMA flood zone
- X (unshaded)
- Chance of flooding over 30 yrs
- 0.0%
- Est. flood insurance / yr
- $507 – $1,088
Fire risk 1/10 · Minimal
- Est. fire insurance / yr
- $804 – $1,492
Heat risk 3/10 · Minor
- Hot days now (above 102°F)
- 7 days/yr
- Hot days in 30 yrs
- 15 days/yr
Wind risk 2/10 · Minimal
- Chance of severe wind over 30 yrs
- 1.0%
Air-quality risk 3/10 · Minor
- Unhealthy air days now
- 3 days/yr
- Unhealthy air days in 30 yrs
- 4 days/yr
Risk factors via First Street. Map © Google.
Why this score? — see what drove the D- grade
The composite is a weighted blend of 9 inputs, each scored 0–100. Each bar is that input's sub-score; the figure is the points it added to the 100-point composite (weight × sub-score).
- Cash flow +10.1/30.0
- ARV discount +9.7/15.0
- Condition / age +4.0/5.0
- Livability +3.4/5.0
- 1% rule +3.2/10.0
- Schools +3.1/10.0
- DSCR +2.9/10.0
- Rent growth +2.5/5.0
- Appreciation +0.0/10.0
$449,990
🖨 Deal sheet 📄 Offer letter ✓ Due diligence
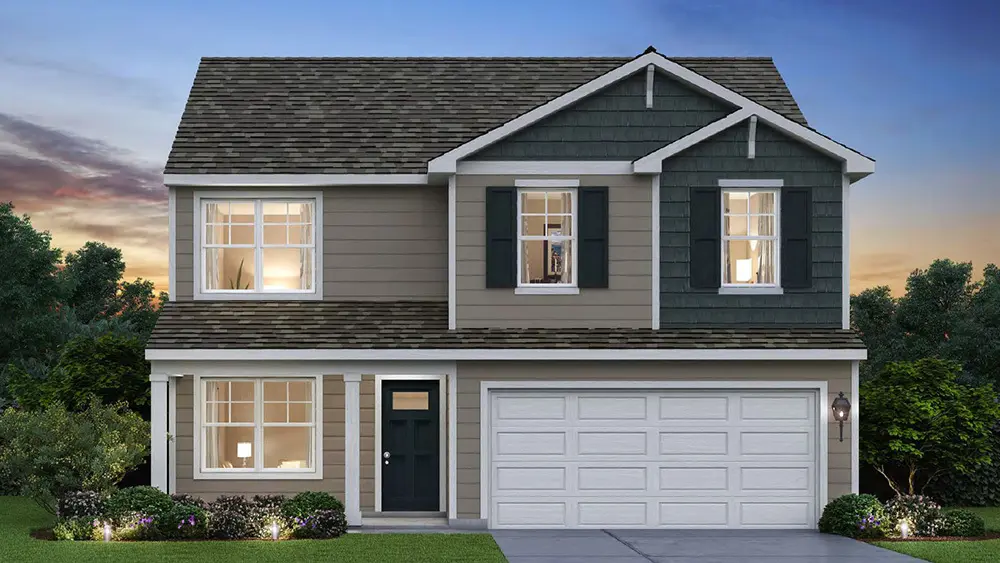
Listing remarks
Find yourself at 13548 S Playa Vista Blvd. in Plainfield, IL a beautiful new home in our Playa Vista community. This home will be ready for a fall move-in! This home comes with a front porch, beautiful exterior and a fully sodded yard. This Bellamy floor plan offers over 2,051 square feet of living space with a flex room, 4 bedrooms, 2.5 baths and a full basement. Enjoy this home's open concept great room and kitchen which gives you the perfect space for entertaining friends and family. Your kitchen features designer cabinetry with quartz countertops and pantry. Walking upstairs enjoy your private get away with your large primary bedroom on its own side of the second floor with a deluxe bat
Key facts
- Pantry
- Quartz countertops
- Fully sodded yard
Tags
Neighborhood map
What this means for you Summary
Snapshot
- This is a 4-bed/2.5-bath single-family listed at $450k. Condition is rated good.
Deal economics
- At list price, monthly cash flow is $-266 ($-3k/yr) — negative.
- To cash-flow at today's rent, offer at most $411k (8.6% below list).
- To meet the 1% rule (rent ≥ 1% of price), the offer needs to be $369k (17.9% below list).
- Recommended offer: $369k (17.9% below list) — sets the bar for 1% rule.
- Cap rate 5.6% vs local median 3.7% in Plainfield — top-decile yield for the area; either an underpriced asset or a hidden risk that comps aren't pricing in. Stress-test before assuming the spread holds.
Location & tenants
- Location reads 67/100 on livability (#496 in IL) — a middle-class / working-renter tenant base. Strengths: crime A+, employment A+, housing A+; Watch: amenities F, commute F, cost of living F.
- CUSD 308 (suburban): math 29% / reading 34% proficiency, ranked #179 of 620 in IL (top 29%) — families likely to look elsewhere, expect single-tenant / working-renter base with shorter leases; only 20% free/reduced lunch — higher-income household profile.
- Zoned schools: Grande Park Elem Sch (math 31% / reading 40%, grade F, #510 of 2,056 statewide, top 25%, 637 students, 0% FRL); Murphy Junior High School (math 30% / reading 43%, grade F, #178 of 665 statewide, top 27%, 713 students, 0% FRL); Oswego East High School (math 35% / reading 40%, grade F, #104 of 693 statewide, top 15%, 2,836 students, 0% FRL) — zoned schools average 0% FRL vs 20% district-wide (20 pts lower); this property's tenant base skews higher-income than the district average.
- Market conditions: 218 active listings in the ZIP; 4 comparable units currently listed for rent nearby; rentals leasing fast (median 2d on market — plan ~1-2 weeks tenant-placement turnaround); solid renter incomes; 706 units permitted in Kendall County in 2024 (263 in 5+ unit buildings).
- This rent runs 41% of the median local income ($108k/yr) — at the standard rent-burdened threshold; future hikes will face affordability resistance.
Forward outlook
- Local home prices are declining (-3.0%/yr); year-one equity from $3k of loan paydown is wiped out by about $14k of value loss. Plan a longer hold.
- Kendall County population projected at +20% by 2050 — long-run rental-demand tailwind backs the buy-and-hold thesis.
Negotiation context
- It's been on market 33 days — a 3% lower offer ($436k) is reasonable based on typical stale-listing flexibility.
- 3 sale attempts with the ask held roughly flat each time — persistent listings suggest the price (not the market) is what's stuck; bring a comps-based counter.
Questions for the listing agent
- What do current leases actually rent for vs. the listed asking? Can we see a recent rent roll and the last 12 months of T-12 income?
- It's been on market 33 days. Have you received any prior offers? Is the seller open to a 18% concession, seller financing, or rate buy-down credit?
- What does the HOA fee cover, when was the last increase, and are there any pending special assessments or reserve-fund shortfalls?
- Is there a deadline driving the sale (1031 exchange, divorce, estate, relocation)? That informs how much negotiation room exists.
- The area grade is low — what's the realistic commute time and amenity access for the typical tenant pool here? Any planned neighborhood developments (good or bad) we should know about?
- What's the average days-on-market for RENTAL listings here right now (not sales)? A rising rental-DOM trend means longer vacancies and softer asking-rent achievability than the comps imply.
- What's the recent tenant-quality profile in this submarket — average credit score on applications, eviction rate, late-payment / NSF rate, and stable-employment percentage? A property-management company in the area should have these aggregated.
- How much new for-sale + rental construction is in the pipeline within 1–3 miles? Heavy new supply typically softens prices + rents 12–24 months out; constrained supply supports both.
Investment metrics
- 1% rule
- 0.82% ✗
- Cap rate
- 5.58%
- Cash-on-cash
- -2.54%
- DSCR
- 0.89
- GRM
- 10.2
CMA / ARV
- ARV (median comp)
- $472,654
- List price
- $449,990
- Delta
- -4.80%
- Verdict
- FAIR
- Comps
- 20 within 1.0 mi
Show comp detail 12 sales within ~0.75 mi
| Address | Dist | Beds/Ba | Sqft | Sold | Price | $/sf | Match |
|---|---|---|---|---|---|---|---|
| 13504 S Coronado Cir | 0.06mi | 4/2.5 | 2,051 (0%) | 2mo | $459,990 | $224 | 96 |
| 13510 S Coronado Cir | 0.07mi | 4/2.5 | 2,051 (0%) | 3mo | $449,990 | $219 | 94 |
| 13648 S Palmetto Dr | 0.14mi | 4/2.5 | 2,051 (0%) | 0mo | $464,990 | $227 | 93 |
| 13704 S Palmetto Dr | 0.18mi | 4/2.5 | 2,051 (0%) | 4mo | $433,990 | $212 | 88 |
| 13720 S Palmetto Dr | 0.22mi | 4/2.5 | 2,051 (0%) | 4mo | $428,990 | $209 | 86 |
| 13712 S Palmetto Dr | 0.21mi | 4/2.5 | 2,051 (0%) | 5mo | $449,990 | $219 | 86 |
| 13711 S Palmetto Dr | 0.21mi | 4/2.5 | 2,051 (0%) | 4mo | $432,789 | $211 | 86 |
| 13744 S Palmetto Dr | 0.28mi | 4/2.5 | 2,051 (0%) | 3mo | $439,990 | $215 | 84 |
| 13743 S Palmetto Dr | 0.28mi | 4/2.5 | 2,051 (0%) | 8mo | $454,990 | $222 | 80 |
| 13653 S Palmetto Dr | 0.16mi | 3/2.5 (-1) | 1,818 (-11%) | 7mo | $419,990 | $231 | 62 |
| 13707 S Palmetto Dr | 0.21mi | 3/2.5 (-1) | 1,818 (-11%) | 6mo | $414,990 | $228 | 61 |
| 26918 Summergrove Dr | 0.58mi | 4/3.0 | 2,178 (+6%) | 2mo | $610,000 | $280 | 58 |
Match score weights: distance 35% · size 25% · config 20% · recency 20%. Top-matched comps best support the ARV.
Projected returns pro-forma
-3.0% appreciation · 3.0% rent growth · sell at horizon
- IRR
- -20.5%
- Equity multiple
- 0.29×
- Total profit
- $-89,774
- Equity at exit
- $67,095
- IRR
- -13.6%
- Equity multiple
- 0.21×
- Total profit
- $-99,595
- Equity at exit
- $38,907
Cash invested: $125,997 (down + closing). Projections, not guarantees.
Landlord ↔ Tenant lean methodology
- Overall (STATE)
- 43 Moderately Tenant-Leaning
- State Illinois
- 43 Moderately Tenant-Leaning · D+7
- County
- — inherits STATE
- City
- — inherits STATE
ZIP-level market 60544
- Home prices YoY
- -30.8%
- Active inventory
- 218
- Price-to-rent
- 10.2×
Monthly cashflow live
- Estimated rent
- $3,694 medium interval (Pro) →
- Mortgage (P&I)
- −$2,360
- Tax est. 1.5%
- −$562 /mo · $6,750/yr
- Insurance
- −$187
- HOA
- −$75
- Vacancy / Maint / Mgmt
- −$776
- Net cashflow
- $-266
Break-even live
UW: 25.0% down · 7.5% · 30yr · 1.5% tax · 5.0% vac · 8.0% maint · 8.0% mgmt
Financing live
Cash to close
- Down payment
- $112,498
- Closing costs
- $13,500
- Reserves months
- —
- Total cash needed
- —
Loan-product check · same deal, 3 products live
Conventional
25% down · 7.5% · 30yr
- Down + closing
- —
- Monthly P&I
- —
- Monthly cashflow
- —
- DSCR
- —
- Eligible?
- —
Personal DTI + credit; lowest rate.
DSCR
20% down · 8.5% · 30yr
- Down + closing
- —
- Monthly P&I
- —
- Monthly cashflow
- —
- DSCR
- —
- Eligible?
- —
No personal income docs; deal must DSCR.
Hard money
10% down · 12.0% · 12mo
- Down + closing
- —
- Monthly P&I
- —
- Monthly cashflow
- —
- DSCR
- —
- Eligible?
- —
Short-term bridge; refi at stabilization.
Rent comps 4 comps
| Address | Beds | Baths | Sqft | Rent | $/sqft | DOM | Units | Dist |
|---|---|---|---|---|---|---|---|---|
| 13713 S Sanibel St Plainfield, IL | 4.0 | 2.5 | 2600 | $4,000 | $1.54 | 1d | 1 | 0.27mi |
| 12919 White Pine Way Plainfield, IL | 3.0 | 2.5 | 1850 | $3,100 | $1.68 | 20d | 1 | 0.87mi |
| 12724 Wild Rye Ct Unit D Plainfield, IL | 3.0 | 3.5 | 1945 | $3,300 | $1.70 | 1d | 1 | 1.17mi |
| 12724 Wild Rye Ct Unit D Plainfield, IL | 3.0 | 3.5 | 1945 | $3,300 | $1.70 | 1d | 1 | 1.17mi |
HOA detail
- Monthly dues
- $75 · $900/yr
Listing history 22 events
-
2026-06-17statusdays on market $449,990 Pending 33 DOM
-
2026-06-17days on market $449,990 Active 54 DOM
-
2026-06-16days on market $449,990 Active 53 DOM
-
2026-06-15days on market $449,990 Active 52 DOM
-
2026-06-13days on market $449,990 Active 50 DOM
-
2026-06-09days on market $449,990 Active 26 DOM
-
2026-06-08days on market $449,990 Active 25 DOM
-
2026-06-07days on market $449,990 Active 24 DOM
-
2026-06-04days on market $449,990 Active 21 DOM
-
2026-06-03days on market $449,990 Active 20 DOM
-
2026-06-02days on market $449,990 Active 19 DOM
-
2026-06-01days on market $449,990 Active 18 DOM
-
2026-05-31days on market $449,990 Active 17 DOM
-
2026-05-14$449,990 Active 1401-char remark
-
2026-05-14historical
-
2026-05-06price
-
2026-05-03Active
-
2026-05-03historical
-
2026-04-23price
-
2026-03-27price
-
2026-03-05price
-
2026-02-27Active
ⓘ Source: listings_history table (triggers on properties + properties_extension) + one-shot
backfill from property_details.listing_events for pre-trigger history.
Climate risk First Street
- Flood 1/10 Low FEMA zone X (unshaded) · 0% chance over 30 yrs
- Wildfire 1/10 Low
- Heat 3/10 Moderate 7 d/yr ≥102°F today · 15 d/yr by 30 yrs out
- Wind 2/10 Low 100% chance of damaging wind over 30 yrs
- Air quality 3/10 Moderate 3 unhealthy d/yr today · 4 by 30 yrs out
Nearby sold comps map
Loading sold comps map…
Walkable amenities ~0.75 mi
Loading nearby amenities…
Taxation est. · year 1
- Rental income
- $44,332
- − Mortgage interest
- −$25,206
- − Property taxes
- −$6,750
- − Insurance
- −$2,250
- − Repairs & maintenance
- −$3,547
- − Management
- −$3,547
- − HOA
- −$900
- − Depreciation
- −$13,091
- Taxable loss
- −$10,958
- Est. tax savings @ 24.0%
- +$2,630
- After-tax cash flow
- $-565/yr
For passive investors: Depreciation is non-cash, so a rental often shows a tax loss while cash-flowing — sheltering income. Rental losses are passive: they offset passive income freely, and up to $25,000/yr can offset ordinary (W-2) income if you actively participate and your MAGI is under $100k (phasing out to $0 by $150k); unused losses carry forward. On sale, claimed depreciation is recaptured at up to 25%, and gains may owe capital-gains tax (a 1031 exchange can defer both). Figures are a year-1 estimate at your 24.0% rate — not tax advice; consult a CPA.
Condition & rehab AI · 6 photos
This home is in excellent condition with a good condition score of 80. It is move-in ready with a cosmetic rehab level, and the highest-ROI updates would be painting the exterior and interior walls, landscaping improvements, updating the flooring in the bathrooms, and upgrading the kitchen backsplash.
Value-add opportunities
- Both Painting the exterior and interior walls — Fresh paint can enhance curb appeal and interior aesthetics.
- Both Landscaping improvements — Enhanced landscaping can improve curb appeal and attract more potential buyers/tenants.
- Resale Updating the flooring in the bathrooms — Modern flooring can improve the overall look and feel of the bathrooms.
- Resale Upgrading the kitchen backsplash — A new backsplash can add a fresh look and increase the value of the kitchen.
Renovation cost estimate screening
Value-add ROI direction
- Both Painting the exterior and interior walls — Fresh paint can enhance curb appeal and interior aesthetics. ↑
- Both Landscaping improvements — Enhanced landscaping can improve curb appeal and attract more potential buyers/tenants. ↑
- Resale Updating the flooring in the bathrooms — Modern flooring can improve the overall look and feel of the bathrooms. ↑
- Resale Upgrading the kitchen backsplash — A new backsplash can add a fresh look and increase the value of the kitchen. ↑
ⓘ Cost ranges are severity-bucket heuristics (US national rule-of-thumb). Get contractor quotes + a written scope before underwriting a rehab budget.
Schools (NCES district)
- District
- CUSD 308
- NCES district ID
- 1730270
- Math proficiency
- 29% ▼ -10.00%
- Reading proficiency
- 34% ▼ -9.00%
- Median HH income
- $89,945
- Composite
- 31.25/100
- National rank
- #6028
- State rank
- #179 of 620 in IL
Livability — Plainfield
- Score
- 67/100
- State rank
- #496
- US rank
- #10260
Category grades
Schools grade is shown separately in the Schools card above.
Census & demographics
- Census place
- Plainfield, IL
- County
- Will County · 412,448 people
- City population
- 75,140
- Metro
- Chicago-Naperville-Elgin, IL-IN-WI
- Population (ZIP)
- 27,306
- Household income
- $108,304
- Rent vs Own
- Severe rent burden
- 418.0
Population outlook (Kendall County) Hauer SSP2
- Today (2025)
- 138,283 people
- By 2030
- 144,935 · +4.8%
- By 2040
- 156,944 · +13.5%
- By 2050
- 165,424 · +19.6%
- By 2075
- 174,715 · +26.3%
- By 2100
- 168,523 · +21.9%
Race, ethnicity, and origin ACS 2023
- Neighborhood character
- Predominantly White (70%)
- Race & ethnicity
- White 70% Hispanic / Latino 13% Two or more races 10% Black 9% Asian 4%
- Hispanic origin (detail)
- Mexican 8% Puerto Rican 2%
- Common ancestry
- Romanian 14% Subsaharan African 2% Slovak 2%
- Foreign-born
- 12% · Canada
- Languages at home
- 83% English-only · Spanish 8% Other Indo-European 3% Russian/Polish/Slavic 2%
Political lean MEDSL · Kendall
- 2024 margin
- Toss-up / Even · D 50.0% · R 48.5% · Other 1.6%
- 2008→2024 swing
- -5.7pp toward R · 2008: 7.2pp · 2024: 1.5pp
- All cycles
- 2024: D+1.5 2020: D+5.7 2016: R+1.5 2012: R+4.1 2008: D+7.2
Not yet ingested
- Civics
- —
Market trends
- HPI YoY
- ▼ -85.39%
- Current HPI
- 191.7581
- Rent YoY
- —
- Metro
- Chicago-Naperville-Elgin, IL-IN-WI
- State GDP YoY
- ▲ 1.59%
- F500 in state
- 60
Industry mix (Fortune 500 HQ in IL)
| Industry | F500 HQs | Revenue |
|---|---|---|
| Insurance | 4 | $201B |
|
||
| Consumer Goods | 4 | $87B |
|
||
| Industrial Machinery | 3 | $64B |
|
||
| Healthcare | 2 | $55B |
|
||
| Retail / Pharmacy | 1 | $148B |
|
||
| Agriculture / Food | 1 | $86B |
|
||
Price history
10 events — show timeline
- 2026-06-16 Pending — MRED as Distributed by MLS Grid
- 2026-05-14 Listing Removed — MRED as Distributed by MLS Grid
- 2026-05-14 Listed $449,990 MRED as Distributed by MLS Grid
- 2026-05-06 Price Changed — MRED as Distributed by MLS Grid
- 2026-05-03 Listing Removed — MRED as Distributed by MLS Grid
- 2026-05-03 Listed — MRED as Distributed by MLS Grid
- 2026-04-23 Price Changed — MRED as Distributed by MLS Grid
- 2026-03-27 Price Changed — MRED as Distributed by MLS Grid
- 2026-03-05 Price Changed — MRED as Distributed by MLS Grid
- 2026-02-27 Listed — MRED as Distributed by MLS Grid
Cash-flow waterfall
monthlySold comps — $/sqft
last 12 mo · ≤1 miLoading sold comps…