 🌊 Lakefront
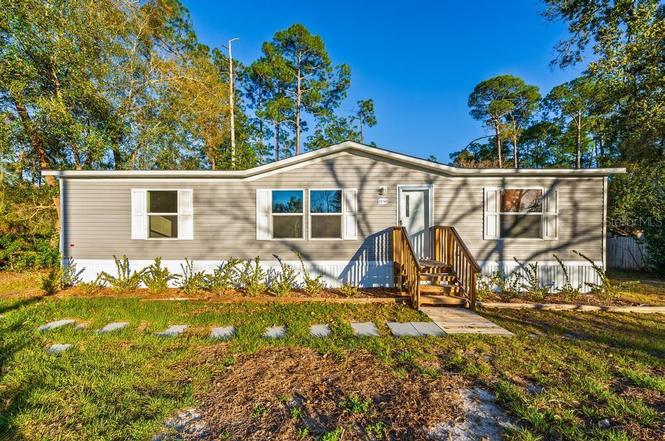
43740 Sunset Dr · Paisley, FL
Flood risk No data
- FEMA flood zone
- —
- Chance of flooding over 30 yrs
- —
- Est. flood insurance / yr
- —
Fire risk No data
- Est. fire insurance / yr
- —
Heat risk No data
- Hot days now (above threshold)
- —
- Hot days in 30 yrs
- —
Wind risk No data
- Chance of severe wind over 30 yrs
- —
Air-quality risk No data
- Unhealthy air days now
- —
- Unhealthy air days in 30 yrs
- —
Risk factors via First Street. Map © Google.
Why this score? — see what drove the D+ grade
The composite is a weighted blend of 9 inputs, each scored 0–100. Each bar is that input's sub-score; the figure is the points it added to the 100-point composite (weight × sub-score).
- ARV discount +15.0/15.0
- Appreciation +10.0/10.0
- Cash flow +6.7/30.0
- Schools +4.2/10.0
- Livability +3.4/5.0
- Rent growth +2.5/5.0
- Condition / age +2.5/5.0
- 1% rule +1.7/10.0
- DSCR +1.0/10.0
$245,000
🖨 Deal sheet (PDF) 📄 Offer letter ✓ Due diligence
Listing remarks
Under contract-accepting backup offers. NEW HOME WAITING FOR YOU! This New, Never-Been-Lived-In Mobile Home comes with a transferable Home Buyers Protection Plan that doesn't Expire until October 3, 2029! This residence is in a nice neighborhood with adjacent properties showing Pride in Ownership. Enjoy the privacy in your backyard or clear to the water’s edge for a more open feel. Either way, always maintain that space between your neighbors that you desire! 3 Bedroom / 2 Bath, Split-Plan with High Ceilings in Main Living Space. Home has a nice open feel and is bright and welcoming! Roomy Kitchen has Center Island w/ power for extra workspace or coffee bar! Plenty of counters &
Key facts
- Large walk-in closet
- Indoor laundry room
- Center island
Tags
Property features AI
Finance
- Other: Lot approx. 0.35 acres (110 x 140); Pond frontage approximately 110 feet; Asphalt road access; One well and one septic on property
- HOA & community: No association; Pets allowed
Exterior
- Parking: Driveway
- Utilities: Well water; Septic tank; Broadband/High-speed internet available; Electricity connected
- Home design: Manufactured double-wide home; One level; New construction; Faces northwest
- Construction: Vinyl siding and frame construction; Shingle roof; Crawlspace foundation with pillar/post/pier; Completed condition
- Exterior features: Private mailbox; Sliding doors; Pond frontage with water view and access
Interior
- Kitchen: Dishwasher; Range; Refrigerator; Electric water heater
- Bedrooms: 3 bedrooms
- Flooring: Laminate flooring
- Bathrooms: 2 full bathrooms
- Heating & cooling: Central heating; Central air conditioning
- Interior features: Ceiling fans; High ceilings; Open floorplan; Split bedroom layout; Thermostat; Walk-in closets
- Laundry & utility: Laundry room with washer and electric dryer hookups; Inside laundry
Neighborhood map
What this means for you Summary
Snapshot
- This is a 3-bed/2.0-bath single-family listed at $245k.
Deal economics
- At list price, monthly cash flow is $-390 ($-5k/yr) — negative.
- To cash-flow at today's rent, offer at most $189k (23.0% below list).
- To meet the 1% rule (rent ≥ 1% of price), the offer needs to be $165k (32.7% below list).
- Recommended offer: $165k (32.7% below list) — sets the bar for 1% rule.
Location & tenants
- Location reads 67/100 on livability (#563 in FL) — a middle-class / working-renter tenant base. Strengths: crime A+, cost of living A+, housing A+; Watch: employment C-, amenities F, commute F.
- Lake (suburban): math 49% / reading 50% proficiency, ranked #37 of 73 in FL (top 51%) — families likely to look elsewhere, expect single-tenant / working-renter base with shorter leases.
- Zoned schools: Spring Creek Charter School (math 45% / reading 44%, grade F, #1,288 of 2,144 statewide, top 62%, 630 students, 100% FRL, charter); Umatilla Middle School (math 58% / reading 46%, grade C+, #217 of 571 statewide, top 40%, 595 students, 57% FRL); Umatilla High School (math 24% / reading 29%, grade F, #489 of 667 statewide, top 74%, 861 students, 51% FRL) — zoned schools average 69% FRL vs 49% district-wide (20 pts higher); higher-poverty schools than district average — tighter screening recommended.
- Market conditions: 85 active listings in the ZIP; 1 comparable units currently listed for rent nearby; 4,799 units permitted in Lake County in 2024 (814 in 5+ unit buildings).
Forward outlook
- In year one you build about $26k of equity ($2k loan paydown + $24k appreciation (10.0% local appreciation)).
- Lake County population projected at +37% by 2050 — long-run rental-demand tailwind backs the buy-and-hold thesis.
- By year 2, paydown + projected appreciation supports a ~$42k cash-out refi (75% LTV) — recoverable capital for the next deal without selling this one.
Negotiation context
- It's been on market 85 days — a 6% lower offer ($230k) is reasonable based on typical stale-listing flexibility.
- 2 sale attempts with the ask held roughly flat each time — persistent listings suggest the price (not the market) is what's stuck; bring a comps-based counter.
Questions for the listing agent
- What do current leases actually rent for vs. the listed asking? Can we see a recent rent roll and the last 12 months of T-12 income?
- It's been on market 85 days. Have you received any prior offers? Is the seller open to a 33% concession, seller financing, or rate buy-down credit?
- Why hasn't it sold? Are there any deal-killer items the seller is aware of (foundation, flood, title, zoning, code violations)?
- Is there a deadline driving the sale (1031 exchange, divorce, estate, relocation)? That informs how much negotiation room exists.
- Schools are F-rated, which usually means shorter tenancies and higher turnover. Who's the typical renter profile here, and what's been the actual vacancy rate?
- The area grade is low — what's the realistic commute time and amenity access for the typical tenant pool here? Any planned neighborhood developments (good or bad) we should know about?
- This sits on a lake — are riparian / water-frontage rights deeded with the parcel? Any dock permits, shoreline easements, or HOA water-use restrictions?
- What's the documented flood / surge / shoreline-erosion history here (FEMA AND non-FEMA — e.g., storm surge, creek backup, septic-field saturation)?
- Any water-quality or seasonal algae-bloom issues that affect tenant satisfaction or short-term-rental demand?
- What's the average days-on-market for RENTAL listings here right now (not sales)? A rising rental-DOM trend means longer vacancies and softer asking-rent achievability than the comps imply.
- What's the recent tenant-quality profile in this submarket — average credit score on applications, eviction rate, late-payment / NSF rate, and stable-employment percentage? A property-management company in the area should have these aggregated.
- How much new for-sale + rental construction is in the pipeline within 1–3 miles? Heavy new supply typically softens prices + rents 12–24 months out; constrained supply supports both.
Investment metrics
- 1% rule
- 0.67% ✗
- Cap rate
- 4.38%
- Cash-on-cash
- -6.82%
- DSCR
- 0.70
- GRM
- 12.4
CMA / ARV
- ARV (on-the-fly)
- $382,234
- Comps found
- 2
Show comp detail 2 sales within ~0.75 mi
| Address | Dist | Beds/Ba | Sqft | Sold | Price | $/sf | Match |
|---|---|---|---|---|---|---|---|
| 25305 Mardon Cir | 0.49mi | 2/2.0 (-1) | 1,337 (+6%) | 10mo | $299,900 | $224 | 54 |
| 43910 East Rd | 0.31mi | 2/1.0 (-1) | 1,128 (-11%) | 15mo | $160,000 | $142 | 46 |
Match score weights: distance 35% · size 25% · config 20% · recency 20%. Top-matched comps best support the ARV.
Projected returns pro-forma
10.0% appreciation · 3.0% rent growth · sell at horizon
- IRR
- 19.5%
- Equity multiple
- 2.58×
- Total profit
- $108,642
- Equity at exit
- $220,715
- IRR
- 17.9%
- Equity multiple
- 5.95×
- Total profit
- $339,498
- Equity at exit
- $475,981
Cash invested: $68,600 (down + closing). Projections, not guarantees.
Landlord ↔ Tenant lean methodology
- Overall (STATE)
- 87 Strongly Landlord-Friendly
- State Florida
- 87 Strongly Landlord-Friendly · R+3
- County
- — inherits STATE
- City
- — inherits STATE
ZIP-level market 32767
- Home prices YoY
- 3.0%
- Active inventory
- 85
- Price-to-rent
- 12.4×
Monthly cashflow live
- Estimated rent
- $1,650 medium interval (Pro) →
- Mortgage (P&I)
- −$1,285
- Tax est. 1.5%
- −$306 /mo · $3,675/yr
- Insurance
- −$102
- HOA
- −$0
- Vacancy / Maint / Mgmt
- −$346
- Net cashflow
- $-390
Break-even live
Sensitivity live
| Price | -10% $-220 | -5% $-305 | +0% $-390 | +5% $-474 | +10% $-559 |
|---|---|---|---|---|---|
| Rent | -10% $-520 | -5% $-455 | +0% $-390 | +5% $-324 | +10% $-259 |
| Rate | -1.0pp $-266 | -0.5pp $-327 | base $-390 | +0.5pp $-453 | +1.0pp $-518 |
UW: 25.0% down · 7.5% · 30yr · 1.5% tax · 5.0% vac · 8.0% maint · 8.0% mgmt
Financing live
Cash to close
- Down payment
- $61,250
- Closing costs
- $7,350
- Reserves months
- —
- Total cash needed
- —
Loan-product check · same deal, 3 products live
Conventional
25% down · 7.5% · 30yr
- Down + closing
- —
- Monthly P&I
- —
- Monthly cashflow
- —
- DSCR
- —
- Eligible?
- —
Personal DTI + credit; lowest rate.
DSCR
20% down · 8.5% · 30yr
- Down + closing
- —
- Monthly P&I
- —
- Monthly cashflow
- —
- DSCR
- —
- Eligible?
- —
No personal income docs; deal must DSCR.
Hard money
10% down · 12.0% · 12mo
- Down + closing
- —
- Monthly P&I
- —
- Monthly cashflow
- —
- DSCR
- —
- Eligible?
- —
Short-term bridge; refi at stabilization.
Rent comps 1 comps
| Address | Beds | Baths | Sqft | Rent | $/sqft | DOM | Units | Dist |
|---|---|---|---|---|---|---|---|---|
| 25946 Pine Ridge Rd Paisley, FL | 3.0 | 2.0 | 1760 | $1,650 | $0.94 | 6d | 1 | 0.34mi |
Listing history 11 events
-
2026-04-22price $245,000
-
2026-03-04$248,000 Active
-
2026-03-02historical
-
2025-12-05price $249,500
-
2025-10-06price $260,000
-
2025-09-22price $250,000
-
2025-09-09price $264,500
-
2025-06-25price $269,000
-
2025-06-11price $289,000
-
2025-05-14price $297,500
-
2025-04-12$299,000 Active
ⓘ Source: listings_history table (triggers on properties + properties_extension) + one-shot
backfill from property_details.listing_events for pre-trigger history.
Nearby sold comps map
Loading sold comps map…
Walkable amenities ~0.75 mi
Loading nearby amenities…
Taxation est. · year 1
- Rental income
- $19,800
- − Mortgage interest
- −$13,724
- − Property taxes
- −$3,675
- − Insurance
- −$1,225
- − Repairs & maintenance
- −$1,584
- − Management
- −$1,584
- − Depreciation
- −$7,127
- Taxable loss
- −$9,119
- Est. tax savings @ 24.0%
- +$2,189
- After-tax cash flow
- $-2,487/yr
For passive investors: Depreciation is non-cash, so a rental often shows a tax loss while cash-flowing — sheltering income. Rental losses are passive: they offset passive income freely, and up to $25,000/yr can offset ordinary (W-2) income if you actively participate and your MAGI is under $100k (phasing out to $0 by $150k); unused losses carry forward. On sale, claimed depreciation is recaptured at up to 25%, and gains may owe capital-gains tax (a 1031 exchange can defer both). Figures are a year-1 estimate at your 24.0% rate — not tax advice; consult a CPA.
Schools (NCES district)
- District
- Lake
- NCES district ID
- 1201050
- Math proficiency
- 49% ▼ -7.00%
- Reading proficiency
- 50% ▼ -4.00%
- Median HH income
- $46,632
- Composite
- 42.05/100
- National rank
- #3327
- State rank
- #37 of 73 in FL
Livability — Paisley
- Score
- 67/100
- State rank
- #563
- US rank
- #10787
Category grades
Schools grade is shown separately in the Schools card above.
Census & demographics
- Census place
- Paisley, FL
- Population (ZIP)
- 2,839
Population outlook (Lake County) Hauer SSP2
- Today (2025)
- 386,640 people
- By 2030
- 417,107 · +7.9%
- By 2040
- 476,676 · +23.3%
- By 2050
- 531,296 · +37.4%
- By 2075
- 648,303 · +67.7%
- By 2100
- 698,530 · +80.7%
Race, ethnicity, and origin ACS 2023
- Neighborhood character
- Predominantly White (96%)
- Race & ethnicity
- White 96% Hispanic / Latino 2% Two or more races 1%
- Common ancestry
- Italian 3% Russian 3% Lithuanian 1%
- Foreign-born
- 1%
- Languages at home
- 98% English-only · Spanish 2%
Political lean MEDSL · Lake
- 2024 margin
- Strong R (+24.7) · D 37.3% · R 62.0%
- 2008→2024 swing
- -11.2pp toward R · 2008: -13.5pp · 2024: -24.7pp
- All cycles
- 2024: R+24.7 2020: R+20.0 2016: R+23.1 2012: R+17.1 2008: R+13.5
Not yet ingested
- Civics
- —
Market trends
- HPI YoY
- ▲ 11.00%
- Current HPI
- 372.7
- Rent YoY
- —
- Metro
- —
- State GDP YoY
- ▲ 3.28%
- F500 in state
- 36
Industry mix (Fortune 500 HQ in FL)
| Industry | F500 HQs | Revenue |
|---|---|---|
| Industrial Technology | 2 | $29B |
|
||
| Insurance | 2 | $17B |
|
||
| Retail | 1 | $60B |
|
||
| Technology Distribution | 1 | $58B |
|
||
| Homebuilding | 1 | $35B |
|
||
| Technology Manufacturing | 1 | $35B |
|
||
Price history
-18.1% since first listed11 events — show timeline
- 2026-04-22 Price Changed $245,000 Stellar MLS as Distributed by MLS Grid
- 2026-03-04 Listed $248,000 Stellar MLS as Distributed by MLS Grid
- 2026-03-02 Listing Removed — Stellar MLS as Distributed by MLS Grid
- 2025-12-05 Price Changed $249,500 Stellar MLS as Distributed by MLS Grid
- 2025-10-06 Price Changed $260,000 Stellar MLS as Distributed by MLS Grid
- 2025-09-22 Price Changed $250,000 Stellar MLS as Distributed by MLS Grid
- 2025-09-09 Price Changed $264,500 Stellar MLS as Distributed by MLS Grid
- 2025-06-25 Price Changed $269,000 Stellar MLS as Distributed by MLS Grid
- 2025-06-11 Price Changed $289,000 Stellar MLS as Distributed by MLS Grid
- 2025-05-14 Price Changed $297,500 Stellar MLS as Distributed by MLS Grid
- 2025-04-12 Listed $299,000 Stellar MLS as Distributed by MLS Grid
Cash-flow waterfall
monthlySold comps — $/sqft
last 12 mo · ≤1 miLoading sold comps…