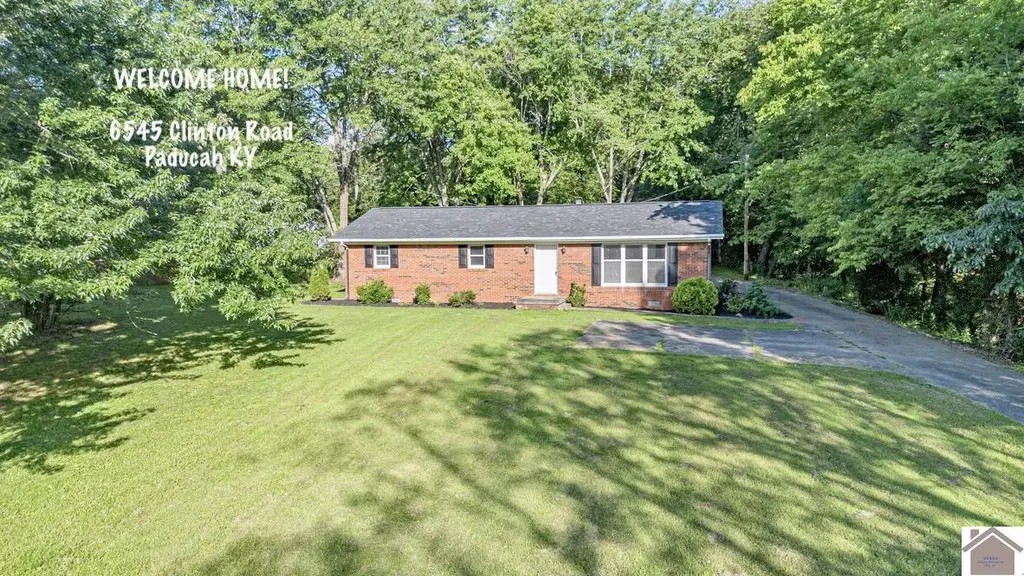
6545 Clinton Rd · Massac, KY
Flood risk 1/10 · Minimal
- FEMA flood zone
- X (unshaded)
- Chance of flooding over 30 yrs
- 0.0%
- Est. flood insurance / yr
- $507 – $1,088
Fire risk 4/10 · Minor
- Est. fire insurance / yr
- $839 – $1,559
Heat risk 5/10 · Moderate
- Hot days now (above 107°F)
- 7 days/yr
- Hot days in 30 yrs
- 20 days/yr
Wind risk 3/10 · Minor
- Chance of severe wind over 30 yrs
- 7.0%
Air-quality risk 2/10 · Minimal
- Unhealthy air days now
- 1 days/yr
- Unhealthy air days in 30 yrs
- 2 days/yr
Risk factors via First Street. Map © Google.
Why this score? — see what drove the D grade
The composite is a weighted blend of 9 inputs, each scored 0–100. Each bar is that input's sub-score; the figure is the points it added to the 100-point composite (weight × sub-score).
- Cash flow +13.7/30.0
- ARV discount +7.5/15.0
- DSCR +4.1/10.0
- Schools +4.0/10.0
- Livability +3.2/5.0
- 1% rule +3.0/10.0
- Rent growth +2.5/5.0
- Condition / age +2.5/5.0
- Appreciation +0.0/10.0
$185,000
🖨 Deal sheet (PDF) 📄 Offer letter ✓ Due diligence
Listing remarks MLS
Country chic 3 bedroom 1 bath ranch style house in quick proximity to Lone Oak and the mall area but with all the perks of country living! This house has the open floor plan with recently renovated bathroom, with a large kitchen, dining room and living space. The large 32’x24’ detached garage and spacious 16’x12’ shed both have electric run to them. The concrete driveway leads to a expansive backyard that is nice and private! The new vapor barrier, sump-pump, and insulation in the crawl space helps this house to be energy efficient and cost effective. The quiet simplicity of the area with the modern updates of the house make it the best of both worlds! Per listing agent clients offered over sale price. No multiple offers or seller prepaids.
Key facts
- New roofing
- Reglazed bathtub
- Large utility room
Tags
Property features AI
Exterior
- Parking: Detached 2-car garage
- Utilities: Public water; Septic tank
- Home design: Single-family residence; One story
- Construction: Frame construction; Shingle roof
- Exterior features: Patio; Outbuilding; Level lot
Interior
- Kitchen: Dishwasher, Refrigerator, Cooktop
- Bathrooms: 1 full bathroom
- Heating & cooling: Central air conditioning; Forced air heating
- Interior features: Dishwasher, Refrigerator, Cooktop, Electric water heater; Crawl space basement
- Laundry & utility: Electric water heater
Neighborhood map
What this means for you Summary
Snapshot
- This is a 3-bed/1.0-bath single-family listed at $185k.
Deal economics
- At list price, monthly cash flow is $14 ($168/yr) — positive.
- The deal already cash-flows at list — no discount required.
- To meet the 1% rule (rent ≥ 1% of price), the offer needs to be $149k (19.5% below list).
- Recommended offer: $149k (19.5% below list) — sets the bar for 1% rule.
- Cap rate 6.4% vs local median 4.0% in Massac — top-decile yield for the area; either an underpriced asset or a hidden risk that comps aren't pricing in. Stress-test before assuming the spread holds.
Location & tenants
- Location reads 63/100 on livability (#311 in KY) — a middle-class / working-renter tenant base. Strengths: crime A+, cost of living A+, housing A-; Watch: amenities F, commute F, health & safety F.
- Mccracken County (town): math 41% / reading 52% proficiency, ranked #16 of 165 in KY (top 10%) — families likely to look elsewhere, expect single-tenant / working-renter base with shorter leases.
- Zoned schools: Lone Oak Elementary School (math 52% / reading 52%, grade C-, #82 of 676 statewide, top 13%, 520 students, 58% FRL); Lone Oak Middle School (math 40% / reading 53%, grade D+, #28 of 217 statewide, top 13%, 796 students, 47% FRL); Mccracken County High School (math 30% / reading 44%, grade F, #58 of 254 statewide, top 27%, 1,999 students, 43% FRL).
- Market conditions: 248 active listings in the ZIP; 187 units permitted in McCracken County in 2024 (104 in 5+ unit buildings).
Forward outlook
- Local home prices are declining (-3.0%/yr); year-one equity from $1k of loan paydown is wiped out by about $6k of value loss. Plan a longer hold.
- McCracken County population projected to shrink 9% by 2050 — rents likely to lag national; underwrite the cash flow, not the appreciation.
Negotiation context
- Only 10 days on market — expect competitive offers; lowballing is unlikely to land.
- 2 sale attempts since 5y ago with the ask held roughly flat each time — persistent listings suggest the price (not the market) is what's stuck; bring a comps-based counter.
- Current owner paid $146k; 27% above their basis — modest negotiation headroom, anchor on the comps not their cost.
Risks & watch-outs
- Climate carrying-cost: extreme-heat days projected 7→20/yr by 2055 (HVAC capex compounding) — expect insurance premiums to compound above CPI over the hold.
Questions for the listing agent
- Built in 1974 — when were the roof, HVAC, electrical panel, plumbing, and water heater last replaced?
- Is there a deadline driving the sale (1031 exchange, divorce, estate, relocation)? That informs how much negotiation room exists.
- Schools are F-rated, which usually means shorter tenancies and higher turnover. Who's the typical renter profile here, and what's been the actual vacancy rate?
- The area grade is low — what's the realistic commute time and amenity access for the typical tenant pool here? Any planned neighborhood developments (good or bad) we should know about?
- What's the average days-on-market for RENTAL listings here right now (not sales)? A rising rental-DOM trend means longer vacancies and softer asking-rent achievability than the comps imply.
- What's the recent tenant-quality profile in this submarket — average credit score on applications, eviction rate, late-payment / NSF rate, and stable-employment percentage? A property-management company in the area should have these aggregated.
- How much new for-sale + rental construction is in the pipeline within 1–3 miles? Heavy new supply typically softens prices + rents 12–24 months out; constrained supply supports both.
Investment metrics
- 1% rule
- 0.80% ✗
- Cap rate
- 6.38%
- Cash-on-cash
- 0.32%
- DSCR
- 1.01
- GRM
- 10.4
CMA / ARV
No comps found within radius.
Projected returns pro-forma
-3.0% appreciation · 3.0% rent growth · sell at horizon
- IRR
- -15.8%
- Equity multiple
- 0.44×
- Total profit
- $-29,135
- Equity at exit
- $27,584
- IRR
- -7.5%
- Equity multiple
- 0.53×
- Total profit
- $-24,422
- Equity at exit
- $15,995
Cash invested: $51,800 (down + closing). Projections, not guarantees.
Landlord ↔ Tenant lean methodology
- Overall (STATE)
- 83 Strongly Landlord-Friendly
- State Kentucky
- 83 Strongly Landlord-Friendly · R+16
- County
- — inherits STATE
- City
- — inherits STATE
ZIP-level market 42001
- Home prices YoY
- -24.8%
- Active inventory
- 248
- Price-to-rent
- 10.4×
Monthly cashflow live
- Estimated rent
- $1,489 medium interval (Pro) →
- Mortgage (P&I)
- −$970
- Tax from tax record
- −$115 /mo · $1,376/yr
- Insurance
- −$77
- HOA
- −$0
- Vacancy / Maint / Mgmt
- −$313
- Net cashflow
- $14
Break-even live
Sensitivity live
| Price | -10% $119 | -5% $66 | +0% $14 | +5% $-38 | +10% $-91 |
|---|---|---|---|---|---|
| Rent | -10% $-104 | -5% $-45 | +0% $14 | +5% $73 | +10% $132 |
| Rate | -1.0pp $107 | -0.5pp $61 | base $14 | +0.5pp $-34 | +1.0pp $-83 |
UW: 25.0% down · 7.5% · 30yr · 1.5% tax · 5.0% vac · 8.0% maint · 8.0% mgmt
Financing live
Cash to close
- Down payment
- $46,250
- Closing costs
- $5,550
- Reserves months
- —
- Total cash needed
- —
Loan-product check · same deal, 3 products live
Conventional
25% down · 7.5% · 30yr
- Down + closing
- —
- Monthly P&I
- —
- Monthly cashflow
- —
- DSCR
- —
- Eligible?
- —
Personal DTI + credit; lowest rate.
DSCR
20% down · 8.5% · 30yr
- Down + closing
- —
- Monthly P&I
- —
- Monthly cashflow
- —
- DSCR
- —
- Eligible?
- —
No personal income docs; deal must DSCR.
Hard money
10% down · 12.0% · 12mo
- Down + closing
- —
- Monthly P&I
- —
- Monthly cashflow
- —
- DSCR
- —
- Eligible?
- —
Short-term bridge; refi at stabilization.
Listing history 9 events
-
2026-06-19days on market $185,000 Active 10 DOM
-
2026-06-18days on market $185,000 Active 9 DOM
-
2026-06-17days on market $185,000 Active 8 DOM
-
2026-06-16days on market $185,000 Active 7 DOM
-
2026-06-15days on market $185,000 Active 6 DOM
-
2026-06-14days on market $185,000 Active 4 DOM
-
2026-06-12days on market $185,000 Active 3 DOM
-
2026-06-09remarks 699-char remark
-
2026-06-09$185,000 Active 1 DOM
ⓘ Source: listings_history table (triggers on properties + properties_extension) + one-shot
backfill from property_details.listing_events for pre-trigger history.
Tax reassessment forecast KY · Resets to sale price
- Current annual tax
- $1,376 · $115/mo
- Projected year-2 tax
- $1,591 · $133/mo
- Expected delta
- +$215/yr (+$18/mo · 15.6%)
ⓘ Screening estimate from a state-policy table — verify with the county assessor before closing.
Climate risk First Street
- Flood 1/10 Low FEMA zone X (unshaded) · 0% chance over 30 yrs
- Wildfire 4/10 Moderate
- Heat 5/10 Major 7 d/yr ≥107°F today · 20 d/yr by 30 yrs out
- Wind 3/10 Moderate 7% chance of damaging wind over 30 yrs
- Air quality 2/10 Low 1 unhealthy d/yr today · 2 by 30 yrs out
Nearby sold comps map
Loading sold comps map…
Walkable amenities ~0.75 mi
Loading nearby amenities…
Taxation est. · year 1
- Rental income
- $17,863
- − Mortgage interest
- −$10,363
- − Property taxes
- −$1,376
- − Insurance
- −$925
- − Repairs & maintenance
- −$1,429
- − Management
- −$1,429
- − Depreciation
- −$5,382
- Taxable loss
- −$3,042
- Est. tax savings @ 24.0%
- +$730
- After-tax cash flow
- $898/yr
For passive investors: Depreciation is non-cash, so a rental often shows a tax loss while cash-flowing — sheltering income. Rental losses are passive: they offset passive income freely, and up to $25,000/yr can offset ordinary (W-2) income if you actively participate and your MAGI is under $100k (phasing out to $0 by $150k); unused losses carry forward. On sale, claimed depreciation is recaptured at up to 25%, and gains may owe capital-gains tax (a 1031 exchange can defer both). Figures are a year-1 estimate at your 24.0% rate — not tax advice; consult a CPA.
Schools (NCES district)
- District
- Mccracken County
- NCES district ID
- 2103960
- Math proficiency
- 41% ▼ -15.00%
- Reading proficiency
- 52% ▼ -15.00%
- Median HH income
- $49,976
- Composite
- 39.84/100
- National rank
- #3871
- State rank
- #16 of 165 in KY
Livability — Massac
- Score
- 63/100
- State rank
- #311
- US rank
- #14933
Category grades
Schools grade is shown separately in the Schools card above.
Census & demographics
- County
- McCracken County · 30,856 people
- City population
- 12
- Metro
- Paducah, KY-IL
- Population (ZIP)
- 30,856
- Household income
- $71,365
- Rent vs Own
- Severe rent burden
- 1001.0
Population outlook (McCracken County) Hauer SSP2
- Today (2025)
- 64,237 people
- By 2030
- 63,468 · -1.2%
- By 2040
- 61,221 · -4.7%
- By 2050
- 58,432 · -9.0%
- By 2075
- 52,668 · -18.0%
- By 2100
- 44,517 · -30.7%
Race, ethnicity, and origin ACS 2023
- Neighborhood character
- Predominantly White (78%)
- Race & ethnicity
- White 78% Black 13% Two or more races 6% Hispanic / Latino 2% Asian 1%
- Common ancestry
- Lithuanian 2% Italian 2% Serbian 2%
- Foreign-born
- 2% · Canada, China
- Languages at home
- 97% English-only · Spanish 1%
Political lean MEDSL · McCracken
- 2024 margin
- Solid R (+34.9) · D 31.9% · R 66.8% · Other 1.2%
- 2008→2024 swing
- -9.7pp toward R · 2008: -25.2pp · 2024: -34.9pp
- All cycles
- 2024: R+34.9 2020: R+31.7 2016: R+37.2 2012: R+32.5 2008: R+25.2
Not yet ingested
- Civics
- —
Market trends
- HPI YoY
- ▼ -85.23%
- Current HPI
- 258.1706
- Rent YoY
- —
- Metro
- Paducah, KY-IL
- State GDP YoY
- ▲ 1.81%
- F500 in state
- 4
Industry mix (Fortune 500 HQ in KY)
| Industry | F500 HQs | Revenue |
|---|---|---|
| Healthcare | 1 | $118B |
|
||
| Food / Beverage | 1 | $7B |
|
||
Price history
+146.7% since first listed6 events — show timeline
- 2026-06-09 Listed $185,000 WKRMLS
- 2021-07-01 Sold (Public Records) $146,000 Public Records
- 2021-06-11 Sold (MLS) $146,000 WKRMLS
- 2021-05-10 Listed $139,000 WKRMLS
- 2011-12-08 Sold (Public Records) $87,500 Public Records
- 1997-10-01 Sold (Public Records) $75,000 Public Records
Property tax history
+7.2%/yrLatest (2025): $1,376 · -1.8% YoY. Source: county tax records.
Cash-flow waterfall
monthlySold comps — $/sqft
last 12 mo · ≤1 miLoading sold comps…