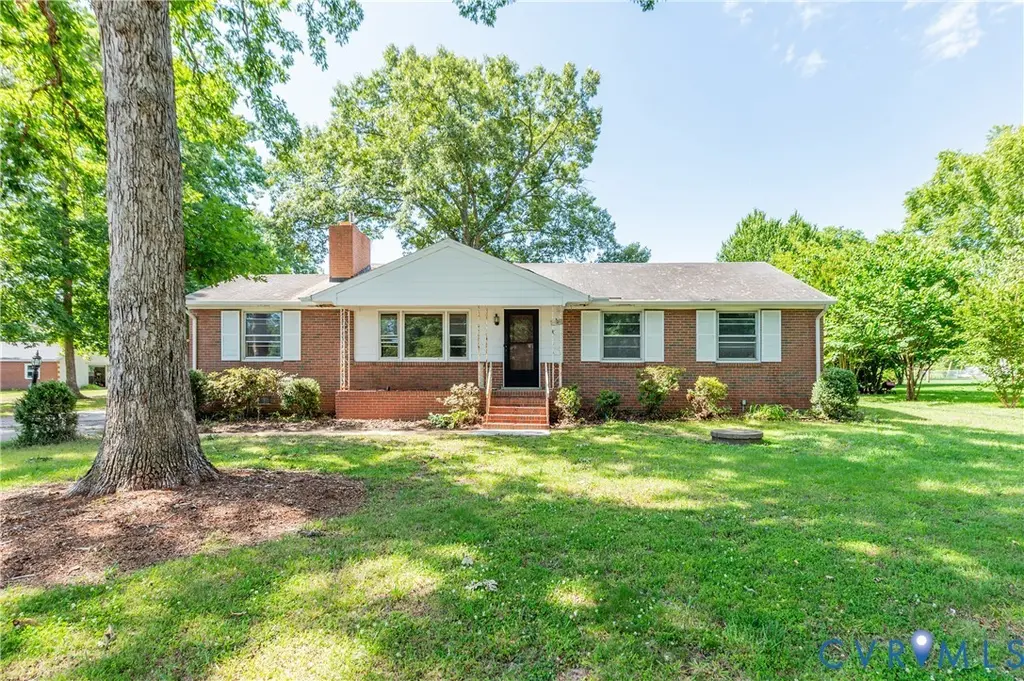
5307 W Rock Spring Dr · Meadowbrook, VA
Flood risk 1/10 · Minimal
- FEMA flood zone
- X (unshaded)
- Chance of flooding over 30 yrs
- 0.0%
- Est. flood insurance / yr
- $507 – $1,088
Fire risk 2/10 · Minimal
- Est. fire insurance / yr
- $666 – $1,236
Heat risk 7/10 · Major
- Hot days now (above 106°F)
- 7 days/yr
- Hot days in 30 yrs
- 16 days/yr
Wind risk 6/10 · Moderate
- Chance of severe wind over 30 yrs
- 27.0%
Air-quality risk 2/10 · Minimal
- Unhealthy air days now
- 0 days/yr
- Unhealthy air days in 30 yrs
- 1 days/yr
Risk factors via First Street. Map © Google.
Why this score? — see what drove the D+ grade
The composite is a weighted blend of 9 inputs, each scored 0–100. Each bar is that input's sub-score; the figure is the points it added to the 100-point composite (weight × sub-score).
- ARV discount +15.0/15.0
- Cash flow +10.6/30.0
- Schools +5.2/10.0
- Livability +3.7/5.0
- DSCR +3.0/10.0
- Rent growth +3.0/5.0
- 1% rule +2.6/10.0
- Condition / age +2.5/5.0
- Appreciation +0.0/10.0
$250,000
🖨 Deal sheet (PDF) 📄 Offer letter ✓ Due diligence
Listing remarks
Classic brick ranch charm and endless potential come together on this spacious North Chesterfield home. Set on a large, tree-lined lot, 5307 West Rock Spring Drive offers timeless character, hardwood floors throughout much of the home, and a detached two-car garage with plenty of additional parking. Inside, the bright living room features a classic brick fireplace with wood-burning stove insert and opens seamlessly to the kitchen. The kitchen retains its original knotty pine cabinetry and vintage charm, offering ample cabinet storage, generous counter space, and an adjacent dining area filled with natural light. Down the hall, three bedrooms feature hardwood floors, including a primary suit
Key facts
- Brick fireplace
- Expansive yard
- Mature trees
Tags
Property features AI
Finance
- Other: Zoning: R7; Lot size approximately 0.571 acres; Above-grade finished area listed in records
Exterior
- Parking: Detached 2-car garage with garage door opener, workshop and storage; Paved driveway
- Security: Smoke detector(s)
- Utilities: Public water; Public sewer; Electric power
- Home design: Single-story home; Resale condition; Shingle roof; Aluminum siding and brick exterior; Facing information not provided
- Construction: Built with aluminum siding and brick; Shingle roof; Crawl space foundation; Year-built details: actual year provided in records
- Exterior features: Porch and patio; Shed and additional storage; Paved driveway; Exterior workshop space; Garage(s) and detached storage
Interior
- Kitchen: Built-in oven; Cooktop; Range/Oven; Range hood; Electric cooking; Dishwasher; Refrigerator; Freezer; Exhaust fan; Kitchen island; Eat-in kitchen; Solid surface counters
- Bedrooms: Bedroom on main level; Main level primary
- Flooring: Wood flooring; Tile flooring
- Bathrooms: 1 full bathroom; 1 half bathroom
- Heating & cooling: Heat pump (heating and cooling); Electric heating; Wood stove; Attic fan
- Interior features: Built-in bookcases and other built-in features; Ceiling fans; Dining area and separate/formal dining room; Eat-in kitchen with island; High-speed internet and cable TV available; Wired for data; Main-level primary bedroom; Walk-in closet(s); Solid surface counters; Workshop space
- Laundry & utility: Washer; Dryer; Electric water heater
Neighborhood map
What this means for you Summary
Snapshot
- This is a 3-bed/1.5-bath single-family listed at $250k.
Deal economics
- At list price, monthly cash flow is $-125 ($-1k/yr) — negative.
- To cash-flow at today's rent, offer at most $228k (8.8% below list).
- To meet the 1% rule (rent ≥ 1% of price), the offer needs to be $190k (24.2% below list).
- Recommended offer: $190k (24.2% below list) — sets the bar for 1% rule.
- Cap rate 5.7% vs local median 3.9% in Meadowbrook — top-decile yield for the area; either an underpriced asset or a hidden risk that comps aren't pricing in. Stress-test before assuming the spread holds.
Location & tenants
- Location reads 73/100 on livability (#161 in VA) — a middle-class / working-renter tenant base. Strengths: housing A+, health & safety A+, cost of living A-; Watch: amenities F, commute F.
- Chesterfield County Public School District (suburban): math 52% / reading 64% proficiency, ranked #57 of 131 in VA (top 44%) — acceptable for families but not a draw, mixed tenant base, ~2y average lease.
- Zoned schools: J.G. Hening Elementary (math 48% / reading 62%, grade C, #643 of 1,108 statewide, top 59%, 819 students, 82% FRL); Falling Creek Middle (math 28% / reading 46%, grade F, #319 of 342 statewide, top 93%, 1,419 students, 80% FRL); Meadowbrook High (math 22% / reading 65%, grade F, #314 of 319 statewide, top 98%, 2,033 students, 79% FRL) — zoned schools average 80% FRL vs 26% district-wide (54 pts higher); higher-poverty schools than district average — tighter screening recommended.
- Zoned-school proficiency averages 45% at this address vs 58% district-wide (-13 pts) — the specific schools serving this property underperform the Chesterfield County Public School District average; the district grade overstates school quality for this exact location.
- Market conditions: Rents rising (+1.9%/yr); 234 active listings in the ZIP; 9 comparable units currently listed for rent nearby; rentals leasing fast (median 6d on market — plan ~1-2 weeks tenant-placement turnaround); 2,307 units permitted in Chesterfield County in 2024 (462 in 5+ unit buildings).
- This rent runs 34% of the median local income ($67k/yr) — at the standard rent-burdened threshold; future hikes will face affordability resistance.
Forward outlook
- Local home prices are declining (-3.0%/yr); year-one equity from $2k of loan paydown is wiped out by about $8k of value loss. Plan a longer hold.
- Chesterfield County population projected at +20% by 2050 — long-run rental-demand tailwind backs the buy-and-hold thesis.
Negotiation context
- Only 5 days on market — expect competitive offers; lowballing is unlikely to land.
- Current owner paid $120k; list at $250k implies a 108% gain — meaningful room to come down on a strong offer.
Risks & watch-outs
- Watch-outs: built in 1959 — expect roof / HVAC / electrical / plumbing capex.
- Climate carrying-cost: major wind risk, 27% chance of damaging wind over 30y; extreme-heat days projected 7→16/yr by 2055 (HVAC capex compounding) — expect insurance premiums to compound above CPI over the hold.
Questions for the listing agent
- What do current leases actually rent for vs. the listed asking? Can we see a recent rent roll and the last 12 months of T-12 income?
- Built in 1959 — when were the roof, HVAC, electrical panel, plumbing, and water heater last replaced?
- Is there a deadline driving the sale (1031 exchange, divorce, estate, relocation)? That informs how much negotiation room exists.
- Schools are B-rated — typically a magnet for longer-tenancy family renters. What's the average tenant stay here, and is there a school-zone premium baked into asking?
- The area grade is low — what's the realistic commute time and amenity access for the typical tenant pool here? Any planned neighborhood developments (good or bad) we should know about?
- What's the average days-on-market for RENTAL listings here right now (not sales)? A rising rental-DOM trend means longer vacancies and softer asking-rent achievability than the comps imply.
- What's the recent tenant-quality profile in this submarket — average credit score on applications, eviction rate, late-payment / NSF rate, and stable-employment percentage? A property-management company in the area should have these aggregated.
- How much new for-sale + rental construction is in the pipeline within 1–3 miles? Heavy new supply typically softens prices + rents 12–24 months out; constrained supply supports both.
Investment metrics
- 1% rule
- 0.76% ✗
- Cap rate
- 5.69%
- Cash-on-cash
- -2.14%
- DSCR
- 0.90
- GRM
- 11.0
CMA / ARV
- ARV (on-the-fly)
- $333,424
- Comps found
- 12
Show comp detail 12 sales within ~0.75 mi
| Address | Dist | Beds/Ba | Sqft | Sold | Price | $/sf | Match |
|---|---|---|---|---|---|---|---|
| 5520 Gilling Rd | 0.19mi | 3/2.0 | 1,456 (0%) | 6mo | $300,000 | $206 | 84 |
| 5213 W Rock Spring Dr | 0.07mi | 3/2.0 | 1,568 (+8%) | 6mo | $300,000 | $191 | 77 |
| 5648 Darlington Rd | 0.07mi | 3/1.0 | 1,591 (+9%) | 8mo | $280,000 | $176 | 73 |
| 5329 Meadoway Rd | 0.45mi | 3/2.0 | 1,484 (+2%) | 7mo | $330,000 | $222 | 68 |
| 5725 Jessup Station Ct | 0.57mi | 3/2.0 | 1,514 (+4%) | 0mo | $385,000 | $254 | 64 |
| 5625 Backwater Dr | 0.49mi | 3/2.5 | 1,407 (-3%) | 5mo | $340,000 | $242 | 64 |
| 6218 Howell Dr | 0.51mi | 3/2.0 | 1,396 (-4%) | 7mo | $352,000 | $252 | 62 |
| 5713 Lakemere Dr | 0.43mi | 2/2.0 (-1) | 1,508 (+4%) | 7mo | $345,000 | $229 | 61 |
| 5707 Lakemere Dr | 0.44mi | 2/2.0 (-1) | 1,512 (+4%) | 7mo | $340,000 | $225 | 60 |
| 4825 Stanley Dr | 0.60mi | 3/2.0 | 1,296 (-11%) | 6mo | $317,500 | $245 | 46 |
| 4846 Stanley Dr | 0.54mi | 3/1.0 | 1,254 (-14%) | 5mo | $287,000 | $229 | 45 |
| 4741 Arundel Ave | 0.63mi | 3/1.0 | 1,243 (-15%) | 3mo | $316,000 | $254 | 42 |
Match score weights: distance 35% · size 25% · config 20% · recency 20%. Top-matched comps best support the ARV.
Projected returns pro-forma
-3.0% appreciation · 1.93% rent growth · sell at horizon
- IRR
- -21.0%
- Equity multiple
- 0.28×
- Total profit
- $-50,505
- Equity at exit
- $37,276
- IRR
- -16.9%
- Equity multiple
- 0.11×
- Total profit
- $-62,459
- Equity at exit
- $21,615
Cash invested: $70,000 (down + closing). Projections, not guarantees.
Landlord ↔ Tenant lean methodology
- Overall (STATE)
- 55 Moderately Landlord-Leaning
- State Virginia
- 55 Moderately Landlord-Leaning · D+2
- County
- — inherits STATE
- City
- — inherits STATE
ZIP-level market 23234
- Rents YoY
- 1.9%
- Active inventory
- 234
- Price-to-rent
- 11.0×
Monthly cashflow live
- Estimated rent
- $1,896 high interval (Pro) →
- Mortgage (P&I)
- −$1,311
- Tax from tax record
- −$207 /mo · $2,488/yr
- Insurance
- −$104
- HOA
- −$0
- Vacancy / Maint / Mgmt
- −$398
- Net cashflow
- $-125
Break-even live
Sensitivity live
| Price | -10% $17 | -5% $-54 | +0% $-125 | +5% $-195 | +10% $-266 |
|---|---|---|---|---|---|
| Rent | -10% $-274 | -5% $-200 | +0% $-125 | +5% $-50 | +10% $25 |
| Rate | -1.0pp $1 | -0.5pp $-61 | base $-125 | +0.5pp $-189 | +1.0pp $-255 |
UW: 25.0% down · 7.5% · 30yr · 1.5% tax · 5.0% vac · 8.0% maint · 8.0% mgmt
Financing live
Cash to close
- Down payment
- $62,500
- Closing costs
- $7,500
- Reserves months
- —
- Total cash needed
- —
Loan-product check · same deal, 3 products live
Conventional
25% down · 7.5% · 30yr
- Down + closing
- —
- Monthly P&I
- —
- Monthly cashflow
- —
- DSCR
- —
- Eligible?
- —
Personal DTI + credit; lowest rate.
DSCR
20% down · 8.5% · 30yr
- Down + closing
- —
- Monthly P&I
- —
- Monthly cashflow
- —
- DSCR
- —
- Eligible?
- —
No personal income docs; deal must DSCR.
Hard money
10% down · 12.0% · 12mo
- Down + closing
- —
- Monthly P&I
- —
- Monthly cashflow
- —
- DSCR
- —
- Eligible?
- —
Short-term bridge; refi at stabilization.
Rent comps 9 comps
| Address | Beds | Baths | Sqft | Rent | $/sqft | DOM | Units | Dist |
|---|---|---|---|---|---|---|---|---|
| 5500 Vinings Dr North Chesterfield, VA | 1.0–2.0 | 1.0–2.0 | 906 | $1,893 | $2.09 | 0d | 15 | 0.72mi |
| 4711 Brompton Sq North Chesterfield, VA | 2.0 | 1.5 | 950 | $1,730 | $1.82 | 45d | 1 | 0.77mi |
| 4708 Leadenhall Dr North Chesterfield, VA | 2.0 | 1.5 | 1102 | $1,851 | $1.68 | 13d | 1 | 0.78mi |
| 4800 Burnt Oak Dr North Chesterfield, VA | 2.0–3.0 | 2.0 | 1047 | $1,594 | $1.52 | 0d | 8 | 1.04mi |
| 6317 Phobus Dr North Chesterfield, VA | 3.0 | 2.0 | 1008 | $2,095 | $2.08 | 5d | 1 | 1.29mi |
| 5201 Hallmark Dr North Chesterfield, VA | 3.0 | 2.5 | 1600 | $1,550 | $0.97 | 45d | 1 | 1.32mi |
| 6139 Buntline Ln North Chesterfield, VA | 3.0 | 2.5 | 1727 | $2,400 | $1.39 | 5d | 1 | 1.44mi |
| 5502 Stella Rd North Chesterfield, VA | 2.0 | 1.5 | 1056 | $1,410 | $1.34 | 0d | 1 | 1.45mi |
| 4502 Cinderwood Dr North Chesterfield, VA | 3.0 | 2.0 | 1540 | $2,200 | $1.43 | 19d | 1 | 1.49mi |
Listing history 4 events
-
2026-06-08statusdays on market $250,000 Pending 5 DOM
-
2026-06-07days on market $250,000 Active 4 DOM
-
2026-06-05remarks 699-char remark
-
2026-06-05$250,000 Active 1 DOM
ⓘ Source: listings_history table (triggers on properties + properties_extension) + one-shot
backfill from property_details.listing_events for pre-trigger history.
Tax reassessment forecast VA · Resets to sale price
- Current annual tax
- $2,488 · $207/mo
- Projected year-2 tax
- $2,488 · $207/mo
- Expected delta
- $0/yr ($0/mo · 0.0%)
ⓘ Screening estimate from a state-policy table — verify with the county assessor before closing.
Climate risk First Street
- Flood 1/10 Low FEMA zone X (unshaded) · 0% chance over 30 yrs
- Wildfire 2/10 Low
- Heat 7/10 Severe 7 d/yr ≥106°F today · 16 d/yr by 30 yrs out
- Wind 6/10 Major 27% chance of damaging wind over 30 yrs
- Air quality 2/10 Low 0 unhealthy d/yr today · 1 by 30 yrs out
Nearby sold comps map
Loading sold comps map…
Walkable amenities ~0.75 mi
Loading nearby amenities…
Taxation est. · year 1
- Rental income
- $22,752
- − Mortgage interest
- −$14,004
- − Property taxes
- −$2,488
- − Insurance
- −$1,250
- − Repairs & maintenance
- −$1,820
- − Management
- −$1,820
- − Depreciation
- −$7,273
- Taxable loss
- −$5,902
- Est. tax savings @ 24.0%
- +$1,417
- After-tax cash flow
- $-79/yr
For passive investors: Depreciation is non-cash, so a rental often shows a tax loss while cash-flowing — sheltering income. Rental losses are passive: they offset passive income freely, and up to $25,000/yr can offset ordinary (W-2) income if you actively participate and your MAGI is under $100k (phasing out to $0 by $150k); unused losses carry forward. On sale, claimed depreciation is recaptured at up to 25%, and gains may owe capital-gains tax (a 1031 exchange can defer both). Figures are a year-1 estimate at your 24.0% rate — not tax advice; consult a CPA.
Schools (NCES district)
- District
- Chesterfield County Public School District
- NCES district ID
- 5100840
- Math proficiency
- 52% ▼ -30.00%
- Reading proficiency
- 64% ▼ -15.00%
- Median HH income
- $72,821
- Composite
- 51.56/100
- National rank
- #1712
- State rank
- #57 of 131 in VA
Livability — Meadowbrook
- Score
- 73/100
- State rank
- #161
- US rank
- #5004
Category grades
Schools grade is shown separately in the Schools card above.
Census & demographics
- County
- Chesterfield County · 406,988 people
- City population
- 46,284
- Metro
- Richmond, VA
- Population (ZIP)
- 47,465
- Household income
- $66,619
- Rent vs Own
- Severe rent burden
- 2031.0
Population outlook (Chesterfield County) Hauer SSP2
- Today (2025)
- 377,190 people
- By 2030
- 395,710 · +4.9%
- By 2040
- 427,694 · +13.4%
- By 2050
- 452,706 · +20.0%
- By 2075
- 505,533 · +34.0%
- By 2100
- 521,282 · +38.2%
Race, ethnicity, and origin ACS 2023
- Neighborhood character
- Diverse neighborhood (Simpson 0.67)
- Race & ethnicity
- Black 46% Hispanic / Latino 30% White 18% Two or more races 9% Asian 2%
- Hispanic origin (detail)
- Mexican 5% Puerto Rican 3%
- Common ancestry
- Italian 1%
- Foreign-born
- 20% · Canada
- Languages at home
- 69% English-only · Spanish 26% Other Indo-European 1% Tagalog/Filipino 1%
Political lean MEDSL · Chesterfield
- 2024 margin
- Lean D (+9.0) · D 53.8% · R 44.8% · Other 1.4%
- 2008→2024 swing
- +16.4pp toward D · 2008: -7.5pp · 2024: 9.0pp
- All cycles
- 2024: D+9.0 2020: D+6.7 2016: R+2.2 2012: R+7.1 2008: R+7.5
Not yet ingested
- Civics
- —
Market trends
- HPI YoY
- ▼ -205.50%
- Current HPI
- 317.6006
- Rent YoY
- ▲ 1.93%
- Metro
- Richmond, VA
- State GDP YoY
- ▲ 2.40%
- F500 in state
- 50
Industry mix (Fortune 500 HQ in VA)
| Industry | F500 HQs | Revenue |
|---|---|---|
| Aerospace / Defense | 4 | $236B |
|
||
| Technology / Defense | 3 | $32B |
|
||
| Financial Services | 2 | $176B |
|
||
| Utilities | 2 | $27B |
|
||
| Insurance | 2 | $25B |
|
||
| Technology | 2 | $15B |
|
||
Price history
+1288.9% since first listed3 events — show timeline
- 2026-06-03 Listed $250,000 CVRMLS
- 2008-06-27 Sold (Public Records) $120,000 Public Records
- 1959-04-23 Sold (Public Records) $18,000 Public Records
Property tax history
+5.1%/yrLatest (2025): $2,488 · +2.6% YoY. Source: county tax records.
Cash-flow waterfall
monthlySold comps — $/sqft
last 12 mo · ≤1 miLoading sold comps…