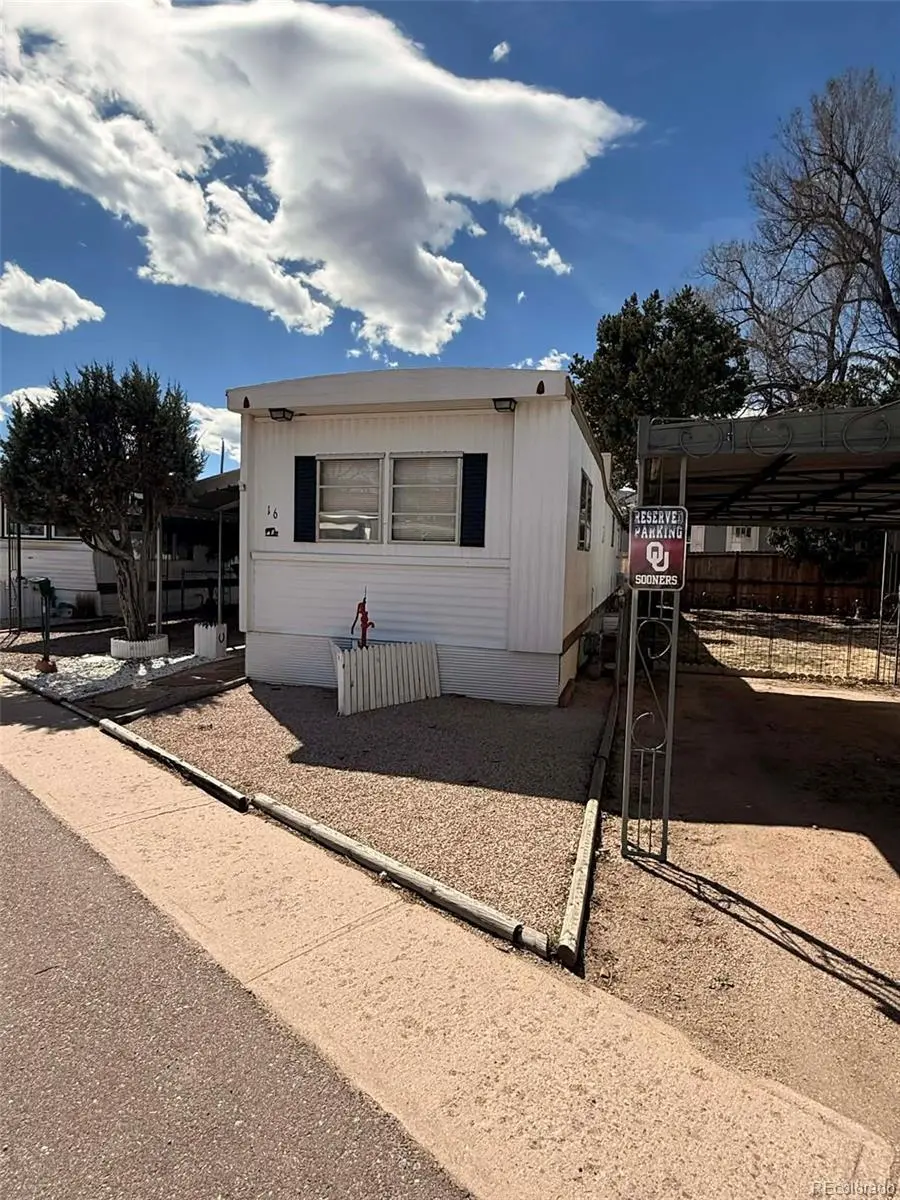
3000 N Cascade Ave · Colorado Springs, CO
Flood risk 7/10 · Major
- FEMA flood zone
- X
- Chance of flooding over 30 yrs
- 0.76%
- Est. flood insurance / yr
- $507 – $1,088
Fire risk 6/10 · Moderate
- Est. fire insurance / yr
- $939 – $1,743
Heat risk 2/10 · Minimal
- Hot days now (above 89°F)
- 6 days/yr
- Hot days in 30 yrs
- 17 days/yr
Wind risk 2/10 · Minimal
- Chance of severe wind over 30 yrs
- —
Air-quality risk 2/10 · Minimal
- Unhealthy air days now
- 0 days/yr
- Unhealthy air days in 30 yrs
- 1 days/yr
Risk factors via First Street. Map © Google.
Why this score? — see what drove the D+ grade
The composite is a weighted blend of 9 inputs, each scored 0–100. Each bar is that input's sub-score; the figure is the points it added to the 100-point composite (weight × sub-score).
- Cash flow +14.9/30.0
- 1% rule +10.0/10.0
- ARV discount +7.5/15.0
- DSCR +4.6/10.0
- Livability +3.9/5.0
- Rent growth +2.5/5.0
- Schools +2.5/10.0
- Condition / age +2.5/5.0
- Appreciation +0.0/10.0
$45,000
🖨 Deal sheet 📄 Offer letter ✓ Due diligence
Key facts
- 2 parking spots
- Built 1969
- Listed 93 days
Property features AI
Finance
- Other: Lot number 16
- Financial info: Land lease in place with monthly fee of $630; lease expiration March 17, 2026; Owned by corporation/trust
- HOA & community: Evergreen Park association, professionally managed; Monthly lot/association fee of $630 (annual $7,560); Senior community
Exterior
- Parking: Two parking spaces; Two carport spaces
- Utilities: Public sewer; Public water
- Home design: Manufactured in-park mobile home; Located in Evergreen park; Entry level: Main
- Construction: Other roof type; 60 ft by 10 ft mobile home
- Exterior features: Covered patio/porch; Deck; Paved road access; Public water
Interior
- Bedrooms: Two bedrooms on the main level
- Flooring: Carpet; Laminate
- Bathrooms: One full bathroom on the main level
- Heating & cooling: Forced air heating
- Interior features: Carpet and laminate flooring
Neighborhood map
What this means for you Summary
Snapshot
- This is a 2-bed/1.0-bath land listed at $45k.
Deal economics
- At list price, monthly cash flow is $-53 ($-641/yr) — negative.
- To cash-flow at today's rent, offer at most $37k (17.2% below list).
- Meets the 1% rule at list price ($1k rent vs $45k).
- Recommended offer: $37k (17.2% below list) — sets the bar for cash-flow.
- Cap rate 6.6% vs local median 3.3% in Colorado Springs — top-decile yield for the area; either an underpriced asset or a hidden risk that comps aren't pricing in. Stress-test before assuming the spread holds.
Location & tenants
- Location reads 78/100 on livability (#23 in CO, #2,639 nationally) — a middle-class / working-renter tenant base. Strengths: amenities A+, housing A+, health & safety A+; Watch: cost of living C-, crime F.
- Colorado Springs School District No. 11 In The County Of E (urban): math 20% / reading 37% proficiency, ranked #56 of 86 in CO (top 65%) — low school quality limits family demand, transient renter base, plan for 1-2y turnover.
- Zoned schools: Jackson Elementary School (math 15% / reading 27%, grade F, #673 of 966 statewide, top 71%, 342 students, 82% FRL); North Middle School (math 21% / reading 42%, grade F, #121 of 270 statewide, top 46%, 590 students, 63% FRL); Coronado High School (math 32% / reading 58%, grade D-, #139 of 381 statewide, top 36%, 1,305 students, 45% FRL).
- Market conditions: Rents flat; 192 active listings in the ZIP; 37 comparable units currently listed for rent nearby; rentals leasing fast (median 3d on market — plan ~1-2 weeks tenant-placement turnaround); 3,906 units permitted in El Paso County in 2024 (872 in 5+ unit buildings).
Forward outlook
- Local home prices are declining (-3.0%/yr); year-one equity from $311 of loan paydown is wiped out by about $1k of value loss. Plan a longer hold.
- El Paso County population projected at +28% by 2050 — long-run rental-demand tailwind backs the buy-and-hold thesis.
Negotiation context
- It's been on market 93 days — a 9% lower offer ($41k) is reasonable based on typical stale-listing flexibility.
- 4 sale attempts since 2y ago with the ask held roughly flat each time — persistent listings suggest the price (not the market) is what's stuck; bring a comps-based counter.
Risks & watch-outs
- Watch-outs: flood insurance adds $66/mo; HOA is 52% of rent.
- Climate carrying-cost: major flood risk; major wildfire risk — expect insurance premiums to compound above CPI over the hold.
Questions for the listing agent
- What do current leases actually rent for vs. the listed asking? Can we see a recent rent roll and the last 12 months of T-12 income?
- It's been on market 93 days. Have you received any prior offers? Is the seller open to a 17% concession, seller financing, or rate buy-down credit?
- Built in 1969 — when were the roof, HVAC, electrical panel, plumbing, and water heater last replaced?
- What's the actual annual flood-insurance premium (NFIP or private), and is the property in a SFHA with mandatory coverage?
- What does the HOA fee cover, when was the last increase, and are there any pending special assessments or reserve-fund shortfalls?
- Why hasn't it sold? Are there any deal-killer items the seller is aware of (foundation, flood, title, zoning, code violations)?
- Is there a deadline driving the sale (1031 exchange, divorce, estate, relocation)? That informs how much negotiation room exists.
- Schools are B-rated — typically a magnet for longer-tenancy family renters. What's the average tenant stay here, and is there a school-zone premium baked into asking?
- Crime grade is F in this area — have there been break-ins, vandalism, or insurance claims at this property in the last 3 years? What carrier currently insures it and at what premium?
- The area grade is low — what's the realistic commute time and amenity access for the typical tenant pool here? Any planned neighborhood developments (good or bad) we should know about?
- What's the average days-on-market for RENTAL listings here right now (not sales)? A rising rental-DOM trend means longer vacancies and softer asking-rent achievability than the comps imply.
- What's the recent tenant-quality profile in this submarket — average credit score on applications, eviction rate, late-payment / NSF rate, and stable-employment percentage? A property-management company in the area should have these aggregated.
- How much new for-sale + rental construction is in the pipeline within 1–3 miles? Heavy new supply typically softens prices + rents 12–24 months out; constrained supply supports both.
Investment metrics
- 1% rule
- 2.68% ✓
- Cap rate
- 6.64%
- Cash-on-cash
- 1.24%
- DSCR
- 1.06
- GRM
- 3.1
CMA / ARV
No comps found within radius.
Projected returns pro-forma
-3.0% appreciation · 0.11% rent growth · sell at horizon
- IRR
- -36.9%
- Equity multiple
- -0.08×
- Total profit
- $-13,663
- Equity at exit
- $6,710
- IRR
- —
- Equity multiple
- -1.20×
- Total profit
- $-27,686
- Equity at exit
- $3,891
Cash invested: $12,600 (down + closing). Projections, not guarantees.
Landlord ↔ Tenant lean methodology
- Overall (STATE)
- 38 Tenant-Leaning
- State Colorado
- 38 Tenant-Leaning · D+4
- County
- — inherits STATE
- City
- — inherits STATE
ZIP-level market 80907
- Rents YoY
- 0.1%
- Active inventory
- 192
- Price-to-rent
- 3.1×
Monthly cashflow live
- Estimated rent
- $1,208 high interval (Pro) →
- Mortgage (P&I)
- −$236
- Tax est. 1.5%
- −$56 /mo · $675/yr
- Insurance
- −$19
- Flood insurance flood zone
- −$66 /mo · $798/yr
- HOA
- −$630
- Vacancy / Maint / Mgmt
- −$254
- Net cashflow
- $-53
Break-even live
UW: 25.0% down · 7.5% · 30yr · 1.5% tax · 5.0% vac · 8.0% maint · 8.0% mgmt
Financing live
Cash to close
- Down payment
- $11,250
- Closing costs
- $1,350
- Reserves months
- —
- Total cash needed
- —
Loan-product check · same deal, 3 products live
Conventional
25% down · 7.5% · 30yr
- Down + closing
- —
- Monthly P&I
- —
- Monthly cashflow
- —
- DSCR
- —
- Eligible?
- —
Personal DTI + credit; lowest rate.
DSCR
20% down · 8.5% · 30yr
- Down + closing
- —
- Monthly P&I
- —
- Monthly cashflow
- —
- DSCR
- —
- Eligible?
- —
No personal income docs; deal must DSCR.
Hard money
10% down · 12.0% · 12mo
- Down + closing
- —
- Monthly P&I
- —
- Monthly cashflow
- —
- DSCR
- —
- Eligible?
- —
Short-term bridge; refi at stabilization.
Rent comps 37 comps
| Address | Beds | Baths | Sqft | Rent | $/sqft | DOM | Units | Dist |
|---|---|---|---|---|---|---|---|---|
| 80 W Taylor St Colorado Springs, CO | 1.0 | 1.0 | 535 | $750 | $1.40 | 3d | 3 | 0.15mi |
| 2912 Concord St Colorado Springs, CO | 1.0 | 1.0 | 525 | $795 | $1.51 | 23d | 1 | 0.16mi |
| 2925 Tremont St Colorado Springs, CO | 1.0–2.0 | 1.0 | 682 | $915 | $1.34 | 3d | 8 | 0.29mi |
| 2613 Concord St Apt 104 Colorado Springs, CO | 2.0 | 1.0 | 725 | $1,149 | $1.58 | 3d | 1 | 0.38mi |
| 2602 N Cascade Ave Unit 2602-102 Colorado Springs, CO | 1.0 | 1.0 | 691 | $1,495 | $2.16 | 23d | 1 | 0.40mi |
| 39 Sunflower Rd Unit B 58766927680 Colorado Springs, CO | 1.0 | 1.0 | 544 | $1,250 | $2.30 | 14d | 1 | 0.41mi |
| 2602 N Cascade Ave Unit 2515-102 Colorado Springs, CO | 1.0 | 1.0 | 691 | $1,495 | $2.16 | 3d | 1 | 0.42mi |
| 6715 N Century St Colorado Springs, CO | 1.0–3.0 | 1.0–2.0 | 1043 | $2,105 | $2.02 | 2d | 26 | 0.46mi |
| 3125 Sinton Rd Colorado Springs, CO | 2.0 | 1.0 | 660 | $1,402 | $2.12 | 3d | 6 | 0.58mi |
| 2414 Tremont St Colorado Springs, CO | 1.0–2.0 | 1.0 | 806 | $1,580 | $1.96 | 3d | 5 | 0.62mi |
| 2924 N Arcadia St Colorado Springs, CO | 1.0–2.0 | 1.0 | 775 | $1,099 | $1.42 | 23d | 4 | 0.71mi |
| 3341 El Paso Pl Colorado Springs, CO | 1.0 | 1.0 | 495 | $899 | $1.82 | 3d | 1 | 0.74mi |
| 3210 N Chestnut St Colorado Springs, CO | 2.0 | 1.0 | 597 | $1,233 | $2.06 | 3d | 8 | 0.79mi |
| 3850 Schafer Hts Colorado Springs, CO | 1.0–2.0 | 1.0–2.0 | 752 | $1,524 | $2.03 | 3d | 5 | 0.81mi |
| 917 2nd St Colorado Springs, CO | 1.0 | 1.0 | 432 | $875 | $2.03 | 23d | 1 | 0.81mi |
| 2909 Sage St Colorado Springs, CO | 2.0 | 1.0 | 689 | $768 | $1.11 | 21d | 1 | 0.82mi |
| 2910 Sage St Colorado Springs, CO | 1.0 | 1.0 | 415 | $960 | $2.31 | 3d | 9 | 0.88mi |
| 670 W Van Buren St #4 Colorado Springs, CO | 1.0 | 1.0 | 446 | $850 | $1.91 | 23d | 1 | 0.89mi |
| 2922 Straus Ln Colorado Springs, CO | 2.0 | 1.0 | 750 | $1,150 | $1.53 | 3d | 1 | 0.92mi |
| 3113 Illinois Ave Colorado Springs, CO | 1.0 | 1.0 | 600 | $964 | $1.61 | 3d | 1 | 1.01mi |
| 3113 Illinois Ave Unit 4 Colorado Springs, CO | 1.0 | 1.0 | 600 | $814 | $1.36 | 23d | 1 | 1.01mi |
| 921 Westmoreland Rd Colorado Springs, CO | 1.0–2.0 | 1.0 | 750 | $1,234 | $1.65 | 3d | 12 | 1.05mi |
| 3224 Illinois Ave Colorado Springs, CO | 2.0 | 1.0 | 600 | $1,249 | $2.08 | 23d | 1 | 1.07mi |
| 325 Cragmor Rd Colorado Springs, CO | 2.0 | 1.0 | 537 | $899 | $1.67 | 3d | 2 | 1.11mi |
| 1038 Westmoreland Rd Unit A Colorado Springs, CO | 2.0 | 1.0 | 700 | $875 | $1.25 | 14d | 1 | 1.11mi |
| 1134 Westmoreland Rd Colorado Springs, CO | 1.0–2.0 | 1.0 | 675 | $1,050 | $1.56 | 3d | 2 | 1.15mi |
| 4311 N Chestnut St Unit 2 Colorado Springs, CO | 1.0 | 1.0 | 700 | $925 | $1.32 | 23d | 1 | 1.20mi |
| 1919 N Chestnut St Unit B Colorado Springs, CO | 1.0 | 1.0 | 650 | $875 | $1.35 | 23d | 1 | 1.23mi |
| 2485 Bravery Hts Colorado Springs, CO | 1.0–3.0 | 1.0–2.0 | 1032 | $2,116 | $2.05 | 2d | 18 | 1.24mi |
| 4331 N Chestnut St Colorado Springs, CO | 1.0 | 1.0 | 516 | $928 | $1.80 | 3d | 5 | 1.28mi |
| 3370 Bryson Hts Colorado Springs, CO | 1.0–3.0 | 1.0–2.0 | 980 | $1,892 | $1.93 | 2d | 21 | 1.28mi |
| 975 Pettit Lake Hts Colorado Springs, CO | 3.0 | 1.0–2.0 | 846 | $1,912 | $2.26 | 2d | 28 | 1.31mi |
| 4348 N Chestnut St Colorado Springs, CO | 1.0 | 1.0 | 525 | $1,018 | $1.94 | 3d | 6 | 1.35mi |
| 3630 Rialto Hts Colorado Springs, CO | 1.0–3.0 | 1.0–2.0 | 959 | $1,588 | $1.66 | 2d | 13 | 1.37mi |
| 612 E Del Norte St Colorado Springs, CO | 2.0 | 1.0 | 748 | $1,600 | $2.14 | 23d | 1 | 1.37mi |
| 4357 N Chestnut St Colorado Springs, CO | 1.0 | 1.0 | 550 | $880 | $1.60 | 21d | 1 | 1.40mi |
| 1516 N Cascade Ave Colorado Springs, CO | 1.0 | 1.0 | 570 | $1,250 | $2.19 | 23d | 1 | 1.41mi |
HOA detail
- Monthly dues
- $630 · $7,560/yr
Listing history 25 events
-
2026-06-18days on market $45,000 Active 93 DOM
-
2026-06-17days on market $45,000 Active 92 DOM
-
2026-06-16days on market $45,000 Active 91 DOM
-
2026-06-15days on market $45,000 Active 90 DOM
-
2026-06-14days on market $45,000 Active 88 DOM
-
2026-06-10days on market $45,000 Active 85 DOM
-
2026-06-09days on market $45,000 Active 84 DOM
-
2026-06-08days on market $45,000 Active 83 DOM
-
2026-06-07days on market $45,000 Active 82 DOM
-
2026-06-05days on market $45,000 Active 79 DOM
-
2026-06-03days on market $45,000 Active 78 DOM
-
2026-06-03days on market $45,000 Active 77 DOM
-
2026-06-01days on market $45,000 Active 76 DOM
-
2026-05-31days on market $45,000 Active 75 DOM
-
2026-03-17$45,000 Active
-
2025-06-30historical
-
2025-04-21price $85,000
-
2025-03-25status Active
-
2025-03-10historical
-
2025-01-17$95,000 Active
-
2024-11-01historical
-
2024-08-24$130,000 Active
-
2003-02-12soldstatus $1,050,000
-
2001-04-03soldstatus $910,000
-
1996-01-18soldstatus $5,000
ⓘ Source: listings_history table (triggers on properties + properties_extension) + one-shot
backfill from property_details.listing_events for pre-trigger history.
Climate risk First Street
- Flood 7/10 Severe FEMA zone X · 76% chance over 30 yrs
- Wildfire 6/10 Major
- Heat 2/10 Low 6 d/yr ≥89°F today · 17 d/yr by 30 yrs out
- Wind 2/10 Low
- Air quality 2/10 Low 0 unhealthy d/yr today · 1 by 30 yrs out
Nearby sold comps map
Loading sold comps map…
Walkable amenities ~0.75 mi
Loading nearby amenities…
Taxation est. · year 1
- Rental income
- $14,491
- − Mortgage interest
- −$2,521
- − Property taxes
- −$675
- − Insurance
- −$1,022
- − Repairs & maintenance
- −$1,159
- − Management
- −$1,159
- − HOA
- −$7,560
- − Depreciation
- −$1,309
- Taxable loss
- −$915
- Est. tax savings @ 24.0%
- +$220
- After-tax cash flow
- $-422/yr
For passive investors: Depreciation is non-cash, so a rental often shows a tax loss while cash-flowing — sheltering income. Rental losses are passive: they offset passive income freely, and up to $25,000/yr can offset ordinary (W-2) income if you actively participate and your MAGI is under $100k (phasing out to $0 by $150k); unused losses carry forward. On sale, claimed depreciation is recaptured at up to 25%, and gains may owe capital-gains tax (a 1031 exchange can defer both). Figures are a year-1 estimate at your 24.0% rate — not tax advice; consult a CPA.
Schools (NCES district)
- District
- Colorado Springs School District No. 11 In The County Of E
- NCES district ID
- 0803060
- Math proficiency
- 20% ▼ -8.00%
- Reading proficiency
- 37% ▼ -4.00%
- Median HH income
- $47,884
- Composite
- 24.69/100
- National rank
- #7613
- State rank
- #56 of 86 in CO
Livability — Colorado Springs
- Score
- 78/100
- State rank
- #23
- US rank
- #2639
Category grades
Schools grade is shown separately in the Schools card above.
Census & demographics
- Census place
- Colorado Springs, CO
- County
- El Paso County · 689,348 people
- City population
- 555,783
- Metro
- Colorado Springs, CO
- Population (ZIP)
- 27,815
- Household income
- $74,402
- Rent vs Own
- Severe rent burden
- 1396.0
Population outlook (El Paso County) Hauer SSP2
- Today (2025)
- 768,926 people
- By 2030
- 815,739 · +6.1%
- By 2040
- 903,489 · +17.5%
- By 2050
- 981,204 · +27.6%
- By 2075
- 1,155,542 · +50.3%
- By 2100
- 1,202,070 · +56.3%
Race, ethnicity, and origin ACS 2023
- Neighborhood character
- Predominantly White (77%)
- Race & ethnicity
- White 77% Hispanic / Latino 12% Two or more races 10% Black 3% Asian 2%
- Hispanic origin (detail)
- Mexican 8%
- Common ancestry
- Italian 3% Lithuanian 3% Slovak 3%
- Foreign-born
- 5% · Canada
- Languages at home
- 93% English-only · Spanish 4% German/W. Germanic 1%
Political lean MEDSL · El Paso
- 2024 margin
- Lean R (+9.8) · D 43.8% · R 53.5% · Other 2.7%
- 2008→2024 swing
- +9.0pp toward D · 2008: -18.8pp · 2024: -9.8pp
- All cycles
- 2024: R+9.8 2020: R+10.8 2016: R+22.6 2012: R+21.4 2008: R+18.8
Not yet ingested
- Civics
- —
Market trends
- HPI YoY
- ▼ -544.07%
- Current HPI
- 276.2139
- Rent YoY
- ▲ 0.11%
- Metro
- Colorado Springs, CO
- State GDP YoY
- ▲ 1.95%
- F500 in state
- 14
Industry mix (Fortune 500 HQ in CO)
| Industry | F500 HQs | Revenue |
|---|---|---|
| Technology Distribution | 1 | $31B |
|
||
| Food / Agriculture | 1 | $18B |
|
||
| Packaging | 1 | $14B |
|
||
| Healthcare | 1 | $13B |
|
||
| Energy | 1 | $10B |
|
||
| Technology | 1 | $4B |
|
||
Price history
+800.0% since first listed11 events — show timeline
- 2026-03-17 Listed $45,000 REColorado as Distributed by MLS Grid
- 2025-06-30 Listing Removed — REColorado as Distributed by MLS Grid
- 2025-04-21 Price Changed $85,000 REColorado as Distributed by MLS Grid
- 2025-03-25 Relisted — REColorado as Distributed by MLS Grid
- 2025-03-10 Listing Removed — REColorado as Distributed by MLS Grid
- 2025-01-17 Listed $95,000 REColorado as Distributed by MLS Grid
- 2024-11-01 Listing Removed — REColorado as Distributed by MLS Grid
- 2024-08-24 Listed $130,000 REColorado as Distributed by MLS Grid
- 2003-02-12 Sold (Public Records) $1,050,000 Public Records
- 2001-04-03 Sold (Public Records) $910,000 Public Records
- 1996-01-18 Sold (Public Records) $5,000 Public Records
Property tax history
+10.7%/yrLatest (2024): $3,353 · +1.0% YoY. Source: county tax records.
Cash-flow waterfall
monthlySold comps — $/sqft
last 12 mo · ≤1 miLoading sold comps…