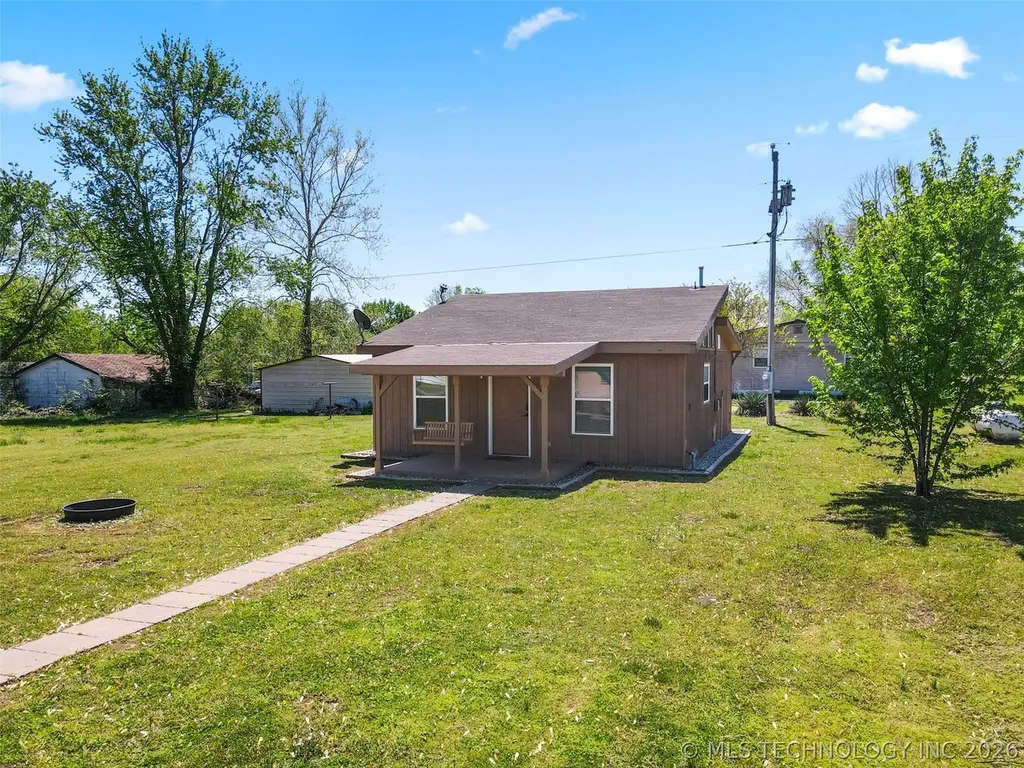
444389 E Northridge Dr · Sportmans Shores, OK
Flood risk 1/10 · Minimal
- FEMA flood zone
- X (unshaded)
- Chance of flooding over 30 yrs
- 0.0%
- Est. flood insurance / yr
- $507 – $1,088
Fire risk 4/10 · Minor
- Est. fire insurance / yr
- $2,463 – $4,575
Heat risk 6/10 · Moderate
- Hot days now (above 110°F)
- 7 days/yr
- Hot days in 30 yrs
- 20 days/yr
Wind risk 2/10 · Minimal
- Chance of severe wind over 30 yrs
- 3.0%
Air-quality risk 3/10 · Minor
- Unhealthy air days now
- 2 days/yr
- Unhealthy air days in 30 yrs
- 3 days/yr
Risk factors via First Street. Map © Google.
Why this score? — see what drove the C- grade
The composite is a weighted blend of 9 inputs, each scored 0–100. Each bar is that input's sub-score; the figure is the points it added to the 100-point composite (weight × sub-score).
- Cash flow +15.8/30.0
- Appreciation +10.0/10.0
- ARV discount +7.5/15.0
- DSCR +4.9/10.0
- 1% rule +3.6/10.0
- Rent growth +2.5/5.0
- Livability +2.5/5.0
- Condition / age +2.5/5.0
- Schools +1.8/10.0
$119,900
🖨 Deal sheet 📄 Offer letter ✓ Due diligence
Listing remarks MLS
Sold at time of listing. For statistical purposes only.
Key facts
- Langley schools
- Vinita address
- Rv pad
Tags
Property features AI
Finance
- HOA & community: Gutters noted as a community feature
Exterior
- Parking: Detached garage with workshop space (1 car)
- Security: No safety shelter
- Utilities: Electricity available; Natural gas available; Water available; Septic tank; Rural water source
- Home design: Single-story; Faces north; Slab foundation
- Construction: Wood siding; Wood frame construction; Asphalt/fiberglass roof
- Exterior features: Gravel driveway; Rain gutters; Covered patio/porch; Deck; Porch; Mature trees
Interior
- Kitchen: Eat-in kitchen; Built-in range; Range; Oven; Gas range connection; Gas oven connection; Dishwasher; Refrigerator
- Bedrooms: Master bedroom on the first floor with private bath and separate closets
- Flooring: Tile; Vinyl
- Bathrooms: One full bathroom; Master bathroom with bathtub (first floor)
- Heating & cooling: Propane heating
- Interior features: High ceilings; Laminate counters; Ceiling fan(s); Gas range connection; Gas oven connection; Vinyl window features
- Laundry & utility: Washer hookup; Electric dryer hookup; Inside utility room
Neighborhood map
What this means for you Summary
Snapshot
- This is a 1-bed/1.0-bath single-family listed at $120k.
Deal economics
- At list price, monthly cash flow is $54 ($650/yr) — positive.
- The deal already cash-flows at list — no discount required.
- To meet the 1% rule (rent ≥ 1% of price), the offer needs to be $104k (13.6% below list).
- Recommended offer: $104k (13.6% below list) — sets the bar for 1% rule.
Location & tenants
- Location reads: area grade C — affects rentability + tenant quality, not the cash-flow math above.
- Ketchum (rural): math 20% / reading 22% proficiency, ranked #166 of 270 in OK (top 62%) — low school quality limits family demand, transient renter base, plan for 1-2y turnover; 64% free/reduced lunch — lower-income household profile, screen leases tightly.
- Market conditions: 113 active listings in the ZIP; 23 units permitted in Mayes County in 2024 (0 in 5+ unit buildings).
Forward outlook
- In year one you build about $13k of equity ($829 loan paydown + $12k appreciation (10.0% local appreciation)).
- Mayes County population projected at -10% by 2050 — secular population decline; favor cash flow + early exit over multi-decade hold.
- At projected returns (10.0% appreciation + 3.0% rent growth), your $34k cash investment doubles in ~3 years — after that, you're playing with house money.
- By year 3, paydown + projected appreciation supports a ~$32k cash-out refi (75% LTV) — recoverable capital for the next deal without selling this one.
Negotiation context
- It's been on market 30 days — a 2% lower offer ($118k) is reasonable based on typical stale-listing flexibility.
- 4 sale attempts since 3y ago with the ask held roughly flat each time — persistent listings suggest the price (not the market) is what's stuck; bring a comps-based counter.
Risks & watch-outs
- Climate carrying-cost: extreme-heat days projected 7→20/yr by 2055 (HVAC capex compounding) — expect insurance premiums to compound above CPI over the hold.
Questions for the listing agent
- Is there a deadline driving the sale (1031 exchange, divorce, estate, relocation)? That informs how much negotiation room exists.
- What's the average days-on-market for RENTAL listings here right now (not sales)? A rising rental-DOM trend means longer vacancies and softer asking-rent achievability than the comps imply.
- What's the recent tenant-quality profile in this submarket — average credit score on applications, eviction rate, late-payment / NSF rate, and stable-employment percentage? A property-management company in the area should have these aggregated.
- How much new for-sale + rental construction is in the pipeline within 1–3 miles? Heavy new supply typically softens prices + rents 12–24 months out; constrained supply supports both.
Investment metrics
- 1% rule
- 0.86% ✗
- Cap rate
- 6.84%
- Cash-on-cash
- 1.94%
- DSCR
- 1.09
- GRM
- 9.6
CMA / ARV
No comps found within radius.
Projected returns pro-forma
10.0% appreciation · 3.0% rent growth · sell at horizon
- IRR
- 25.7%
- Equity multiple
- 3.05×
- Total profit
- $68,727
- Equity at exit
- $108,015
- IRR
- 22.6%
- Equity multiple
- 6.95×
- Total profit
- $199,630
- Equity at exit
- $232,939
Cash invested: $33,572 (down + closing). Projections, not guarantees.
Landlord ↔ Tenant lean methodology
- Overall (STATE)
- 83 Strongly Landlord-Friendly
- State Oklahoma
- 83 Strongly Landlord-Friendly · R+20
- County
- — inherits STATE
- City
- — inherits STATE
ZIP-level market 74301
- Home prices YoY
- 7.1%
- Active inventory
- 113
- Price-to-rent
- 9.6×
Monthly cashflow live
- Estimated rent
- $1,036 medium interval (Pro) →
- Mortgage (P&I)
- −$629
- Tax from tax record
- −$86 /mo · $1,029/yr
- Insurance
- −$50
- HOA
- −$0
- Vacancy / Maint / Mgmt
- −$218
- Net cashflow
- $54
Break-even live
UW: 25.0% down · 7.5% · 30yr · 1.5% tax · 5.0% vac · 8.0% maint · 8.0% mgmt
Financing live
Cash to close
- Down payment
- $29,975
- Closing costs
- $3,597
- Reserves months
- —
- Total cash needed
- —
Loan-product check · same deal, 3 products live
Conventional
25% down · 7.5% · 30yr
- Down + closing
- —
- Monthly P&I
- —
- Monthly cashflow
- —
- DSCR
- —
- Eligible?
- —
Personal DTI + credit; lowest rate.
DSCR
20% down · 8.5% · 30yr
- Down + closing
- —
- Monthly P&I
- —
- Monthly cashflow
- —
- DSCR
- —
- Eligible?
- —
No personal income docs; deal must DSCR.
Hard money
10% down · 12.0% · 12mo
- Down + closing
- —
- Monthly P&I
- —
- Monthly cashflow
- —
- DSCR
- —
- Eligible?
- —
Short-term bridge; refi at stabilization.
Listing history 14 events
-
2026-06-04statusdays on market $119,900 Pending 30 DOM
-
2026-06-02days on market $119,900 Active 29 DOM
-
2026-06-01days on market $119,900 Active 28 DOM
-
2026-05-31days on market $119,900 Active 27 DOM
-
2026-05-04$119,900 Active
-
2026-04-15historical
-
2026-02-02status Active
-
2025-11-05status Pending
-
2025-08-30price $119,900
-
2025-05-16price $125,000
-
2025-04-15$130,000 Active
-
2023-11-30soldstatus $106,000 Closed 55-char remark
Show marketing remark (55 chars)
Sold at time of listing. For statistical purposes only.
-
2023-11-29soldstatus $106,000
-
2023-11-23$106,000 Active 55-char remark
Show marketing remark (55 chars)
Sold at time of listing. For statistical purposes only.
ⓘ Source: listings_history table (triggers on properties + properties_extension) + one-shot
backfill from property_details.listing_events for pre-trigger history.
Tax reassessment forecast OK · Resets to sale price
- Current annual tax
- $1,029 · $86/mo
- Projected year-2 tax
- $1,079 · $90/mo
- Expected delta
- +$50/yr (+$4/mo · 4.9%)
ⓘ Screening estimate from a state-policy table — verify with the county assessor before closing.
Climate risk First Street
- Flood 1/10 Low FEMA zone X (unshaded) · 0% chance over 30 yrs
- Wildfire 4/10 Moderate
- Heat 6/10 Major 7 d/yr ≥110°F today · 20 d/yr by 30 yrs out
- Wind 2/10 Low 3% chance of damaging wind over 30 yrs
- Air quality 3/10 Moderate 2 unhealthy d/yr today · 3 by 30 yrs out
Nearby sold comps map
Loading sold comps map…
Walkable amenities ~0.75 mi
Loading nearby amenities…
Taxation est. · year 1
- Rental income
- $12,435
- − Mortgage interest
- −$6,716
- − Property taxes
- −$1,029
- − Insurance
- −$600
- − Repairs & maintenance
- −$995
- − Management
- −$995
- − Depreciation
- −$3,488
- Taxable loss
- −$1,387
- Est. tax savings @ 24.0%
- +$333
- After-tax cash flow
- $983/yr
For passive investors: Depreciation is non-cash, so a rental often shows a tax loss while cash-flowing — sheltering income. Rental losses are passive: they offset passive income freely, and up to $25,000/yr can offset ordinary (W-2) income if you actively participate and your MAGI is under $100k (phasing out to $0 by $150k); unused losses carry forward. On sale, claimed depreciation is recaptured at up to 25%, and gains may owe capital-gains tax (a 1031 exchange can defer both). Figures are a year-1 estimate at your 24.0% rate — not tax advice; consult a CPA.
Schools (NCES district)
- District
- Ketchum
- NCES district ID
- 4016380
- Math proficiency
- 20% ▼ -15.00%
- Reading proficiency
- 22% ▼ -9.00%
- Median HH income
- $39,351
- Composite
- 17.72/100
- National rank
- #9021
- State rank
- #166 of 270 in OK
Livability — Sportmans Shores
No livability data for this city. (Only ~50 U.S. cities are tracked.)
Census & demographics
- Census place
- Sportmans Shores, OK
- Population (ZIP)
- 11,126
Population outlook (Mayes County) Hauer SSP2
- Today (2025)
- 39,941 people
- By 2030
- 39,172 · -1.9%
- By 2040
- 37,540 · -6.0%
- By 2050
- 35,854 · -10.2%
- By 2075
- 32,361 · -19.0%
- By 2100
- 28,054 · -29.8%
Race, ethnicity, and origin ACS 2023
- Neighborhood character
- Diverse neighborhood (Simpson 0.64)
- Race & ethnicity
- White 60% Native American 20% Two or more races 12% Black 4% Hispanic / Latino 4% Asian 1%
- Common ancestry
- Slovak 2% Lithuanian 1% Italian 1%
- Foreign-born
- 2% · Canada, Vietnam
- Languages at home
- 96% English-only · Spanish 3% Other Asian/Pacific 1%
Political lean MEDSL · Mayes
- 2024 margin
- Solid R (+57.5) · D 20.3% · R 77.8% · Other 1.9%
- 2008→2024 swing
- -29.4pp toward R · 2008: -28.1pp · 2024: -57.5pp
- All cycles
- 2024: R+57.5 2020: R+55.1 2016: R+51.7 2012: R+33.3 2008: R+28.1
Not yet ingested
- Civics
- —
Market trends
- HPI YoY
- ▲ 17.37%
- Current HPI
- 262.4336
- Rent YoY
- —
- Metro
- —
- State GDP YoY
- ▲ 1.55%
- F500 in state
- 6
Industry mix (Fortune 500 HQ in OK)
| Industry | F500 HQs | Revenue |
|---|---|---|
| Energy | 3 | $48B |
|
||
Price history
+13.1% since first listed10 events — show timeline
- 2026-05-04 Listed $119,900 MLS Technology, Inc.
- 2026-04-15 Listing Removed — MLS Technology, Inc.
- 2026-02-02 Relisted — MLS Technology, Inc.
- 2025-11-05 Pending — MLS Technology, Inc.
- 2025-08-30 Price Changed $119,900 MLS Technology, Inc.
- 2025-05-16 Price Changed $125,000 MLS Technology, Inc.
- 2025-04-15 Listed $130,000 MLS Technology, Inc.
- 2023-11-30 Sold (MLS) $106,000 MLS Technology, Inc.
- 2023-11-29 Sold (Public Records) $106,000 Public Records
- 2023-11-23 Listed $106,000 MLS Technology, Inc.
Property tax history
+34.3%/yrLatest (2025): $1,029 · +4.9% YoY. Source: county tax records.
Cash-flow waterfall
monthlySold comps — $/sqft
last 12 mo · ≤1 miLoading sold comps…