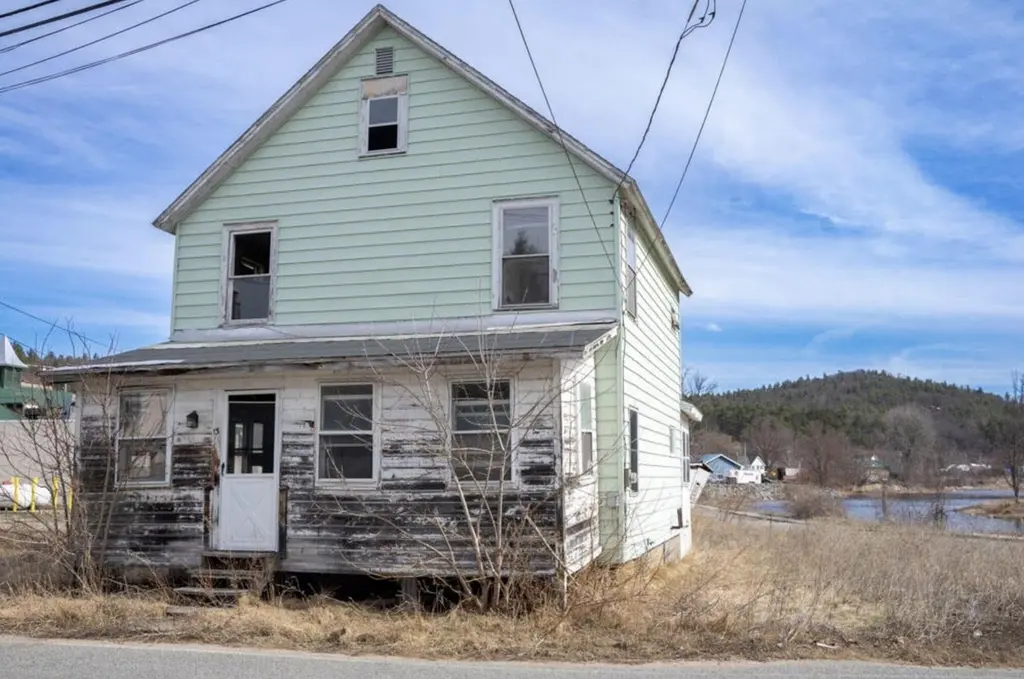
13 Grove Rd · Au Sable Forks, NY
Flood risk 10/10 · Severe
- FEMA flood zone
- AE
- Chance of flooding over 30 yrs
- 0.99%
- Est. flood insurance / yr
- $2,026 – $9,024
Fire risk 3/10 · Minor
- Est. fire insurance / yr
- $691 – $1,283
Heat risk 2/10 · Minimal
- Hot days now (above 91°F)
- 8 days/yr
- Hot days in 30 yrs
- 18 days/yr
Wind risk 1/10 · Minimal
- Chance of severe wind over 30 yrs
- 0.0%
Air-quality risk 2/10 · Minimal
- Unhealthy air days now
- 1 days/yr
- Unhealthy air days in 30 yrs
- 1 days/yr
Risk factors via First Street. Map © Google.
Why this score? — see what drove the B+ grade
The composite is a weighted blend of 9 inputs, each scored 0–100. Each bar is that input's sub-score; the figure is the points it added to the 100-point composite (weight × sub-score).
- Cash flow +30.0/30.0
- 1% rule +10.0/10.0
- DSCR +10.0/10.0
- Appreciation +8.5/10.0
- ARV discount +7.5/15.0
- Schools +3.7/10.0
- Livability +2.7/5.0
- Rent growth +2.5/5.0
- Condition / age +2.5/5.0
$49,000
🖨 Deal sheet 📄 Offer letter ✓ Due diligence
Listing remarks
Great opportunity for a fixer upper. Conveniently located right in the town of Ausable Forks and in walking distance to all local retail. With a beautiful view of the river and a short drive to any outdoor adventure.
Key facts
- Beautiful view
- Walking distance
- 6,534 sq ft lot
Tags
Property features AI
Finance
- Financial info: Annual taxes listed
Exterior
- Parking: Off-street parking
- Utilities: Public water; Public sewer; Electricity connected (100 amp service)
- Home design: Single-family residential house; Two levels; Fixer condition
- Construction: Vinyl siding; Asphalt roof
- Exterior features: Front porch; Back yard; Cleared lot; Paved road frontage on a county road; Has a view
Interior
- Flooring: Wood floors
- Bathrooms: 1 full bathroom; 1 half bathroom
- Heating & cooling: Oil heating; No central cooling
- Interior features: Double-pane windows; Unfinished dirt-floor basement
Neighborhood map
What this means for you Summary
Snapshot
- This is a 3-bed/1.0-bath single-family listed at $49k.
Deal economics
- At list price, monthly cash flow is $-23 ($-271/yr) — negative.
- To cash-flow at today's rent, offer at most $46k (6.7% below list).
- Meets the 1% rule at list price ($983 rent vs $49k).
- Recommended offer: $46k (6.7% below list) — sets the bar for cash-flow.
- Cap rate 17.0% vs local median 1.4% in Au Sable Forks — top-decile yield for the area; either an underpriced asset or a hidden risk that comps aren't pricing in. Stress-test before assuming the spread holds.
Location & tenants
- Location reads 54/100 on livability (#1,143 in NY) — a working-class tenant base; expect higher turnover. Strengths: cost of living A+, housing B+; Watch: schools D-, crime F, amenities F.
- Ausable Valley Central School District (rural): math 36% / reading 51% proficiency, ranked #474 of 590 in NY (top 80%) — families likely to look elsewhere, expect single-tenant / working-renter base with shorter leases.
- Market conditions: 26 active listings in the ZIP; 218 units permitted in Essex County in 2024 (63 in 5+ unit buildings).
Forward outlook
- In year one you build about $4k of equity ($339 loan paydown + $3k appreciation (6.9% local appreciation)).
- Essex County population projected at -20% by 2050 — secular population decline; favor cash flow + early exit over multi-decade hold.
- At projected returns (6.9% appreciation + 3.0% rent growth), your $14k cash investment doubles in ~4 years — after that, you're playing with house money.
- By year 9, paydown + projected appreciation supports a ~$35k cash-out refi (75% LTV) — recoverable capital for the next deal without selling this one.
Negotiation context
- It's been on market 52 days — a 3% lower offer ($48k) is reasonable based on typical stale-listing flexibility.
- Current owner paid $20k; list at $49k implies a 145% gain — meaningful room to come down on a strong offer.
Risks & watch-outs
- Watch-outs: flood insurance adds $460/mo; built in 1920 — expect roof / HVAC / electrical / plumbing capex.
- Climate carrying-cost: in FEMA flood zone AE (mandatory federal flood insurance) — expect insurance premiums to compound above CPI over the hold.
Questions for the listing agent
- What do current leases actually rent for vs. the listed asking? Can we see a recent rent roll and the last 12 months of T-12 income?
- It's been on market 52 days. Have you received any prior offers? Is the seller open to a 7% concession, seller financing, or rate buy-down credit?
- Built in 1920 — when were the roof, HVAC, electrical panel, plumbing, and water heater last replaced?
- What's the actual annual flood-insurance premium (NFIP or private), and is the property in a SFHA with mandatory coverage?
- Is there a deadline driving the sale (1031 exchange, divorce, estate, relocation)? That informs how much negotiation room exists.
- Schools are D-rated, which usually means shorter tenancies and higher turnover. Who's the typical renter profile here, and what's been the actual vacancy rate?
- Crime grade is F in this area — have there been break-ins, vandalism, or insurance claims at this property in the last 3 years? What carrier currently insures it and at what premium?
- What's the average days-on-market for RENTAL listings here right now (not sales)? A rising rental-DOM trend means longer vacancies and softer asking-rent achievability than the comps imply.
- What's the recent tenant-quality profile in this submarket — average credit score on applications, eviction rate, late-payment / NSF rate, and stable-employment percentage? A property-management company in the area should have these aggregated.
- How much new for-sale + rental construction is in the pipeline within 1–3 miles? Heavy new supply typically softens prices + rents 12–24 months out; constrained supply supports both.
Investment metrics
- 1% rule
- 2.01% ✓
- Cap rate
- 17.01%
- Cash-on-cash
- 38.29%
- DSCR
- 2.70
- GRM
- 4.2
CMA / ARV
- ARV (on-the-fly)
- $162,000
- Comps found
- 5
Show comp detail 5 sales within ~0.75 mi
| Address | Dist | Beds/Ba | Sqft | Sold | Price | $/sf | Match |
|---|---|---|---|---|---|---|---|
| 2446 State Hwy 9N | 0.35mi | 3/1.0 | 1,319 (-2%) | 8mo | $174,500 | $132 | 73 |
| 31 Broad St | 0.34mi | 4/1.0 (+1) | 1,315 (-3%) | 14mo | $120,000 | $91 | 63 |
| 3 Woodyard Ln | 0.11mi | 2/2.0 (-1) | 1,516 (+12%) | 6mo | $182,500 | $120 | 60 |
| 12 Mccrea St | 0.30mi | 3/1.0 | 1,479 (+10%) | 23mo | $168,000 | $114 | 51 |
| 31 Mccrea St. St | 0.37mi | 2/2.0 (-1) | 1,210 (-10%) | 7mo | $229,000 | $189 | 51 |
Match score weights: distance 35% · size 25% · config 20% · recency 20%. Top-matched comps best support the ARV.
Projected returns pro-forma
6.92% appreciation · 3.0% rent growth · sell at horizon
- IRR
- 16.2%
- Equity multiple
- 2.15×
- Total profit
- $15,712
- Equity at exit
- $33,682
- IRR
- 16.1%
- Equity multiple
- 4.45×
- Total profit
- $47,376
- Equity at exit
- $63,735
Cash invested: $13,720 (down + closing). Projections, not guarantees.
Landlord ↔ Tenant lean methodology
- Overall (STATE)
- 15 Strongly Tenant-Friendly
- State New York
- 15 Strongly Tenant-Friendly · D+10
- County
- — inherits STATE
- City
- — inherits STATE
ZIP-level market 12912
- Home prices YoY
- 2.4%
- Active inventory
- 26
- Price-to-rent
- 4.2×
Monthly cashflow live
- Estimated rent
- $983 medium interval (Pro) →
- Mortgage (P&I)
- −$257
- Tax est. 1.5%
- −$61 /mo · $735/yr
- Insurance
- −$20
- Flood insurance flood zone
- −$460 /mo · $5,525/yr
- HOA
- −$0
- Vacancy / Maint / Mgmt
- −$206
- Net cashflow
- $-23
Break-even live
UW: 25.0% down · 7.5% · 30yr · 1.5% tax · 5.0% vac · 8.0% maint · 8.0% mgmt
Financing live
Cash to close
- Down payment
- $12,250
- Closing costs
- $1,470
- Reserves months
- —
- Total cash needed
- —
Loan-product check · same deal, 3 products live
Conventional
25% down · 7.5% · 30yr
- Down + closing
- —
- Monthly P&I
- —
- Monthly cashflow
- —
- DSCR
- —
- Eligible?
- —
Personal DTI + credit; lowest rate.
DSCR
20% down · 8.5% · 30yr
- Down + closing
- —
- Monthly P&I
- —
- Monthly cashflow
- —
- DSCR
- —
- Eligible?
- —
No personal income docs; deal must DSCR.
Hard money
10% down · 12.0% · 12mo
- Down + closing
- —
- Monthly P&I
- —
- Monthly cashflow
- —
- DSCR
- —
- Eligible?
- —
Short-term bridge; refi at stabilization.
Listing history 20 events
-
2026-06-19days on market $49,000 Active 52 DOM
-
2026-06-18days on market $49,000 Active 51 DOM
-
2026-06-17days on market $49,000 Active 50 DOM
-
2026-06-16days on market $49,000 Active 49 DOM
-
2026-06-15days on market $49,000 Active 48 DOM
-
2026-06-14days on market $49,000 Active 46 DOM
-
2026-06-13days on market $49,000 Active 45 DOM
-
2026-06-10days on market $49,000 Active 43 DOM
-
2026-06-09days on market $49,000 Active 42 DOM
-
2026-06-08days on market $49,000 Active 41 DOM
-
2026-06-07days on market $49,000 Active 40 DOM
-
2026-06-05days on market $49,000 Active 37 DOM
-
2026-06-02days on market $49,000 Active 35 DOM
-
2026-06-01days on market $49,000 Active 34 DOM
-
2026-05-31days on market $49,000 Active 33 DOM
-
2026-05-30days on market $49,000 Active 32 DOM
-
2026-04-27$49,000 Active
-
2025-09-15price $39,000
-
2025-08-14price $65,000
-
1999-04-22soldstatus $19,983
ⓘ Source: listings_history table (triggers on properties + properties_extension) + one-shot
backfill from property_details.listing_events for pre-trigger history.
Climate risk First Street
- Flood 10/10 Extreme FEMA zone AE · 99% chance over 30 yrs
- Wildfire 3/10 Moderate
- Heat 2/10 Low 8 d/yr ≥91°F today · 18 d/yr by 30 yrs out
- Wind 1/10 Low 0% chance of damaging wind over 30 yrs
- Air quality 2/10 Low 1 unhealthy d/yr today · 1 by 30 yrs out
Nearby sold comps map
Loading sold comps map…
Walkable amenities ~0.75 mi
Loading nearby amenities…
Taxation est. · year 1
- Rental income
- $11,794
- − Mortgage interest
- −$2,745
- − Property taxes
- −$735
- − Insurance
- −$5,770
- − Repairs & maintenance
- −$944
- − Management
- −$944
- − Depreciation
- −$1,425
- Taxable loss
- −$768
- Est. tax savings @ 24.0%
- +$184
- After-tax cash flow
- $-87/yr
For passive investors: Depreciation is non-cash, so a rental often shows a tax loss while cash-flowing — sheltering income. Rental losses are passive: they offset passive income freely, and up to $25,000/yr can offset ordinary (W-2) income if you actively participate and your MAGI is under $100k (phasing out to $0 by $150k); unused losses carry forward. On sale, claimed depreciation is recaptured at up to 25%, and gains may owe capital-gains tax (a 1031 exchange can defer both). Figures are a year-1 estimate at your 24.0% rate — not tax advice; consult a CPA.
Schools (NCES district)
- District
- Ausable Valley Central School District
- NCES district ID
- 3616170
- Math proficiency
- 36% ▼ -14.00%
- Reading proficiency
- 51% ▲ 5.00%
- Median HH income
- $50,989
- Composite
- 37.43/100
- National rank
- #4417
- State rank
- #474 of 590 in NY
Livability — Au Sable Forks
- Score
- 54/100
- State rank
- #1143
- US rank
- #23832
Category grades
Schools grade is shown separately in the Schools card above.
Census & demographics
- Population (ZIP)
- 1,860
Population outlook (Essex County) Hauer SSP2
- Today (2025)
- 36,758 people
- By 2030
- 35,697 · -2.9%
- By 2040
- 32,697 · -11.0%
- By 2050
- 29,248 · -20.4%
- By 2075
- 22,641 · -38.4%
- By 2100
- 16,602 · -54.8%
Race, ethnicity, and origin ACS 2023
- Neighborhood character
- Predominantly White (96%)
- Race & ethnicity
- White 96% Two or more races 3% Hispanic / Latino 2%
- Common ancestry
- Lithuanian 13% Slovak 2% German 1%
- Foreign-born
- 1%
- Languages at home
- 99% English-only · Other Asian/Pacific 1%
Political lean MEDSL · Essex
- 2024 margin
- Toss-up / Even · D 50.2% · R 49.8%
- 2008→2024 swing
- -12.8pp toward R · 2008: 13.3pp · 2024: 0.5pp
- All cycles
- 2024: D+0.5 2020: D+5.0 2016: R+3.4 2012: D+15.0 2008: D+13.3
Not yet ingested
- Civics
- —
Market trends
- HPI YoY
- ▲ 6.92%
- Current HPI
- 290.3767
- Rent YoY
- —
- Metro
- —
- State GDP YoY
- ▲ 2.60%
- F500 in state
- 92
Industry mix (Fortune 500 HQ in NY)
| Industry | F500 HQs | Revenue |
|---|---|---|
| Financial Services | 10 | $950B |
|
||
| Consumer Goods | 9 | $162B |
|
||
| Insurance | 4 | $225B |
|
||
| Telecommunications | 2 | $144B |
|
||
| Pharmaceuticals | 2 | $112B |
|
||
| Media / Entertainment | 2 | $69B |
|
||
Price history
+145.2% since first listed4 events — show timeline
- 2026-04-27 Listed $49,000 ACVMLS
- 2025-09-15 Price Changed $39,000 ACVMLS
- 2025-08-14 Price Changed $65,000 ACVMLS
- 1999-04-22 Sold (Public Records) $19,983 Public Records
Property tax history
+5.5%/yrLatest (2025): $2,812 · +7.9% YoY. Source: county tax records.
Cash-flow waterfall
monthlySold comps — $/sqft
last 12 mo · ≤1 miLoading sold comps…