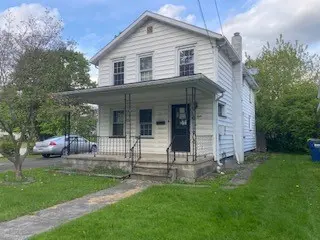
8 Athens St · Waverly, NY
Flood risk 1/10 · Minimal
- FEMA flood zone
- X (unshaded)
- Chance of flooding over 30 yrs
- 0.0%
- Est. flood insurance / yr
- $473 – $860
Fire risk 1/10 · Minimal
- Est. fire insurance / yr
- $691 – $1,283
Heat risk 3/10 · Minor
- Hot days now (above 96°F)
- 7 days/yr
- Hot days in 30 yrs
- 16 days/yr
Wind risk 2/10 · Minimal
- Chance of severe wind over 30 yrs
- 2.0%
Air-quality risk 2/10 · Minimal
- Unhealthy air days now
- 0 days/yr
- Unhealthy air days in 30 yrs
- 1 days/yr
Risk factors via First Street. Map © Google.
Why this score? — see what drove the B+ grade
The composite is a weighted blend of 9 inputs, each scored 0–100. Each bar is that input's sub-score; the figure is the points it added to the 100-point composite (weight × sub-score).
- Cash flow +30.0/30.0
- 1% rule +10.0/10.0
- DSCR +10.0/10.0
- ARV discount +7.5/15.0
- Appreciation +6.4/10.0
- Schools +3.7/10.0
- Livability +3.4/5.0
- Rent growth +2.5/5.0
- Condition / age +2.5/5.0
$46,000
🖨 Deal sheet 📄 Offer letter ✓ Due diligence
Listing remarks MLS
For statistical purposes only
Key facts
- 8,712 sq ft lot
- 2 garage spots
- Built 1890
Property features AI
Finance
- Other: Located in Village/Waverly subdivision
Exterior
- Parking: Detached garage with 2 spaces
- Utilities: Public water; Public sewer
- Home design: Single family residence; Two stories; Residential property
- Construction: Vinyl siding; Built above grade (finished area provided)
- Exterior features: Covered porch; Level lot
Interior
- Kitchen: No kitchen appliance details provided
- Bedrooms: Total rooms: 10
- Flooring: Carpet; Hardwood
- Bathrooms: 1 full bathroom; 1 half bathroom
- Heating & cooling: Baseboard heating
- Interior features: Gas water heater; Basement
- Laundry & utility: No laundry appliance details provided
Neighborhood map
What this means for you Summary
Snapshot
- This is a 3-bed/1.5-bath single-family listed at $46k.
Deal economics
- At list price, monthly cash flow is $683 ($8k/yr) — positive.
- The deal already cash-flows at list — no discount required.
- Meets the 1% rule at list price ($1k rent vs $46k).
- Cap rate 24.1% vs local median 4.6% in Waverly — top-decile yield for the area; either an underpriced asset or a hidden risk that comps aren't pricing in. Stress-test before assuming the spread holds.
Location & tenants
- Location reads 67/100 on livability (#569 in NY) — a middle-class / working-renter tenant base. Strengths: cost of living A+, housing A+, health & safety A; Watch: amenities F, commute F, employment F.
- Waverly Central School District (town): math 41% / reading 46% proficiency, ranked #480 of 590 in NY (top 81%) — families likely to look elsewhere, expect single-tenant / working-renter base with shorter leases.
- Market conditions: 53 active listings in the ZIP; 139 units permitted in Tioga County in 2024 (65 in 5+ unit buildings).
Forward outlook
- In year one you build about $2k of equity ($318 loan paydown + $1k appreciation (2.8% local appreciation)).
- Tioga County population projected at -27% by 2050 — secular population decline; favor cash flow + early exit over multi-decade hold.
- At projected returns (2.8% appreciation + 3.0% rent growth), your $13k cash investment doubles in ~2 years — after that, you're playing with house money.
Negotiation context
- Only 11 days on market — expect competitive offers; lowballing is unlikely to land.
- 5 sale attempts since 4y ago with the ask held roughly flat each time — persistent listings suggest the price (not the market) is what's stuck; bring a comps-based counter.
Risks & watch-outs
- Watch-outs: built in 1890 — expect roof / HVAC / electrical / plumbing capex.
Questions for the listing agent
- Built in 1890 — when were the roof, HVAC, electrical panel, plumbing, and water heater last replaced?
- Is there a deadline driving the sale (1031 exchange, divorce, estate, relocation)? That informs how much negotiation room exists.
- What's the average days-on-market for RENTAL listings here right now (not sales)? A rising rental-DOM trend means longer vacancies and softer asking-rent achievability than the comps imply.
- What's the recent tenant-quality profile in this submarket — average credit score on applications, eviction rate, late-payment / NSF rate, and stable-employment percentage? A property-management company in the area should have these aggregated.
- How much new for-sale + rental construction is in the pipeline within 1–3 miles? Heavy new supply typically softens prices + rents 12–24 months out; constrained supply supports both.
Investment metrics
- 1% rule
- 2.75% ✓
- Cap rate
- 24.12%
- Cash-on-cash
- 63.66%
- DSCR
- 3.83
- GRM
- 3.0
CMA / ARV
- ARV (median comp)
- $173,006
- List price
- $46,000
- Delta
- -73.41%
- Verdict
- UNDERPRICED
- Comps
- 20 within 1.0 mi
Show comp detail 12 sales within ~0.75 mi
| Address | Dist | Beds/Ba | Sqft | Sold | Price | $/sf | Match |
|---|---|---|---|---|---|---|---|
| 12 Lincoln Ave | 0.05mi | 3/2.0 | 1,396 (-1%) | 7mo | $39,000 | $28 | 89 |
| 429 Spaulding St | 0.32mi | 3/1.5 | 1,464 (+4%) | 5mo | $164,300 | $112 | 74 |
| 33 Cadwell Ave | 0.34mi | 3/1.0 | 1,376 (-2%) | 9mo | $175,000 | $127 | 71 |
| 30 & 32 Spring St | 0.48mi | 3/1.5 | 1,410 (+0%) | 12mo | $134,600 | $95 | 68 |
| 417 Loder Street St | 0.29mi | 3/1.0 | 1,312 (-7%) | 10mo | $95,000 | $72 | 65 |
| 13 Ithaca St | 0.50mi | 3/2.0 | 1,344 (-4%) | 8mo | $181,000 | $135 | 61 |
| 121 Park Pl | 0.30mi | 4/2.0 (+1) | 1,296 (-8%) | 8mo | $185,000 | $143 | 59 |
| 126 Chemung St | 0.36mi | 2/2.0 (-1) | 1,564 (+11%) | 1mo | $33,500 | $21 | 57 |
| 534 Waverly St St | 0.39mi | 4/2.0 (+1) | 1,520 (+8%) | 7mo | $210,000 | $138 | 55 |
| 47 Pine St | 0.44mi | 3/1.5 | 1,212 (-14%) | 10mo | $215,000 | $177 | 48 |
| 88 Spring St | 0.55mi | 4/2.0 (+1) | 1,520 (+8%) | 12mo | $257,000 | $169 | 44 |
| 97 Spring St | 0.63mi | 3/1.5 | 1,250 (-11%) | 14mo | $179,000 | $143 | 41 |
Match score weights: distance 35% · size 25% · config 20% · recency 20%. Top-matched comps best support the ARV.
Projected returns pro-forma
2.78% appreciation · 3.0% rent growth · sell at horizon
- IRR
- 68.2%
- Equity multiple
- 4.77×
- Total profit
- $48,539
- Equity at exit
- $20,112
- IRR
- 67.9%
- Equity multiple
- 9.74×
- Total profit
- $112,516
- Equity at exit
- $30,557
Cash invested: $12,880 (down + closing). Projections, not guarantees.
Landlord ↔ Tenant lean methodology
- Overall (STATE)
- 15 Strongly Tenant-Friendly
- State New York
- 15 Strongly Tenant-Friendly · D+10
- County
- — inherits STATE
- City
- — inherits STATE
ZIP-level market 14892
- Home prices YoY
- 1.2%
- Active inventory
- 53
- Price-to-rent
- 3.0×
Monthly cashflow live
- Estimated rent
- $1,267 medium interval (Pro) →
- Mortgage (P&I)
- −$241
- Tax est. 1.5%
- −$58 /mo · $690/yr
- Insurance
- −$19
- HOA
- −$0
- Vacancy / Maint / Mgmt
- −$266
- Net cashflow
- $683
Break-even live
UW: 25.0% down · 7.5% · 30yr · 1.5% tax · 5.0% vac · 8.0% maint · 8.0% mgmt
Financing live
Cash to close
- Down payment
- $11,500
- Closing costs
- $1,380
- Reserves months
- —
- Total cash needed
- —
Loan-product check · same deal, 3 products live
Conventional
25% down · 7.5% · 30yr
- Down + closing
- —
- Monthly P&I
- —
- Monthly cashflow
- —
- DSCR
- —
- Eligible?
- —
Personal DTI + credit; lowest rate.
DSCR
20% down · 8.5% · 30yr
- Down + closing
- —
- Monthly P&I
- —
- Monthly cashflow
- —
- DSCR
- —
- Eligible?
- —
No personal income docs; deal must DSCR.
Hard money
10% down · 12.0% · 12mo
- Down + closing
- —
- Monthly P&I
- —
- Monthly cashflow
- —
- DSCR
- —
- Eligible?
- —
Short-term bridge; refi at stabilization.
Listing history 13 events
-
2026-05-15$46,000 Active 406-char remark
-
2023-09-21price $149,000
-
2023-08-27status Active
-
2023-08-08historical
-
2023-07-28$153,900 Active
-
2022-08-25soldstatus $138,298
-
2022-07-15soldstatus $138,298
Show marketing remark (29 chars)
For statistical purposes only
-
2022-07-15soldstatus $138,298
Show marketing remark (29 chars)
For statistical purposes only
-
2022-07-15$129,500
Show marketing remark (29 chars)
For statistical purposes only
-
2022-05-05$129,500
-
2011-07-21soldstatus $89,900
-
2004-08-31soldstatus $63,000
-
2001-08-22soldstatus $55,000
ⓘ Source: listings_history table (triggers on properties + properties_extension) + one-shot
backfill from property_details.listing_events for pre-trigger history.
Climate risk First Street
- Flood 1/10 Low FEMA zone X (unshaded) · 0% chance over 30 yrs
- Wildfire 1/10 Low
- Heat 3/10 Moderate 7 d/yr ≥96°F today · 16 d/yr by 30 yrs out
- Wind 2/10 Low 2% chance of damaging wind over 30 yrs
- Air quality 2/10 Low 0 unhealthy d/yr today · 1 by 30 yrs out
Nearby sold comps map
Loading sold comps map…
Walkable amenities ~0.75 mi
Loading nearby amenities…
Taxation est. · year 1
- Rental income
- $15,207
- − Mortgage interest
- −$2,577
- − Property taxes
- −$690
- − Insurance
- −$230
- − Repairs & maintenance
- −$1,217
- − Management
- −$1,217
- − Depreciation
- −$1,338
- Taxable income
- $7,939
- Est. tax owed @ 24.0%
- −$1,905
- After-tax cash flow
- $6,293/yr
For passive investors: Depreciation is non-cash, so a rental often shows a tax loss while cash-flowing — sheltering income. Rental losses are passive: they offset passive income freely, and up to $25,000/yr can offset ordinary (W-2) income if you actively participate and your MAGI is under $100k (phasing out to $0 by $150k); unused losses carry forward. On sale, claimed depreciation is recaptured at up to 25%, and gains may owe capital-gains tax (a 1031 exchange can defer both). Figures are a year-1 estimate at your 24.0% rate — not tax advice; consult a CPA.
Schools (NCES district)
- District
- Waverly Central School District
- NCES district ID
- 3630270
- Math proficiency
- 41% ▼ -4.00%
- Reading proficiency
- 46% ▲ 8.00%
- Median HH income
- $44,935
- Composite
- 36.9/100
- National rank
- #4544
- State rank
- #480 of 590 in NY
Livability — Waverly
- Score
- 67/100
- State rank
- #569
- US rank
- #10246
Category grades
Schools grade is shown separately in the Schools card above.
Census & demographics
- Census place
- Waverly, NY
- Population (ZIP)
- 7,531
Population outlook (Tioga County) Hauer SSP2
- Today (2025)
- 45,155 people
- By 2030
- 42,801 · -5.2%
- By 2040
- 37,960 · -15.9%
- By 2050
- 33,071 · -26.8%
- By 2075
- 24,144 · -46.5%
- By 2100
- 16,545 · -63.4%
Race, ethnicity, and origin ACS 2023
- Neighborhood character
- Predominantly White (93%)
- Race & ethnicity
- White 93% Hispanic / Latino 2% Two or more races 2% Black 1% Asian 1%
- Common ancestry
- Iranian 3% Romanian 3% Italian 2%
- Foreign-born
- 2%
- Languages at home
- 98% English-only · German/W. Germanic 1% Tagalog/Filipino 1%
Political lean MEDSL · Tioga
- 2024 margin
- Strong R (+22.9) · D 38.6% · R 61.4%
- 2008→2024 swing
- -12.7pp toward R · 2008: -10.2pp · 2024: -22.9pp
- All cycles
- 2024: R+22.9 2020: R+20.6 2016: R+27.6 2012: R+15.1 2008: R+10.2
Not yet ingested
- Civics
- —
Market trends
- HPI YoY
- ▲ 2.78%
- Current HPI
- 236.7714
- Rent YoY
- —
- Metro
- —
- State GDP YoY
- ▲ 2.60%
- F500 in state
- 92
Industry mix (Fortune 500 HQ in NY)
| Industry | F500 HQs | Revenue |
|---|---|---|
| Financial Services | 10 | $950B |
|
||
| Consumer Goods | 9 | $162B |
|
||
| Insurance | 4 | $225B |
|
||
| Telecommunications | 2 | $144B |
|
||
| Pharmaceuticals | 2 | $112B |
|
||
| Media / Entertainment | 2 | $69B |
|
||
Price history
-16.4% since first listed14 events — show timeline
- 2026-05-26 Pending — GBAOR
- 2026-05-15 Listed $46,000 GBAOR
- 2023-09-21 Price Changed $149,000 NMPA
- 2023-08-27 Relisted — NMPA
- 2023-08-08 Delisted — NMPA
- 2023-07-28 Listed $153,900 NMPA
- 2022-08-25 Sold (Public Records) $138,298 Public Records
- 2022-07-15 Listed $129,500 GBAOR
- 2022-07-15 Sold (MLS) $138,298 NMPA
- 2022-07-15 Sold (MLS) $138,298 GBAOR
- 2022-05-05 Listed $129,500 NMPA
- 2011-07-21 Sold (Public Records) $89,900 Public Records
- 2004-08-31 Sold (Public Records) $63,000 Public Records
- 2001-08-22 Sold (Public Records) $55,000 Public Records
Property tax history
+9.6%/yrLatest (2025): $4,895 · +4.5% YoY. Source: county tax records.
Cash-flow waterfall
monthlySold comps — $/sqft
last 12 mo · ≤1 miLoading sold comps…