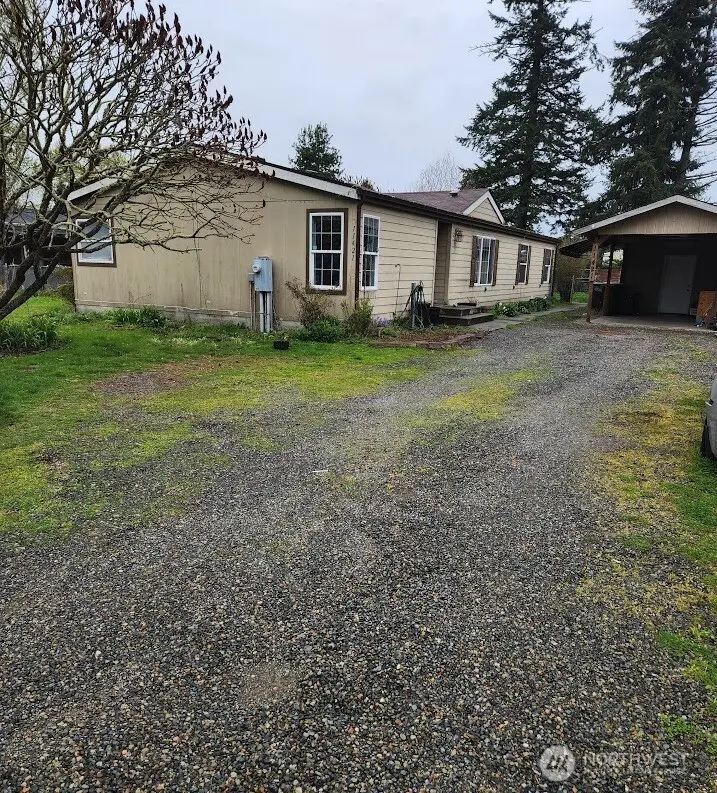
11421 246th Avenue Ct E · Prairie Heights, WA
Flood risk 1/10 · Minimal
- FEMA flood zone
- X (unshaded)
- Chance of flooding over 30 yrs
- 0.0%
- Est. flood insurance / yr
- $507 – $1,088
Fire risk 3/10 · Minor
- Est. fire insurance / yr
- $604 – $1,122
Heat risk 2/10 · Minimal
- Hot days now (above 87°F)
- 7 days/yr
- Hot days in 30 yrs
- 15 days/yr
Wind risk 1/10 · Minimal
- Chance of severe wind over 30 yrs
- —
Air-quality risk 6/10 · Moderate
- Unhealthy air days now
- 10 days/yr
- Unhealthy air days in 30 yrs
- 12 days/yr
Risk factors via First Street. Map © Google.
Why this score? — see what drove the D+ grade
The composite is a weighted blend of 9 inputs, each scored 0–100. Each bar is that input's sub-score; the figure is the points it added to the 100-point composite (weight × sub-score).
- ARV discount +15.0/15.0
- Cash flow +11.3/30.0
- Schools +5.7/10.0
- Livability +4.3/5.0
- DSCR +3.3/10.0
- 1% rule +3.0/10.0
- Rent growth +2.5/5.0
- Condition / age +2.5/5.0
- Appreciation +0.0/10.0
$400,000
🖨 Deal sheet (PDF) 📄 Offer letter ✓ Due diligence
Listing remarks
Handyman special! Don’t miss this sweat equity opportunity! Sold As Is—bring your vision and build instant equity. This generously sized 3-bedroom, 2-bath home offers an open-concept layout with great flow and functionality. The primary suite is spacious and includes a relaxing soaking tub and private access through French doors. A bonus room provides flexibility for a home office, fitness space, or additional living area. Natural light pours in through vaulted ceilings and skylights, while a Trane heat pump system keeps the home comfortable year-round. Major improvements completed in 2023 include a new roof and new gutters. Situated on a quiet cul-de-sac with a large backyard f
Key facts
- Soaking tub
- Primary suite
- Bonus room
Tags
Neighborhood map
What this means for you Summary
Snapshot
- This is a 3-bed/2.0-bath manufactured listed at $400k.
Deal economics
- At list price, monthly cash flow is $-146 ($-2k/yr) — negative.
- To cash-flow at today's rent, offer at most $374k (6.4% below list).
- To meet the 1% rule (rent ≥ 1% of price), the offer needs to be $319k (20.3% below list).
- Recommended offer: $319k (20.3% below list) — sets the bar for 1% rule.
- Cap rate 5.9% vs local median 2.5% in Prairie Heights — top-decile yield for the area; either an underpriced asset or a hidden risk that comps aren't pricing in. Stress-test before assuming the spread holds.
Location & tenants
- Location reads 86/100 on livability (#19 in WA, #399 nationally) — a professional / high-income tenant draw. Strengths: employment A+, housing A+, health & safety A+; Watch: cost of living F.
- White River School District (suburban): math 57% / reading 68% proficiency, ranked #35 of 291 in WA (top 12%) — acceptable for families but not a draw, mixed tenant base, ~2y average lease.
- Zoned schools: Elk Ridge Elementary (595 students, 30% FRL); Glacier Middle School (970 students, 35% FRL); White River High School (1,263 students, 32% FRL).
- Market conditions: 239 active listings in the ZIP; 3,209 units permitted in Pierce County in 2024 (1,269 in 5+ unit buildings).
Forward outlook
- Local home prices are declining (-3.0%/yr); year-one equity from $3k of loan paydown is wiped out by about $12k of value loss. Plan a longer hold.
- Pierce County population projected at +26% by 2050 — long-run rental-demand tailwind backs the buy-and-hold thesis.
Negotiation context
- Only 10 days on market — expect competitive offers; lowballing is unlikely to land.
- 2 sale attempts with the ask held roughly flat each time — persistent listings suggest the price (not the market) is what's stuck; bring a comps-based counter.
- Current owner paid $55k; list at $400k implies a 627% gain — meaningful room to come down on a strong offer.
Questions for the listing agent
- What do current leases actually rent for vs. the listed asking? Can we see a recent rent roll and the last 12 months of T-12 income?
- What does the HOA fee cover, when was the last increase, and are there any pending special assessments or reserve-fund shortfalls?
- Is there a deadline driving the sale (1031 exchange, divorce, estate, relocation)? That informs how much negotiation room exists.
- Schools are D-rated, which usually means shorter tenancies and higher turnover. Who's the typical renter profile here, and what's been the actual vacancy rate?
- The area grade is low — what's the realistic commute time and amenity access for the typical tenant pool here? Any planned neighborhood developments (good or bad) we should know about?
- What's the average days-on-market for RENTAL listings here right now (not sales)? A rising rental-DOM trend means longer vacancies and softer asking-rent achievability than the comps imply.
- What's the recent tenant-quality profile in this submarket — average credit score on applications, eviction rate, late-payment / NSF rate, and stable-employment percentage? A property-management company in the area should have these aggregated.
- How much new for-sale + rental construction is in the pipeline within 1–3 miles? Heavy new supply typically softens prices + rents 12–24 months out; constrained supply supports both.
Investment metrics
- 1% rule
- 0.80% ✗
- Cap rate
- 5.86%
- Cash-on-cash
- -1.56%
- DSCR
- 0.93
- GRM
- 10.5
CMA / ARV
- ARV (on-the-fly)
- $533,400
- Comps found
- 4
Show comp detail 4 sales within ~0.75 mi
| Address | Dist | Beds/Ba | Sqft | Sold | Price | $/sf | Match |
|---|---|---|---|---|---|---|---|
| 11421 246th Avenue Ct E | 0.00mi | 3/2.0 | 1,778 (0%) | 0mo | $410,000 | $231 | 100 |
| 11916 243rd Avenue Ct E | 0.40mi | 3/2.0 | 1,600 (-10%) | 2mo | $480,000 | $300 | 63 |
| 11907 241st Ave Ct E | 0.46mi | 4/2.0 (+1) | 1,620 (-9%) | 21mo | $490,000 | $302 | 42 |
| 11809 237th Avenue Ct E | 0.65mi | 3/2.0 | 1,512 (-15%) | 22mo | $435,000 | $288 | 27 |
Match score weights: distance 35% · size 25% · config 20% · recency 20%. Top-matched comps best support the ARV.
Projected returns pro-forma
-3.0% appreciation · 3.0% rent growth · sell at horizon
- IRR
- -18.9%
- Equity multiple
- 0.34×
- Total profit
- $-74,111
- Equity at exit
- $59,641
- IRR
- -11.4%
- Equity multiple
- 0.32×
- Total profit
- $-76,538
- Equity at exit
- $34,585
Cash invested: $112,000 (down + closing). Projections, not guarantees.
Landlord ↔ Tenant lean methodology
- Overall (STATE)
- 28 Tenant-Leaning
- State Washington
- 28 Tenant-Leaning · D+8
- County
- — inherits STATE
- City
- — inherits STATE
ZIP-level market 98321
- Active inventory
- 239
- Price-to-rent
- 10.5×
Monthly cashflow live
- Estimated rent
- $3,189 medium interval (Pro) →
- Mortgage (P&I)
- −$2,098
- Tax from tax record
- −$372 /mo · $4,469/yr
- Insurance
- −$167
- HOA
- −$28
- Vacancy / Maint / Mgmt
- −$670
- Net cashflow
- $-146
Break-even live
Sensitivity live
| Price | -10% $81 | -5% $-32 | +0% $-146 | +5% $-259 | +10% $-372 |
|---|---|---|---|---|---|
| Rent | -10% $-398 | -5% $-272 | +0% $-146 | +5% $-20 | +10% $106 |
| Rate | -1.0pp $56 | -0.5pp $-44 | base $-146 | +0.5pp $-249 | +1.0pp $-355 |
UW: 25.0% down · 7.5% · 30yr · 1.5% tax · 5.0% vac · 8.0% maint · 8.0% mgmt
Financing live
Cash to close
- Down payment
- $100,000
- Closing costs
- $12,000
- Reserves months
- —
- Total cash needed
- —
Loan-product check · same deal, 3 products live
Conventional
25% down · 7.5% · 30yr
- Down + closing
- —
- Monthly P&I
- —
- Monthly cashflow
- —
- DSCR
- —
- Eligible?
- —
Personal DTI + credit; lowest rate.
DSCR
20% down · 8.5% · 30yr
- Down + closing
- —
- Monthly P&I
- —
- Monthly cashflow
- —
- DSCR
- —
- Eligible?
- —
No personal income docs; deal must DSCR.
Hard money
10% down · 12.0% · 12mo
- Down + closing
- —
- Monthly P&I
- —
- Monthly cashflow
- —
- DSCR
- —
- Eligible?
- —
Short-term bridge; refi at stabilization.
HOA detail
- Monthly dues
- $28 · $336/yr
Listing history 5 events
-
2026-04-27status Pending
-
2026-04-23status Active
-
2026-04-20status Pending
-
2026-04-14$400,000 Active
-
1998-08-07soldstatus $55,000
ⓘ Source: listings_history table (triggers on properties + properties_extension) + one-shot
backfill from property_details.listing_events for pre-trigger history.
Tax reassessment forecast WA · Resets to sale price
- Current annual tax
- $4,469 · $372/mo
- Projected year-2 tax
- $4,469 · $372/mo
- Expected delta
- $0/yr ($0/mo · 0.0%)
ⓘ Screening estimate from a state-policy table — verify with the county assessor before closing.
Climate risk First Street
- Flood 1/10 Low FEMA zone X (unshaded) · 0% chance over 30 yrs
- Wildfire 3/10 Moderate
- Heat 2/10 Low 7 d/yr ≥87°F today · 15 d/yr by 30 yrs out
- Wind 1/10 Low
- Air quality 6/10 Major 10 unhealthy d/yr today · 12 by 30 yrs out
Nearby sold comps map
Loading sold comps map…
Walkable amenities ~0.75 mi
Loading nearby amenities…
Taxation est. · year 1
- Rental income
- $38,264
- − Mortgage interest
- −$22,406
- − Property taxes
- −$4,469
- − Insurance
- −$2,000
- − Repairs & maintenance
- −$3,061
- − Management
- −$3,061
- − HOA
- −$336
- − Depreciation
- −$11,636
- Taxable loss
- −$8,706
- Est. tax savings @ 24.0%
- +$2,089
- After-tax cash flow
- $341/yr
For passive investors: Depreciation is non-cash, so a rental often shows a tax loss while cash-flowing — sheltering income. Rental losses are passive: they offset passive income freely, and up to $25,000/yr can offset ordinary (W-2) income if you actively participate and your MAGI is under $100k (phasing out to $0 by $150k); unused losses carry forward. On sale, claimed depreciation is recaptured at up to 25%, and gains may owe capital-gains tax (a 1031 exchange can defer both). Figures are a year-1 estimate at your 24.0% rate — not tax advice; consult a CPA.
Schools (NCES district)
- District
- White River School District
- NCES district ID
- 5309780
- Math proficiency
- 57% ▲ 3.00%
- Reading proficiency
- 68% ▲ 6.00%
- Median HH income
- $71,369
- Composite
- 56.68/100
- National rank
- #2423
- State rank
- #35 of 291 in WA
Livability — Prairie Heights
- Score
- 86/100
- State rank
- #19
- US rank
- #399
Category grades
Schools grade is shown separately in the Schools card above.
Census & demographics
- Census place
- Prairie Heights, WA
- Population (ZIP)
- 17,601
Population outlook (Pierce County) Hauer SSP2
- Today (2025)
- 956,648 people
- By 2030
- 1,010,862 · +5.7%
- By 2040
- 1,113,170 · +16.4%
- By 2050
- 1,206,524 · +26.1%
- By 2075
- 1,436,425 · +50.2%
- By 2100
- 1,563,654 · +63.5%
Race, ethnicity, and origin ACS 2023
- Neighborhood character
- Predominantly White (87%)
- Race & ethnicity
- White 87% Hispanic / Latino 6% Two or more races 5% Native American 2% Asian 1%
- Hispanic origin (detail)
- Mexican 3% Puerto Rican 2%
- Common ancestry
- Portuguese 7% Italian 4% Lithuanian 3%
- Foreign-born
- 2% · China, Canada
- Languages at home
- 97% English-only · Spanish 1% Other Asian/Pacific 1%
Political lean MEDSL · Pierce
- 2024 margin
- D (+10.8) · D 53.9% · R 43.1% · Other 3.0%
- 2008→2024 swing
- -1.4pp toward R · 2008: 12.2pp · 2024: 10.8pp
- All cycles
- 2024: D+10.8 2020: D+11.2 2016: D+7.5 2012: D+11.0 2008: D+12.2
Not yet ingested
- Civics
- —
Market trends
- HPI YoY
- ▼ -206.67%
- Current HPI
- 310.6568
- Rent YoY
- —
- Metro
- —
- State GDP YoY
- ▲ 4.65%
- F500 in state
- 22
Industry mix (Fortune 500 HQ in WA)
| Industry | F500 HQs | Revenue |
|---|---|---|
| Retail | 2 | $269B |
|
||
| Technology / Retail | 1 | $638B |
|
||
| Technology | 1 | $245B |
|
||
| Telecommunications | 1 | $38B |
|
||
| Food / Beverage | 1 | $36B |
|
||
| Automotive / Trucks | 1 | $34B |
|
||
Price history
+627.3% since first listed5 events — show timeline
- 2026-04-27 Pending — NWMLS as Distributed by MLS Grid
- 2026-04-23 Relisted — NWMLS as Distributed by MLS Grid
- 2026-04-20 Pending — NWMLS as Distributed by MLS Grid
- 2026-04-14 Listed $400,000 NWMLS as Distributed by MLS Grid
- 1998-08-07 Sold (Public Records) $55,000 Public Records
Property tax history
+4.1%/yrLatest (2026): $4,469 · -0.8% YoY. Source: county tax records.
Cash-flow waterfall
monthlySold comps — $/sqft
last 12 mo · ≤1 miLoading sold comps…