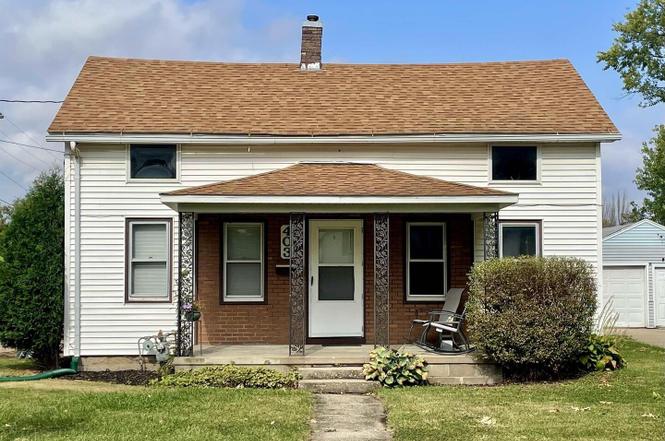
403 E Chestnut St · Geneseo, IL
Flood risk 1/10 · Minimal
- FEMA flood zone
- X (unshaded)
- Chance of flooding over 30 yrs
- 0.0%
- Est. flood insurance / yr
- $473 – $860
Fire risk 1/10 · Minimal
- Est. fire insurance / yr
- $804 – $1,492
Heat risk 3/10 · Minor
- Hot days now (above 104°F)
- 7 days/yr
- Hot days in 30 yrs
- 17 days/yr
Wind risk 2/10 · Minimal
- Chance of severe wind over 30 yrs
- —
Air-quality risk 3/10 · Minor
- Unhealthy air days now
- 2 days/yr
- Unhealthy air days in 30 yrs
- 3 days/yr
Risk factors via First Street. Map © Google.
Why this score? — see what drove the B- grade
The composite is a weighted blend of 9 inputs, each scored 0–100. Each bar is that input's sub-score; the figure is the points it added to the 100-point composite (weight × sub-score).
- Cash flow +30.0/30.0
- 1% rule +10.0/10.0
- DSCR +10.0/10.0
- ARV discount +7.5/15.0
- Livability +4.2/5.0
- Rent growth +2.5/5.0
- Condition / age +2.5/5.0
- Schools +2.3/10.0
- Appreciation +0.0/10.0
$110,000
🖨 Deal sheet 📄 Offer letter ✓ Due diligence
Listing remarks MLS
Come on over and sit a spell on the porch! You'll love the great location of this charming 3 bedroom home! Eat-in kitchen is a great area to entertain and while cooking. Hardwoods on the main level. Bonus room upstairs could be used as an office or studio. Seller is motivated! Make your offer today! Appliances stay, but not warranted. Buyer and buyer's agent to verify measurements.
Key facts
- Separate dining room
- Eat in kitchen
- New lvt flooring
Tags
Property features AI
Finance
- Other: Homeowner tax exemption
Exterior
- Parking: No garage; On-site parking lot
- Utilities: Public water; Public sewer
- Home design: Detached single-family home; 1.5-story
- Construction: Vinyl siding; Built over 100 years ago; Property built before 1978
- Exterior features: Corner lot; Level lot; Lot dimensions approximately 74.45 x 104.44
Interior
- Kitchen: Range
- Bedrooms: 3 bedrooms
- Bathrooms: 1 full bathroom
- Heating & cooling: Forced air heating; Natural gas
- Interior features: Separate dining room; Unfinished basement with crawl space (approx. 600 finished/unfinished square feet)
- Laundry & utility: Washer; Dryer
Neighborhood map
What this means for you Summary
Snapshot
- This is a 3-bed/1.0-bath other listed at $110k.
Deal economics
- At list price, monthly cash flow is $935 ($11k/yr) — positive.
- The deal already cash-flows at list — no discount required.
- Meets the 1% rule at list price ($2k rent vs $110k).
- Recommended offer: $107k (3.0% below list) — sets the bar for market timing.
- Cap rate 16.5% vs local median 6.9% in Geneseo — top-decile yield for the area; either an underpriced asset or a hidden risk that comps aren't pricing in. Stress-test before assuming the spread holds.
Location & tenants
- Location reads 83/100 on livability (#45 in IL, #907 nationally) — a professional / high-income tenant draw. Strengths: crime A+, cost of living A+, housing A+; Watch: commute F.
- Geneseo CUSD 228 (town): math 23% / reading 26% proficiency, ranked #297 of 620 in IL (top 48%) — low school quality limits family demand, transient renter base, plan for 1-2y turnover; only 18% free/reduced lunch — higher-income household profile.
- Zoned schools: Millikin Elem School (math 27% / reading 27%, grade F, #749 of 2,056 statewide, top 40%, 368 students, 0% FRL); Geneseo Middle School (math 15% / reading 20%, grade F, #450 of 665 statewide, top 69%, 591 students, 0% FRL); Geneseo High School (math 32% / reading 42%, grade F, #107 of 693 statewide, top 17%, 809 students, 0% FRL) — zoned schools average 0% FRL vs 18% district-wide (18 pts lower); this property's tenant base skews higher-income than the district average.
- Market conditions: 73 active listings in the ZIP; 32 units permitted in Henry County in 2024 (0 in 5+ unit buildings).
Forward outlook
- Local home prices are declining (-3.0%/yr); year-one equity from $761 of loan paydown is wiped out by about $3k of value loss. Plan a longer hold.
- Henry County population projected at -16% by 2050 — secular population decline; favor cash flow + early exit over multi-decade hold.
- At projected returns (-3.0% appreciation + 3.0% rent growth), your $31k cash investment doubles in ~4 years — after that, you're playing with house money.
Negotiation context
- It's been on market 37 days — a 3% lower offer ($107k) is reasonable based on typical stale-listing flexibility.
- 6 sale attempts since 3y ago with the ask held roughly flat each time — persistent listings suggest the price (not the market) is what's stuck; bring a comps-based counter.
Risks & watch-outs
- Watch-outs: built in 1907 — expect roof / HVAC / electrical / plumbing capex.
Questions for the listing agent
- It's been on market 37 days. Have you received any prior offers? Is the seller open to a 3% concession, seller financing, or rate buy-down credit?
- Built in 1907 — when were the roof, HVAC, electrical panel, plumbing, and water heater last replaced?
- Is there a deadline driving the sale (1031 exchange, divorce, estate, relocation)? That informs how much negotiation room exists.
- Schools are D-rated, which usually means shorter tenancies and higher turnover. Who's the typical renter profile here, and what's been the actual vacancy rate?
- What's the average days-on-market for RENTAL listings here right now (not sales)? A rising rental-DOM trend means longer vacancies and softer asking-rent achievability than the comps imply.
- What's the recent tenant-quality profile in this submarket — average credit score on applications, eviction rate, late-payment / NSF rate, and stable-employment percentage? A property-management company in the area should have these aggregated.
- How much new for-sale + rental construction is in the pipeline within 1–3 miles? Heavy new supply typically softens prices + rents 12–24 months out; constrained supply supports both.
Investment metrics
- 1% rule
- 1.94% ✓
- Cap rate
- 16.50%
- Cash-on-cash
- 36.44%
- DSCR
- 2.62
- GRM
- 4.3
CMA / ARV
No comps found within radius.
Projected returns pro-forma
-3.0% appreciation · 3.0% rent growth · sell at horizon
- IRR
- 32.2%
- Equity multiple
- 2.36×
- Total profit
- $41,768
- Equity at exit
- $16,401
- IRR
- 39.3%
- Equity multiple
- 4.67×
- Total profit
- $113,177
- Equity at exit
- $9,511
Cash invested: $30,800 (down + closing). Projections, not guarantees.
Landlord ↔ Tenant lean methodology
- Overall (STATE)
- 43 Moderately Tenant-Leaning
- State Illinois
- 43 Moderately Tenant-Leaning · D+7
- County
- — inherits STATE
- City
- — inherits STATE
ZIP-level market 61254
- Home prices YoY
- -32.0%
- Active inventory
- 73
- Price-to-rent
- 4.3×
Monthly cashflow live
- Estimated rent
- $2,133 medium interval (Pro) →
- Mortgage (P&I)
- −$577
- Tax from tax record
- −$127 /mo · $1,521/yr
- Insurance
- −$46
- HOA
- −$0
- Vacancy / Maint / Mgmt
- −$448
- Net cashflow
- $935
Break-even live
UW: 25.0% down · 7.5% · 30yr · 1.5% tax · 5.0% vac · 8.0% maint · 8.0% mgmt
Financing live
Cash to close
- Down payment
- $27,500
- Closing costs
- $3,300
- Reserves months
- —
- Total cash needed
- —
Loan-product check · same deal, 3 products live
Conventional
25% down · 7.5% · 30yr
- Down + closing
- —
- Monthly P&I
- —
- Monthly cashflow
- —
- DSCR
- —
- Eligible?
- —
Personal DTI + credit; lowest rate.
DSCR
20% down · 8.5% · 30yr
- Down + closing
- —
- Monthly P&I
- —
- Monthly cashflow
- —
- DSCR
- —
- Eligible?
- —
No personal income docs; deal must DSCR.
Hard money
10% down · 12.0% · 12mo
- Down + closing
- —
- Monthly P&I
- —
- Monthly cashflow
- —
- DSCR
- —
- Eligible?
- —
Short-term bridge; refi at stabilization.
Listing history 19 events
-
2026-05-22$110,000 Active
-
2026-03-04soldstatus $101,000
-
2026-02-27soldstatus Closed
-
2026-01-26status Pending
-
2026-01-16status Active
-
2026-01-14historical
-
2026-01-08status Active
-
2026-01-06historical
-
2026-01-05historical
-
2025-11-21price
-
2025-10-10Active
-
2023-07-17soldstatus $95,000
-
2023-07-07soldstatus $95,000 388-char remark
Show marketing remark (388 chars)
Come on over and sit a spell on the porch! You'll love the great location of this charming 3 bedroom home! Eat-in kitchen is a great area to entertain and while cooking. Hardwoods on the main level. Bonus room upstairs could be used as an office or studio. Seller is motivated! Make your offer today! Appliances stay, but not warranted. Buyer and buyer's agent to verify measurements.
-
2023-07-07soldstatus $95,000 Closed 388-char remark
Show marketing remark (388 chars)
Come on over and sit a spell on the porch! You'll love the great location of this charming 3 bedroom home! Eat-in kitchen is a great area to entertain and while cooking. Hardwoods on the main level. Bonus room upstairs could be used as an office or studio. Seller is motivated! Make your offer today! Appliances stay, but not warranted. Buyer and buyer's agent to verify measurements.
-
2023-06-04historical Under Contract 388-char remark
Show marketing remark (388 chars)
Come on over and sit a spell on the porch! You'll love the great location of this charming 3 bedroom home! Eat-in kitchen is a great area to entertain and while cooking. Hardwoods on the main level. Bonus room upstairs could be used as an office or studio. Seller is motivated! Make your offer today! Appliances stay, but not warranted. Buyer and buyer's agent to verify measurements.
-
2023-06-03$95,000 388-char remark
Show marketing remark (388 chars)
Come on over and sit a spell on the porch! You'll love the great location of this charming 3 bedroom home! Eat-in kitchen is a great area to entertain and while cooking. Hardwoods on the main level. Bonus room upstairs could be used as an office or studio. Seller is motivated! Make your offer today! Appliances stay, but not warranted. Buyer and buyer's agent to verify measurements.
-
2023-06-03$95,000 Active 388-char remark
Show marketing remark (388 chars)
Come on over and sit a spell on the porch! You'll love the great location of this charming 3 bedroom home! Eat-in kitchen is a great area to entertain and while cooking. Hardwoods on the main level. Bonus room upstairs could be used as an office or studio. Seller is motivated! Make your offer today! Appliances stay, but not warranted. Buyer and buyer's agent to verify measurements.
-
2021-08-06historical
-
2020-09-16soldstatus $74,667
ⓘ Source: listings_history table (triggers on properties + properties_extension) + one-shot
backfill from property_details.listing_events for pre-trigger history.
Tax reassessment forecast IL · Partial reset (capped growth)
- Current annual tax
- $1,521 · $127/mo
- Projected year-2 tax
- $2,009 · $167/mo
- Expected delta
- +$488/yr (+$41/mo · 32.1%)
ⓘ Screening estimate from a state-policy table — verify with the county assessor before closing.
Climate risk First Street
- Flood 1/10 Low FEMA zone X (unshaded) · 0% chance over 30 yrs
- Wildfire 1/10 Low
- Heat 3/10 Moderate 7 d/yr ≥104°F today · 17 d/yr by 30 yrs out
- Wind 2/10 Low
- Air quality 3/10 Moderate 2 unhealthy d/yr today · 3 by 30 yrs out
Nearby sold comps map
Loading sold comps map…
Walkable amenities ~0.75 mi
Loading nearby amenities…
Taxation est. · year 1
- Rental income
- $25,591
- − Mortgage interest
- −$6,162
- − Property taxes
- −$1,521
- − Insurance
- −$550
- − Repairs & maintenance
- −$2,047
- − Management
- −$2,047
- − Depreciation
- −$3,200
- Taxable income
- $10,063
- Est. tax owed @ 24.0%
- −$2,415
- After-tax cash flow
- $8,808/yr
For passive investors: Depreciation is non-cash, so a rental often shows a tax loss while cash-flowing — sheltering income. Rental losses are passive: they offset passive income freely, and up to $25,000/yr can offset ordinary (W-2) income if you actively participate and your MAGI is under $100k (phasing out to $0 by $150k); unused losses carry forward. On sale, claimed depreciation is recaptured at up to 25%, and gains may owe capital-gains tax (a 1031 exchange can defer both). Figures are a year-1 estimate at your 24.0% rate — not tax advice; consult a CPA.
Schools (NCES district)
- District
- Geneseo CUSD 228
- NCES district ID
- 1716350
- Math proficiency
- 23% ▼ -10.00%
- Reading proficiency
- 26% ▼ -9.00%
- Median HH income
- $63,288
- Composite
- 22.91/100
- National rank
- #7996
- State rank
- #297 of 620 in IL
Livability — Geneseo
- Score
- 83/100
- State rank
- #45
- US rank
- #907
Category grades
Schools grade is shown separately in the Schools card above.
Census & demographics
- Census place
- Geneseo, IL
- City population
- 12,049
- Population (ZIP)
- 12,049
Population outlook (Henry County) Hauer SSP2
- Today (2025)
- 47,376 people
- By 2030
- 45,920 · -3.1%
- By 2040
- 42,829 · -9.6%
- By 2050
- 39,606 · -16.4%
- By 2075
- 31,848 · -32.8%
- By 2100
- 23,503 · -50.4%
Race, ethnicity, and origin ACS 2023
- Neighborhood character
- Predominantly White (91%)
- Race & ethnicity
- White 91% Two or more races 7% Hispanic / Latino 6%
- Hispanic origin (detail)
- Mexican 6%
- Common ancestry
- English 9% Romanian 4% Portuguese 3%
- Foreign-born
- 1% · Canada, China
- Languages at home
- 96% English-only · Spanish 3%
Political lean MEDSL · Henry
- 2024 margin
- Strong R (+24.5) · D 36.8% · R 61.3% · Other 1.9%
- 2008→2024 swing
- -32.2pp toward R · 2008: 7.7pp · 2024: -24.5pp
- All cycles
- 2024: R+24.5 2020: R+21.4 2016: R+21.2 2012: D+3.1 2008: D+7.7
Not yet ingested
- Civics
- —
Market trends
- HPI YoY
- ▼ -74.08%
- Current HPI
- 157.4041
- Rent YoY
- —
- Metro
- —
- State GDP YoY
- ▲ 1.59%
- F500 in state
- 60
Industry mix (Fortune 500 HQ in IL)
| Industry | F500 HQs | Revenue |
|---|---|---|
| Insurance | 4 | $201B |
|
||
| Consumer Goods | 4 | $87B |
|
||
| Industrial Machinery | 3 | $64B |
|
||
| Healthcare | 2 | $55B |
|
||
| Retail / Pharmacy | 1 | $148B |
|
||
| Agriculture / Food | 1 | $86B |
|
||
Price history
+47.3% since first listed19 events — show timeline
- 2026-05-22 Listed $110,000 MRED as Distributed by MLS Grid
- 2026-03-04 Sold (Public Records) $101,000 Public Records
- 2026-02-27 Sold (MLS) — MRED as Distributed by MLS Grid
- 2026-01-26 Pending — MRED as Distributed by MLS Grid
- 2026-01-16 Relisted — MRED as Distributed by MLS Grid
- 2026-01-14 Listing Removed — MRED as Distributed by MLS Grid
- 2026-01-08 Relisted — MRED as Distributed by MLS Grid
- 2026-01-06 Listing Removed — RMLSA as Distributed by MLS Grid
- 2026-01-05 Listing Removed — MRED as Distributed by MLS Grid
- 2025-11-21 Price Changed — RMLSA as Distributed by MLS Grid
- 2025-10-10 Listed — RMLSA as Distributed by MLS Grid
- 2023-07-17 Sold (Public Records) $95,000 Public Records
- 2023-07-07 Sold (MLS) $95,000 RMLSA as Distributed by MLS Grid
- 2023-07-07 Sold (MLS) $95,000 MRED as Distributed by MLS Grid
- 2023-06-04 Contingent — RMLSA as Distributed by MLS Grid
- 2023-06-03 Listed $95,000 RMLSA as Distributed by MLS Grid
- 2023-06-03 Listed $95,000 MRED as Distributed by MLS Grid
- 2021-08-06 Listing Removed — RMLSA as Distributed by MLS Grid
- 2020-09-16 Sold (Public Records) $74,667 Public Records
Property tax history
+0.2%/yrLatest (2024): $1,521 · +16.2% YoY. Source: county tax records.
Cash-flow waterfall
monthlySold comps — $/sqft
last 12 mo · ≤1 miLoading sold comps…