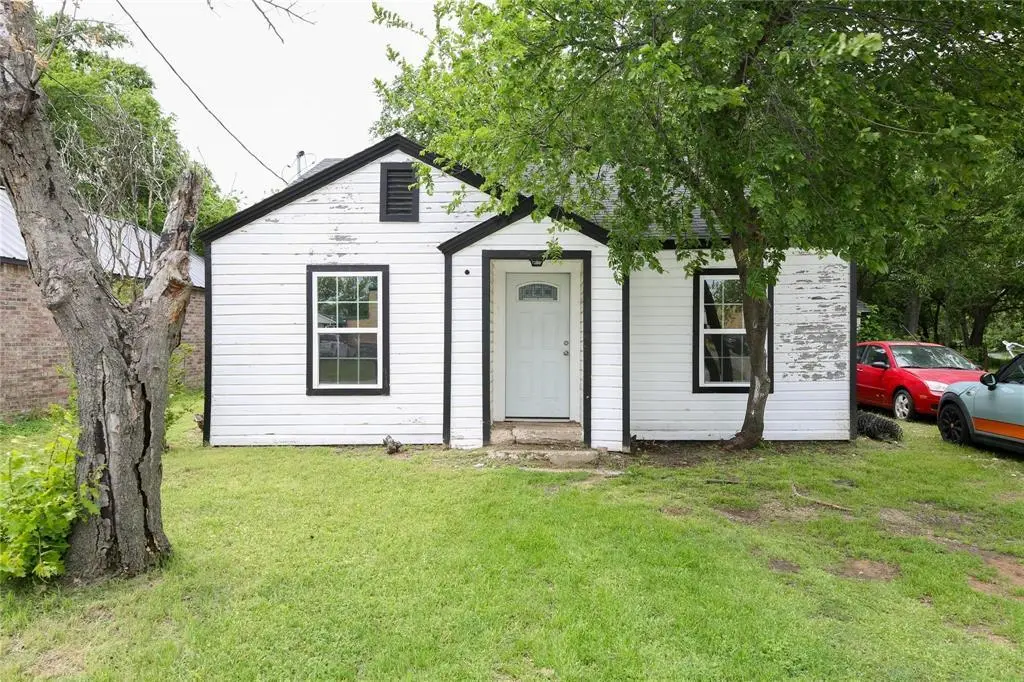
1011 Clay St · Nocona, TX
Flood risk 1/10 · Minimal
- FEMA flood zone
- X (unshaded)
- Chance of flooding over 30 yrs
- 0.0%
- Est. flood insurance / yr
- $507 – $1,088
Fire risk 8/10 · Major
- Est. fire insurance / yr
- $1,222 – $2,270
Heat risk 6/10 · Moderate
- Hot days now (above 109°F)
- 7 days/yr
- Hot days in 30 yrs
- 20 days/yr
Wind risk 4/10 · Minor
- Chance of severe wind over 30 yrs
- 11.0%
Air-quality risk 2/10 · Minimal
- Unhealthy air days now
- 1 days/yr
- Unhealthy air days in 30 yrs
- 2 days/yr
Risk factors via First Street. Map © Google.
Why this score? — see what drove the D grade
The composite is a weighted blend of 9 inputs, each scored 0–100. Each bar is that input's sub-score; the figure is the points it added to the 100-point composite (weight × sub-score).
- Cash flow +18.4/30.0
- DSCR +5.8/10.0
- 1% rule +4.6/10.0
- Schools +3.4/10.0
- Livability +3.4/5.0
- ARV discount +3.0/15.0
- Rent growth +2.5/5.0
- Condition / age +2.5/5.0
- Appreciation +0.0/10.0
$130,000
🖨 Deal sheet (PDF) 📄 Offer letter ✓ Due diligence
Listing remarks
Seller in process of replacing siding! Welcome to this beautifully remodeled 2 bed, 1 bath home located in the heart of historic downtown Nocona, Tx. Perfectly situated near local schools, parks and community events this inviting residence offers small town charm with modern updates. All new hardwood flooring, custom cabinets and granite countertops throughout and fresh paint for a beautiful landscape is awaiting you! Step inside to discover fresh finishes throughout, a bright and airy living space, and a functional layout for comfortable living. A garage offers secure parking or additional storage.
Key facts
- Hardwood flooring
- Custom cabinets
- Fresh paint
Tags
Property features AI
Finance
- Other: Special taxing entities apply; Possession at closing/funding
- Financial info: Listing accepts Cash and Conventional financing; Treat as clear loan type; No second mortgage indicated
- HOA & community: No association
Exterior
- Parking: Covered parking for 2 vehicles; Driveway; Garage; Attached 2-car garage
- Security: No surveillance devices noted
- Utilities: Electricity connected; Not in a municipal utility district
- Home design: Single family residence; Residential property; One story; Property is attached; Subdivision: J D Jennings
- Construction: Built in 1922 (preowned); Siding and wood construction; Composition roof; Pillar/post/pier foundation
- Exterior features: Awning(s); Lot under 0.5 acre
Interior
- Kitchen: Electric oven
- Bedrooms: 2 bedrooms; Primary bedroom on level 1 (approx. 10 x 13)
- Flooring: Carpet; Luxury vinyl plank
- Bathrooms: 1 full bathroom
- Heating & cooling: Central heating (electric); Central air (electric)
- Interior features: Built-in features; One living area; One dining area; Two total rooms
- Laundry & utility: No specific laundry details provided
Neighborhood map
What this means for you Summary
Snapshot
- This is a 2-bed/1.0-bath single-family listed at $130k.
Deal economics
- At list price, monthly cash flow is $121 ($1k/yr) — positive.
- The deal already cash-flows at list — no discount required.
- To meet the 1% rule (rent ≥ 1% of price), the offer needs to be $125k (3.7% below list).
- Recommended offer: $125k (3.7% below list) — sets the bar for 1% rule.
- Cap rate 7.4% vs local median 3.9% in Nocona — top-decile yield for the area; either an underpriced asset or a hidden risk that comps aren't pricing in. Stress-test before assuming the spread holds.
Location & tenants
- Location reads 67/100 on livability (#555 in TX) — a middle-class / working-renter tenant base. Strengths: cost of living A+, housing A+, health & safety A+; Watch: amenities F, commute F, employment F.
- Nocona ISD (town): math 44% / reading 37% proficiency, ranked #427 of 826 in TX (top 52%) — families likely to look elsewhere, expect single-tenant / working-renter base with shorter leases.
- Zoned schools: Nocona El (math 47% / reading 37%, grade F, #1,335 of 4,322 statewide, top 33%, 366 students, 59% FRL); Nocona Middle (math 42% / reading 37%, grade F, #660 of 1,662 statewide, top 41%, 194 students, 70% FRL); Nocona H S (math 42% / reading 37%, grade F, #821 of 1,632 statewide, top 53%, 244 students, 54% FRL).
- Market conditions: 189 active listings in the ZIP; 23 units permitted in Montague County in 2024 (0 in 5+ unit buildings).
Forward outlook
- Local home prices are declining (-3.0%/yr); year-one equity from $899 of loan paydown is wiped out by about $4k of value loss. Plan a longer hold.
- Montague County population projected at -15% by 2050 — secular population decline; favor cash flow + early exit over multi-decade hold.
Negotiation context
- It's been on market 53 days — a 3% lower offer ($126k) is reasonable based on typical stale-listing flexibility.
- 2 sale attempts with the ask held roughly flat each time — persistent listings suggest the price (not the market) is what's stuck; bring a comps-based counter.
Risks & watch-outs
- Watch-outs: built in 1922 — expect roof / HVAC / electrical / plumbing capex.
- Climate carrying-cost: severe wildfire risk; extreme-heat days projected 7→20/yr by 2055 (HVAC capex compounding) — expect insurance premiums to compound above CPI over the hold.
Questions for the listing agent
- It's been on market 53 days. Have you received any prior offers? Is the seller open to a 4% concession, seller financing, or rate buy-down credit?
- Built in 1922 — when were the roof, HVAC, electrical panel, plumbing, and water heater last replaced?
- Is there a deadline driving the sale (1031 exchange, divorce, estate, relocation)? That informs how much negotiation room exists.
- Schools are D-rated, which usually means shorter tenancies and higher turnover. Who's the typical renter profile here, and what's been the actual vacancy rate?
- The area grade is low — what's the realistic commute time and amenity access for the typical tenant pool here? Any planned neighborhood developments (good or bad) we should know about?
- What's the average days-on-market for RENTAL listings here right now (not sales)? A rising rental-DOM trend means longer vacancies and softer asking-rent achievability than the comps imply.
- What's the recent tenant-quality profile in this submarket — average credit score on applications, eviction rate, late-payment / NSF rate, and stable-employment percentage? A property-management company in the area should have these aggregated.
- How much new for-sale + rental construction is in the pipeline within 1–3 miles? Heavy new supply typically softens prices + rents 12–24 months out; constrained supply supports both.
Investment metrics
- 1% rule
- 0.96% ✗
- Cap rate
- 7.41%
- Cash-on-cash
- 3.99%
- DSCR
- 1.18
- GRM
- 8.6
CMA / ARV
- ARV (median comp)
- $118,197
- List price
- $130,000
- Delta
- 9.99%
- Verdict
- FAIR
- Comps
- 20 within 1.0 mi
Show comp detail 5 sales within ~0.75 mi
| Address | Dist | Beds/Ba | Sqft | Sold | Price | $/sf | Match |
|---|---|---|---|---|---|---|---|
| 1008 Grayson St | 0.25mi | 2/1.0 | 1,102 (+10%) | 11mo | $199,900 | $181 | 62 |
| 706 Grayson St | 0.28mi | 3/2.0 (+1) | 1,040 (+4%) | 19mo | $125,000 | $120 | 56 |
| 609 Baylor St | 0.34mi | 2/1.0 | 870 (-13%) | 12mo | $35,000 | $40 | 52 |
| 907 Young St | 0.19mi | 3/2.0 (+1) | 1,140 (+14%) | 9mo | $69,000 | $61 | 52 |
| 807 W Pine St | 0.63mi | 3/1.0 (+1) | 1,087 (+9%) | 20mo | $108,000 | $99 | 35 |
Match score weights: distance 35% · size 25% · config 20% · recency 20%. Top-matched comps best support the ARV.
Projected returns pro-forma
-3.0% appreciation · 3.0% rent growth · sell at horizon
- IRR
- -10.0%
- Equity multiple
- 0.63×
- Total profit
- $-13,350
- Equity at exit
- $19,383
- IRR
- -0.7%
- Equity multiple
- 0.95×
- Total profit
- $-1,688
- Equity at exit
- $11,240
Cash invested: $36,400 (down + closing). Projections, not guarantees.
Landlord ↔ Tenant lean methodology
- Overall (STATE)
- 87 Strongly Landlord-Friendly
- State Texas
- 87 Strongly Landlord-Friendly · R+5
- County
- — inherits STATE
- City
- — inherits STATE
ZIP-level market 76255
- Home prices YoY
- -12.5%
- Active inventory
- 189
- Price-to-rent
- 8.6×
Monthly cashflow live
- Estimated rent
- $1,252 medium interval (Pro) →
- Mortgage (P&I)
- −$682
- Tax from tax record
- −$132 /mo · $1,589/yr
- Insurance
- −$54
- HOA
- −$0
- Vacancy / Maint / Mgmt
- −$263
- Net cashflow
- $121
Break-even live
Sensitivity live
| Price | -10% $195 | -5% $158 | +0% $121 | +5% $84 | +10% $48 |
|---|---|---|---|---|---|
| Rent | -10% $22 | -5% $72 | +0% $121 | +5% $171 | +10% $220 |
| Rate | -1.0pp $187 | -0.5pp $154 | base $121 | +0.5pp $87 | +1.0pp $53 |
UW: 25.0% down · 7.5% · 30yr · 1.5% tax · 5.0% vac · 8.0% maint · 8.0% mgmt
Financing live
Cash to close
- Down payment
- $32,500
- Closing costs
- $3,900
- Reserves months
- —
- Total cash needed
- —
Loan-product check · same deal, 3 products live
Conventional
25% down · 7.5% · 30yr
- Down + closing
- —
- Monthly P&I
- —
- Monthly cashflow
- —
- DSCR
- —
- Eligible?
- —
Personal DTI + credit; lowest rate.
DSCR
20% down · 8.5% · 30yr
- Down + closing
- —
- Monthly P&I
- —
- Monthly cashflow
- —
- DSCR
- —
- Eligible?
- —
No personal income docs; deal must DSCR.
Hard money
10% down · 12.0% · 12mo
- Down + closing
- —
- Monthly P&I
- —
- Monthly cashflow
- —
- DSCR
- —
- Eligible?
- —
Short-term bridge; refi at stabilization.
Listing history 22 events
-
2026-06-21days on market $130,000 Active 53 DOM
-
2026-06-21days on market $130,000 Active 52 DOM
-
2026-06-18days on market $130,000 Active 50 DOM
-
2026-06-17days on market $130,000 Active 49 DOM
-
2026-06-16days on market $130,000 Active 48 DOM
-
2026-06-15days on market $130,000 Active 47 DOM
-
2026-06-15days on market $130,000 Active 46 DOM
-
2026-06-13days on market $130,000 Active 45 DOM
-
2026-06-12days on market $130,000 Active 44 DOM
-
2026-06-10days on market $130,000 Active 41 DOM
-
2026-06-08days on market $130,000 Active 40 DOM
-
2026-06-08days on market $130,000 Active 39 DOM
-
2026-06-05days on market $130,000 Active 37 DOM
-
2026-06-03days on market $130,000 Active 35 DOM
-
2026-06-02days on market $130,000 Active 34 DOM
-
2026-06-01days on market $130,000 Active 33 DOM
-
2026-05-31days on market $130,000 Active 32 DOM
-
2026-04-29$130,000 Active 608-char remark
-
2026-04-18historical
-
2025-08-13price $119,000
-
2025-07-01soldstatus
-
2025-04-30$145,000 Active
ⓘ Source: listings_history table (triggers on properties + properties_extension) + one-shot
backfill from property_details.listing_events for pre-trigger history.
Tax reassessment forecast TX · Resets to sale price
- Current annual tax
- $1,589 · $132/mo
- Projected year-2 tax
- $2,379 · $198/mo
- Expected delta
- +$790/yr (+$66/mo · 49.7%)
ⓘ Screening estimate from a state-policy table — verify with the county assessor before closing.
Climate risk First Street
- Flood 1/10 Low FEMA zone X (unshaded) · 0% chance over 30 yrs
- Wildfire 8/10 Severe
- Heat 6/10 Major 7 d/yr ≥109°F today · 20 d/yr by 30 yrs out
- Wind 4/10 Moderate 11% chance of damaging wind over 30 yrs
- Air quality 2/10 Low 1 unhealthy d/yr today · 2 by 30 yrs out
Nearby sold comps map
Loading sold comps map…
Walkable amenities ~0.75 mi
Loading nearby amenities…
Taxation est. · year 1
- Rental income
- $15,029
- − Mortgage interest
- −$7,282
- − Property taxes
- −$1,589
- − Insurance
- −$650
- − Repairs & maintenance
- −$1,202
- − Management
- −$1,202
- − Depreciation
- −$3,782
- Taxable loss
- −$678
- Est. tax savings @ 24.0%
- +$163
- After-tax cash flow
- $1,616/yr
For passive investors: Depreciation is non-cash, so a rental often shows a tax loss while cash-flowing — sheltering income. Rental losses are passive: they offset passive income freely, and up to $25,000/yr can offset ordinary (W-2) income if you actively participate and your MAGI is under $100k (phasing out to $0 by $150k); unused losses carry forward. On sale, claimed depreciation is recaptured at up to 25%, and gains may owe capital-gains tax (a 1031 exchange can defer both). Figures are a year-1 estimate at your 24.0% rate — not tax advice; consult a CPA.
Schools (NCES district)
- District
- Nocona ISD
- NCES district ID
- 4832790
- Math proficiency
- 44% ▼ -1.00%
- Reading proficiency
- 37% ▼ -7.00%
- Median HH income
- $37,890
- Composite
- 33.79/100
- National rank
- #5364
- State rank
- #427 of 826 in TX
Livability — Nocona
- Score
- 67/100
- State rank
- #555
- US rank
- #10720
Category grades
Schools grade is shown separately in the Schools card above.
Census & demographics
- Census place
- Nocona, TX
- Population (ZIP)
- 5,725
Population outlook (Montague County) Hauer SSP2
- Today (2025)
- 18,216 people
- By 2030
- 17,603 · -3.4%
- By 2040
- 16,451 · -9.7%
- By 2050
- 15,424 · -15.3%
- By 2075
- 13,365 · -26.6%
- By 2100
- 10,998 · -39.6%
Race, ethnicity, and origin ACS 2023
- Neighborhood character
- Predominantly White (82%)
- Race & ethnicity
- White 82% Hispanic / Latino 15% Two or more races 4%
- Hispanic origin (detail)
- Mexican 14%
- Common ancestry
- Lithuanian 2% Slovak 1% Iranian 1%
- Foreign-born
- 4% · Canada
- Languages at home
- 89% English-only · Spanish 10%
Political lean MEDSL · Montague
- 2024 margin
- Solid R (+77.7) · D 10.9% · R 88.5%
- 2008→2024 swing
- -19.2pp toward R · 2008: -58.5pp · 2024: -77.7pp
- All cycles
- 2024: R+77.7 2020: R+76.6 2016: R+77.2 2012: R+70.1 2008: R+58.5
Not yet ingested
- Civics
- —
Market trends
- HPI YoY
- ▼ -26.13%
- Current HPI
- 183.6308
- Rent YoY
- —
- Metro
- —
- State GDP YoY
- ▲ 3.95%
- F500 in state
- 110
Industry mix (Fortune 500 HQ in TX)
| Industry | F500 HQs | Revenue |
|---|---|---|
| Energy | 16 | $1,198B |
|
||
| Technology | 5 | $198B |
|
||
| Engineering / Construction | 4 | $72B |
|
||
| Energy Services | 3 | $60B |
|
||
| Utilities | 3 | $41B |
|
||
| Healthcare | 2 | $330B |
|
||
Price history
-10.3% since first listed5 events — show timeline
- 2026-04-29 Listed $130,000 NTREIS
- 2026-04-18 Listing Removed — NTREIS
- 2025-08-13 Price Changed $119,000 NTREIS
- 2025-07-01 Sold (Public Records) — Public Records
- 2025-04-30 Listed $145,000 NTREIS
Property tax history
+12.3%/yrLatest (2025): $1,589 · +3.8% YoY. Source: county tax records.
Cash-flow waterfall
monthlySold comps — $/sqft
last 12 mo · ≤1 miLoading sold comps…