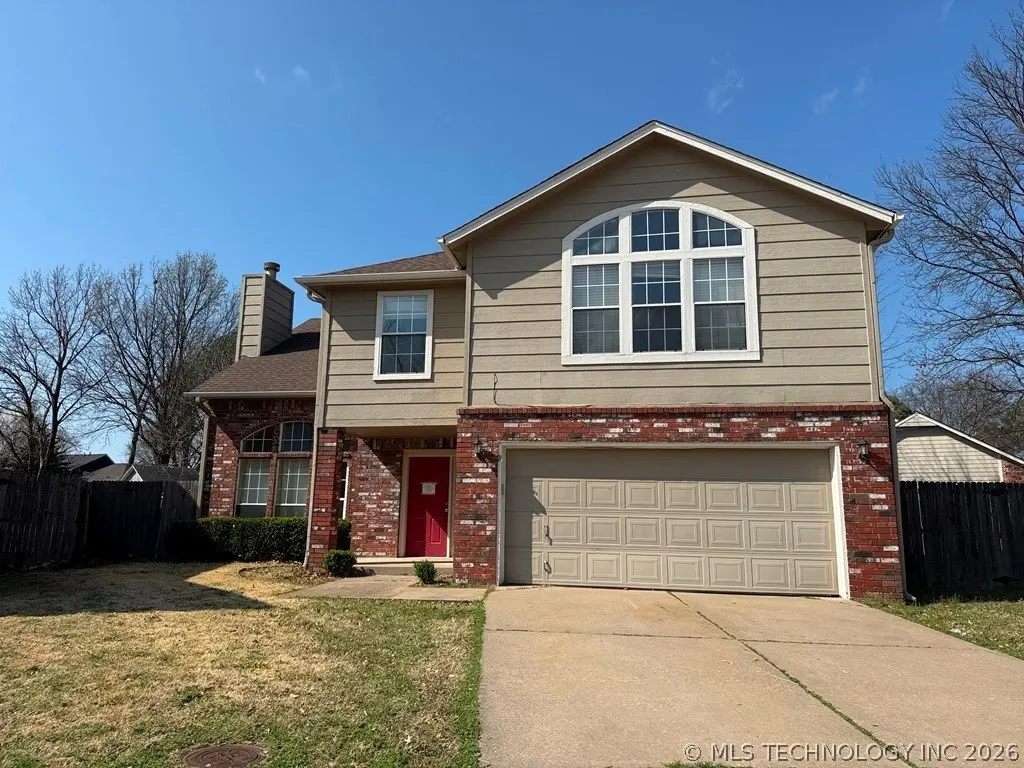
9226 S Fulton Ave · Tulsa, OK
Flood risk 1/10 · Minimal
- FEMA flood zone
- X (unshaded)
- Chance of flooding over 30 yrs
- 0.0%
- Est. flood insurance / yr
- $473 – $860
Fire risk 1/10 · Minimal
- Est. fire insurance / yr
- $2,463 – $4,575
Heat risk 6/10 · Moderate
- Hot days now (above 111°F)
- 7 days/yr
- Hot days in 30 yrs
- 18 days/yr
Wind risk 3/10 · Minor
- Chance of severe wind over 30 yrs
- 4.0%
Air-quality risk 2/10 · Minimal
- Unhealthy air days now
- 1 days/yr
- Unhealthy air days in 30 yrs
- 1 days/yr
Risk factors via First Street. Map © Google.
Why this score? — see what drove the D+ grade
The composite is a weighted blend of 9 inputs, each scored 0–100. Each bar is that input's sub-score; the figure is the points it added to the 100-point composite (weight × sub-score).
- ARV discount +15.0/15.0
- Cash flow +13.1/30.0
- 1% rule +4.3/10.0
- DSCR +3.9/10.0
- Livability +3.8/5.0
- Schools +3.2/10.0
- Rent growth +3.1/5.0
- Condition / age +2.5/5.0
- Appreciation +0.0/10.0
$249,900
🖨 Deal sheet (PDF) 📄 Offer letter ✓ Due diligence
Listing remarks MLS
Great Location for this two-story spacious home. Cul de Sac, Jenk Schools, near 91st & Yala Ave, short drive to Turnpike ! $ 4 Bedrooms, Bonus Room , Shopping & Schools nearby! take a look today! New Carpet! Reduced Price!
Key facts
- Excellent potential
- Quiet cul-de-sac
- Large lot
Tags
Property features AI
Finance
- HOA & community: Homeowners association with an annual fee of $230
Exterior
- Parking: Attached garage; 2 garage spaces
- Security: No safety shelter
- Utilities: Public water; Public sewer
- Home design: Two-story home; Faces northeast; Slab foundation
- Construction: Wood frame construction; Asphalt/fiberglass roof
- Exterior features: Partial fencing; Located on a cul-de-sac
Interior
- Kitchen: Oven; Range; Stove
- Flooring: Carpet; Concrete
- Bathrooms: Two full bathrooms; One half bathroom
- Heating & cooling: Central heating; Electric heating; Gas heating; Central air conditioning
- Interior features: Granite counters; No additional interior features listed
- Laundry & utility: Gas water heater
Neighborhood map
What this means for you Summary
Snapshot
- This is a 4-bed/2.0-bath single-family listed at $250k.
Deal economics
- At list price, monthly cash flow is $-8 ($-96/yr) — negative.
- To cash-flow at today's rent, offer at most $248k (0.6% below list).
- To meet the 1% rule (rent ≥ 1% of price), the offer needs to be $231k (7.4% below list).
- Recommended offer: $231k (7.4% below list) — sets the bar for 1% rule.
- Cap rate 6.3% vs local median 3.8% in Tulsa — top-decile yield for the area; either an underpriced asset or a hidden risk that comps aren't pricing in. Stress-test before assuming the spread holds.
Location & tenants
- Location reads 75/100 on livability (#13 in OK, #4,058 nationally) — a middle-class / working-renter tenant base. Strengths: amenities A+, commute A+, cost of living A+; Watch: crime F, employment D-.
- Jenks (suburban): math 34% / reading 35% proficiency, ranked #27 of 270 in OK (top 10%) — families likely to look elsewhere, expect single-tenant / working-renter base with shorter leases.
- Zoned schools: Jenks East Es (math 29% / reading 20%, grade F, #354 of 845 statewide, top 47%, 1,443 students, 0% FRL); Jenks Ms (math 22% / reading 30%, grade F, #79 of 345 statewide, top 24%, 1,831 students, 0% FRL); Jenks Hs (math 40% / reading 49%, grade F, #15 of 447 statewide, top 4%, 3,547 students, 0% FRL) — zoned schools average 0% FRL vs 28% district-wide (28 pts lower); this property's tenant base skews higher-income than the district average.
- Market conditions: Rents rising (+2.4%/yr); 227 active listings in the ZIP; 3 comparable units currently listed for rent nearby; rentals at typical pace (median 18d on market — plan ~3-4 weeks tenant-placement turnaround); solid renter incomes; 2,818 units permitted in Tulsa County in 2024 (518 in 5+ unit buildings).
Forward outlook
- Local home prices are declining (-3.0%/yr); year-one equity from $2k of loan paydown is wiped out by about $7k of value loss. Plan a longer hold.
- Tulsa County population projected at +30% by 2050 — long-run rental-demand tailwind backs the buy-and-hold thesis.
Negotiation context
- It's been on market 67 days — a 6% lower offer ($235k) is reasonable based on typical stale-listing flexibility.
- 6 sale attempts since 24y ago; this cycle's ask has dropped $24k (9%) from the opening price — seller is motivated, your offer sets the floor, not the list.
Risks & watch-outs
- Climate carrying-cost: extreme-heat days projected 7→18/yr by 2055 (HVAC capex compounding) — expect insurance premiums to compound above CPI over the hold.
Questions for the listing agent
- What do current leases actually rent for vs. the listed asking? Can we see a recent rent roll and the last 12 months of T-12 income?
- It's been on market 67 days. Have you received any prior offers? Is the seller open to a 7% concession, seller financing, or rate buy-down credit?
- What does the HOA fee cover, when was the last increase, and are there any pending special assessments or reserve-fund shortfalls?
- Why hasn't it sold? Are there any deal-killer items the seller is aware of (foundation, flood, title, zoning, code violations)?
- Is there a deadline driving the sale (1031 exchange, divorce, estate, relocation)? That informs how much negotiation room exists.
- Schools are F-rated, which usually means shorter tenancies and higher turnover. Who's the typical renter profile here, and what's been the actual vacancy rate?
- Crime grade is F in this area — have there been break-ins, vandalism, or insurance claims at this property in the last 3 years? What carrier currently insures it and at what premium?
- The area grade is low — what's the realistic commute time and amenity access for the typical tenant pool here? Any planned neighborhood developments (good or bad) we should know about?
- What's the average days-on-market for RENTAL listings here right now (not sales)? A rising rental-DOM trend means longer vacancies and softer asking-rent achievability than the comps imply.
- What's the recent tenant-quality profile in this submarket — average credit score on applications, eviction rate, late-payment / NSF rate, and stable-employment percentage? A property-management company in the area should have these aggregated.
- How much new for-sale + rental construction is in the pipeline within 1–3 miles? Heavy new supply typically softens prices + rents 12–24 months out; constrained supply supports both.
Investment metrics
- 1% rule
- 0.93% ✗
- Cap rate
- 6.25%
- Cash-on-cash
- -0.14%
- DSCR
- 0.99
- GRM
- 9.0
CMA / ARV
- ARV (on-the-fly)
- $370,256
- Comps found
- 12
Show comp detail 12 sales within ~0.75 mi
| Address | Dist | Beds/Ba | Sqft | Sold | Price | $/sf | Match |
|---|---|---|---|---|---|---|---|
| 9332 S Darlington Ave | 0.15mi | 4/2.5 | 2,455 (-3%) | 5mo | $345,000 | $141 | 82 |
| 9230 S Fulton Ave | 0.01mi | 4/2.5 | 2,352 (-7%) | 5mo | $340,000 | $145 | 81 |
| 9750 S Granite Ave | 0.40mi | 4/2.5 | 2,638 (+4%) | 9mo | $448,000 | $170 | 65 |
| 4926 E 97th St | 0.49mi | 3/2.5 (-1) | 2,456 (-3%) | 2mo | $407,000 | $166 | 64 |
| 6307 E 96th St | 0.53mi | 3/2.0 (-1) | 2,283 (-10%) | 1mo | $315,000 | $138 | 53 |
| 9404 S Norwood Ave | 0.45mi | 3/2.0 (-1) | 2,271 (-10%) | 7mo | $305,000 | $134 | 51 |
| 5104 E 97th Ct | 0.47mi | 3/3.0 (-1) | 2,751 (+8%) | 7mo | $450,000 | $164 | 49 |
| 9141 S Lakewood Ave | 0.40mi | 3/2.5 (-1) | 2,248 (-11%) | 8mo | $328,000 | $146 | 49 |
| 9512 S Norwood Ave | 0.56mi | 3/2.5 (-1) | 2,259 (-11%) | 1mo | $306,000 | $135 | 48 |
| 9920 S Irvington Ave | 0.62mi | 4/3.0 | 2,855 (+13%) | 1mo | $560,000 | $196 | 45 |
| 9361 S 67th EastAvenue | 0.74mi | 4/2.5 | 2,805 (+11%) | 8mo | $314,000 | $112 | 40 |
| 5811 E 100th Pl | 0.71mi | 3/2.0 (-1) | 2,194 (-14%) | 7mo | $390,000 | $178 | 34 |
Match score weights: distance 35% · size 25% · config 20% · recency 20%. Top-matched comps best support the ARV.
Projected returns pro-forma
-3.0% appreciation · 2.43% rent growth · sell at horizon
- IRR
- -17.2%
- Equity multiple
- 0.40×
- Total profit
- $-42,222
- Equity at exit
- $37,261
- IRR
- -10.2%
- Equity multiple
- 0.39×
- Total profit
- $-42,361
- Equity at exit
- $21,607
Cash invested: $69,972 (down + closing). Projections, not guarantees.
Landlord ↔ Tenant lean methodology
- Overall (STATE)
- 83 Strongly Landlord-Friendly
- State Oklahoma
- 83 Strongly Landlord-Friendly · R+20
- County
- — inherits STATE
- City
- — inherits STATE
ZIP-level market 74137
- Rents YoY
- 2.4%
- Active inventory
- 227
- Price-to-rent
- 9.0×
Monthly cashflow live
- Estimated rent
- $2,314 medium interval (Pro) →
- Mortgage (P&I)
- −$1,311
- Tax from tax record
- −$403 /mo · $4,831/yr
- Insurance
- −$104
- HOA
- −$19
- Vacancy / Maint / Mgmt
- −$486
- Net cashflow
- $-8
Break-even live
Sensitivity live
| Price | -10% $133 | -5% $63 | +0% $-8 | +5% $-79 | +10% $-149 |
|---|---|---|---|---|---|
| Rent | -10% $-191 | -5% $-99 | +0% $-8 | +5% $83 | +10% $175 |
| Rate | -1.0pp $118 | -0.5pp $56 | base $-8 | +0.5pp $-73 | +1.0pp $-139 |
UW: 25.0% down · 7.5% · 30yr · 1.5% tax · 5.0% vac · 8.0% maint · 8.0% mgmt
Financing live
Cash to close
- Down payment
- $62,475
- Closing costs
- $7,497
- Reserves months
- —
- Total cash needed
- —
Loan-product check · same deal, 3 products live
Conventional
25% down · 7.5% · 30yr
- Down + closing
- —
- Monthly P&I
- —
- Monthly cashflow
- —
- DSCR
- —
- Eligible?
- —
Personal DTI + credit; lowest rate.
DSCR
20% down · 8.5% · 30yr
- Down + closing
- —
- Monthly P&I
- —
- Monthly cashflow
- —
- DSCR
- —
- Eligible?
- —
No personal income docs; deal must DSCR.
Hard money
10% down · 12.0% · 12mo
- Down + closing
- —
- Monthly P&I
- —
- Monthly cashflow
- —
- DSCR
- —
- Eligible?
- —
Short-term bridge; refi at stabilization.
Rent comps 3 comps
| Address | Beds | Baths | Sqft | Rent | $/sqft | DOM | Units | Dist |
|---|---|---|---|---|---|---|---|---|
| 9215 S Erie Ave Tulsa, OK | 5.0 | 3.0 | 2800 | $2,750 | $0.98 | 12d | 1 | 0.03mi |
| 9224 S Hudson Ave Tulsa, OK | 4.0 | 2.5 | 2524 | $2,450 | $0.97 | 18d | 1 | 0.08mi |
| 6506 E 90th St Unit 6506 Tulsa, OK | 3.0 | 2.0 | 1839 | $1,550 | $0.84 | 25d | 1 | 0.70mi |
HOA detail
- Monthly dues
- $19 · $228/yr
Listing history 41 events
-
2026-06-21days on market $249,900 Active 67 DOM
-
2026-06-18days on market $249,900 Active 64 DOM
-
2026-06-17days on market $249,900 Active 63 DOM
-
2026-06-16days on market $249,900 Active 62 DOM
-
2026-06-15days on market $249,900 Active 61 DOM
-
2026-06-13days on market $249,900 Active 59 DOM
-
2026-06-13status $249,900 Active 58 DOM
-
2026-05-12price $249,900
-
2026-03-31$273,500 Active
-
2022-11-07soldstatus $308,000
-
2022-11-04soldstatus $309,900 Closed 235-char remark
Show marketing remark (235 chars)
Great Location for this two-story spacious home. Cul de Sac, Jenk Schools, near 91st & Yala Ave, short drive to Turnpike ! $ 4 Bedrooms, Bonus Room , Shopping & Schools nearby! take a look today! New Carpet! Reduced Price!
-
2022-09-28status Pending 235-char remark
Show marketing remark (235 chars)
Great Location for this two-story spacious home. Cul de Sac, Jenk Schools, near 91st & Yala Ave, short drive to Turnpike ! $ 4 Bedrooms, Bonus Room , Shopping & Schools nearby! take a look today! New Carpet! Reduced Price!
-
2022-09-08price $309,900 235-char remark
Show marketing remark (235 chars)
Great Location for this two-story spacious home. Cul de Sac, Jenk Schools, near 91st & Yala Ave, short drive to Turnpike ! $ 4 Bedrooms, Bonus Room , Shopping & Schools nearby! take a look today! New Carpet! Reduced Price!
-
2022-09-01price $319,000 235-char remark
Show marketing remark (235 chars)
Great Location for this two-story spacious home. Cul de Sac, Jenk Schools, near 91st & Yala Ave, short drive to Turnpike ! $ 4 Bedrooms, Bonus Room , Shopping & Schools nearby! take a look today! New Carpet! Reduced Price!
-
2022-08-16price $324,900 235-char remark
Show marketing remark (235 chars)
Great Location for this two-story spacious home. Cul de Sac, Jenk Schools, near 91st & Yala Ave, short drive to Turnpike ! $ 4 Bedrooms, Bonus Room , Shopping & Schools nearby! take a look today! New Carpet! Reduced Price!
-
2022-07-27price $330,000 235-char remark
Show marketing remark (235 chars)
Great Location for this two-story spacious home. Cul de Sac, Jenk Schools, near 91st & Yala Ave, short drive to Turnpike ! $ 4 Bedrooms, Bonus Room , Shopping & Schools nearby! take a look today! New Carpet! Reduced Price!
-
2022-06-24$347,000 Active 235-char remark
Show marketing remark (235 chars)
Great Location for this two-story spacious home. Cul de Sac, Jenk Schools, near 91st & Yala Ave, short drive to Turnpike ! $ 4 Bedrooms, Bonus Room , Shopping & Schools nearby! take a look today! New Carpet! Reduced Price!
-
2020-06-05soldstatus $205,000
-
2017-07-12historical
-
2017-07-07price $204,900
-
2017-06-16price $209,900
-
2017-06-09price $219,900
-
2017-05-26$227,900 Active
-
2016-04-25historical
-
2016-04-06price $189,900
-
2016-03-14price $192,800
-
2016-01-13$192,900 Active
-
2015-12-16historical
-
2015-12-10price $195,900
-
2015-11-09price $199,900
-
2015-10-27price $209,900
-
2015-10-09price $214,900
-
2015-09-22$219,900 Active
-
2015-08-03soldstatus $121,000
-
2015-08-03soldstatus $154,000
-
2003-04-29soldstatus $145,000
-
2003-04-25soldstatus $145,000
-
2003-03-24historical
-
2002-10-01$145,000
-
1990-10-01soldstatus $87,000
-
1990-05-11soldstatus $28,000
ⓘ Source: listings_history table (triggers on properties + properties_extension) + one-shot
backfill from property_details.listing_events for pre-trigger history.
Tax reassessment forecast OK · Resets to sale price
- Current annual tax
- $4,831 · $403/mo
- Projected year-2 tax
- $4,831 · $403/mo
- Expected delta
- $0/yr ($0/mo · 0.0%)
ⓘ Screening estimate from a state-policy table — verify with the county assessor before closing.
Climate risk First Street
- Flood 1/10 Low FEMA zone X (unshaded) · 0% chance over 30 yrs
- Wildfire 1/10 Low
- Heat 6/10 Major 7 d/yr ≥111°F today · 18 d/yr by 30 yrs out
- Wind 3/10 Moderate 4% chance of damaging wind over 30 yrs
- Air quality 2/10 Low 1 unhealthy d/yr today · 1 by 30 yrs out
Nearby sold comps map
Loading sold comps map…
Walkable amenities ~0.75 mi
Loading nearby amenities…
Taxation est. · year 1
- Rental income
- $27,770
- − Mortgage interest
- −$13,998
- − Property taxes
- −$4,831
- − Insurance
- −$1,250
- − Repairs & maintenance
- −$2,222
- − Management
- −$2,222
- − HOA
- −$228
- − Depreciation
- −$7,270
- Taxable loss
- −$4,250
- Est. tax savings @ 24.0%
- +$1,020
- After-tax cash flow
- $924/yr
For passive investors: Depreciation is non-cash, so a rental often shows a tax loss while cash-flowing — sheltering income. Rental losses are passive: they offset passive income freely, and up to $25,000/yr can offset ordinary (W-2) income if you actively participate and your MAGI is under $100k (phasing out to $0 by $150k); unused losses carry forward. On sale, claimed depreciation is recaptured at up to 25%, and gains may owe capital-gains tax (a 1031 exchange can defer both). Figures are a year-1 estimate at your 24.0% rate — not tax advice; consult a CPA.
Schools (NCES district)
- District
- Jenks
- NCES district ID
- 4015720
- Math proficiency
- 34% ▼ -9.00%
- Reading proficiency
- 35% ▼ -8.00%
- Median HH income
- $66,291
- Composite
- 31.5/100
- National rank
- #5973
- State rank
- #27 of 270 in OK
Livability — Tulsa
- Score
- 75/100
- State rank
- #13
- US rank
- #4058
Category grades
Schools grade is shown separately in the Schools card above.
Census & demographics
- Census place
- Tulsa, OK
- County
- Tulsa County · 640,811 people
- City population
- 389,418
- Metro
- Tulsa, OK
- Population (ZIP)
- 28,533
- Household income
- $102,798
- Rent vs Own
- Severe rent burden
- 751.0
Population outlook (Tulsa County) Hauer SSP2
- Today (2025)
- 723,846 people
- By 2030
- 766,033 · +5.8%
- By 2040
- 851,386 · +17.6%
- By 2050
- 938,389 · +29.6%
- By 2075
- 1,166,011 · +61.1%
- By 2100
- 1,350,277 · +86.5%
Race, ethnicity, and origin ACS 2023
- Neighborhood character
- Predominantly White (76%)
- Race & ethnicity
- White 76% Two or more races 9% Hispanic / Latino 6% Asian 5% Black 4% Native American 3%
- Hispanic origin (detail)
- Mexican 3%
- Common ancestry
- Slovak 5% Italian 3% Lithuanian 2%
- Foreign-born
- 10% · Canada, Philippines, China
- Languages at home
- 88% English-only · Spanish 4% Other Asian/Pacific 2% Other Indo-European 2%
Political lean MEDSL · Tulsa
- 2024 margin
- R (+15.2) · D 41.3% · R 56.5% · Other 2.2%
- 2008→2024 swing
- +9.2pp toward D · 2008: -24.5pp · 2024: -15.2pp
- All cycles
- 2024: R+15.2 2020: R+15.6 2016: R+22.9 2012: R+27.4 2008: R+24.5
Not yet ingested
- Civics
- —
Market trends
- HPI YoY
- ▼ -141.68%
- Current HPI
- 192.2879
- Rent YoY
- ▲ 2.43%
- Metro
- Tulsa, OK
- State GDP YoY
- ▲ 1.55%
- F500 in state
- 6
Industry mix (Fortune 500 HQ in OK)
| Industry | F500 HQs | Revenue |
|---|---|---|
| Energy | 3 | $48B |
|
||
Price history
+792.5% since first listed34 events — show timeline
- 2026-05-12 Price Changed $249,900 MLS Technology, Inc.
- 2026-03-31 Listed $273,500 MLS Technology, Inc.
- 2022-11-07 Sold (Public Records) $308,000 Public Records
- 2022-11-04 Sold (MLS) $309,900 MLS Technology, Inc.
- 2022-09-28 Pending — MLS Technology, Inc.
- 2022-09-08 Price Changed $309,900 MLS Technology, Inc.
- 2022-09-01 Price Changed $319,000 MLS Technology, Inc.
- 2022-08-16 Price Changed $324,900 MLS Technology, Inc.
- 2022-07-27 Price Changed $330,000 MLS Technology, Inc.
- 2022-06-24 Listed $347,000 MLS Technology, Inc.
- 2020-06-05 Sold (Public Records) $205,000 Public Records
- 2017-07-12 Listing Removed — MLS Technology, Inc.
- 2017-07-07 Price Changed $204,900 MLS Technology, Inc.
- 2017-06-16 Price Changed $209,900 MLS Technology, Inc.
- 2017-06-09 Price Changed $219,900 MLS Technology, Inc.
- 2017-05-26 Listed $227,900 MLS Technology, Inc.
- 2016-04-25 Listing Removed — MLS Technology, Inc.
- 2016-04-06 Price Changed $189,900 MLS Technology, Inc.
- 2016-03-14 Price Changed $192,800 MLS Technology, Inc.
- 2016-01-13 Listed $192,900 MLS Technology, Inc.
- 2015-12-16 Listing Removed — MLS Technology, Inc.
- 2015-12-10 Price Changed $195,900 MLS Technology, Inc.
- 2015-11-09 Price Changed $199,900 MLS Technology, Inc.
- 2015-10-27 Price Changed $209,900 MLS Technology, Inc.
- 2015-10-09 Price Changed $214,900 MLS Technology, Inc.
- 2015-09-22 Listed $219,900 MLS Technology, Inc.
- 2015-08-03 Sold (Public Records) $154,000 Public Records
- 2015-08-03 Sold (Public Records) $121,000 Public Records
- 2003-04-29 Sold (Public Records) $145,000 Public Records
- 2003-04-25 Sold (MLS) $145,000 MLS Technology, Inc.
- 2003-03-24 Listing Removed — MLS Technology, Inc.
- 2002-10-01 Listed $145,000 MLS Technology, Inc.
- 1990-10-01 Sold (Public Records) $87,000 Public Records
- 1990-05-11 Sold (Public Records) $28,000 Public Records
Property tax history
+6.1%/yrLatest (2025): $4,831 · +9.4% YoY. Source: county tax records.
Cash-flow waterfall
monthlySold comps — $/sqft
last 12 mo · ≤1 miLoading sold comps…