315 Messer Loop Rd · Long Creek, NC
Flood risk 1/10 · Minimal
- FEMA flood zone
- X (unshaded)
- Chance of flooding over 30 yrs
- 0.0%
- Est. flood insurance / yr
- $507 – $1,088
Fire risk 6/10 · Moderate
- Est. fire insurance / yr
- $906 – $1,684
Heat risk 8/10 · Major
- Hot days now (above 106°F)
- 7 days/yr
- Hot days in 30 yrs
- 17 days/yr
Wind risk 8/10 · Major
- Chance of severe wind over 30 yrs
- 92.0%
Air-quality risk 2/10 · Minimal
- Unhealthy air days now
- 1 days/yr
- Unhealthy air days in 30 yrs
- 1 days/yr
Risk factors via First Street. Map © Google.
Why this score? — see what drove the C- grade
The composite is a weighted blend of 9 inputs, each scored 0–100. Each bar is that input's sub-score; the figure is the points it added to the 100-point composite (weight × sub-score).
- Cash flow +21.5/30.0
- ARV discount +7.5/15.0
- DSCR +6.9/10.0
- 1% rule +4.4/10.0
- Schools +4.2/10.0
- Rent growth +2.5/5.0
- Livability +2.5/5.0
- Condition / age +2.5/5.0
- Appreciation +0.0/10.0
$132,865
🖨 Deal sheet 📄 Offer letter ✓ Due diligence
Listing remarks MLS
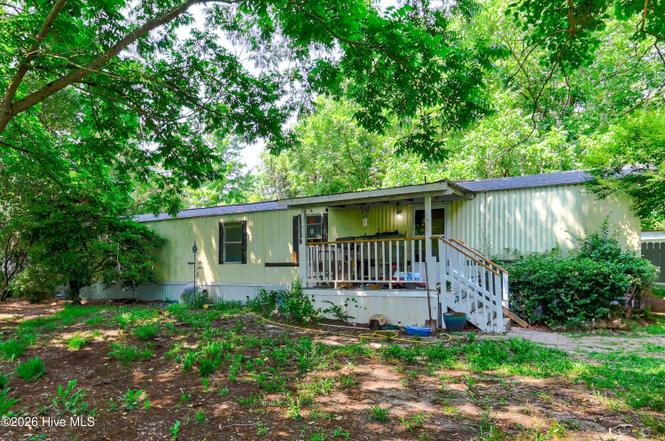
SINGLEWIDE MANUFACTURED HOME ON OVER AN ACRE, FULLY FENCED, BEAUTIFULLY LANDSCAPED, HUGE FENCED DOG HOME, MANY BUILT-INS, 14X21 POLE BARN, PORCH.
Key facts
- New roof
- 1.06 acre lot
- Built 1997
Tags
Property features AI
Exterior
- Parking: No dedicated parking
- Utilities: Well water; Septic tank
- Home design: Manufactured home; Single-story (entry level on 1st floor); One level
- Construction: Aluminum and vinyl siding with frame construction; Shingle roof; Built on crawl space
- Exterior features: Front porch; Rear porch; Has a view
Interior
- Bathrooms: 2 full bathrooms
- Heating & cooling: Wall furnace (electric); Wall/window cooling units
- Interior features: Ceiling fan(s); Crawl space basement
Neighborhood map
What this means for you Summary
Snapshot
- This is a 2-bed/2.0-bath other listed at $133k.
Deal economics
- At list price, monthly cash flow is $200 ($2k/yr) — positive.
- The deal already cash-flows at list — no discount required.
- To meet the 1% rule (rent ≥ 1% of price), the offer needs to be $125k (5.9% below list).
- Recommended offer: $125k (5.9% below list) — sets the bar for 1% rule.
Location & tenants
- Location reads: area grade C — affects rentability + tenant quality, not the cash-flow math above.
- Pender County Schools (rural): math 49% / reading 50% proficiency, ranked #66 of 178 in NC (top 37%) — families likely to look elsewhere, expect single-tenant / working-renter base with shorter leases.
- Zoned schools: Malpass Corner Elementary (math 27% / reading 22%, grade F, #1,112 of 1,410 statewide, top 82%, 480 students, 89% FRL); West Pender Middle (math 22% / reading 32%, grade F, #374 of 475 statewide, top 80%, 179 students, 86% FRL); Pender High (math 37% / reading 42%, grade F, #393 of 535 statewide, top 75%, 677 students, 71% FRL) — zoned schools average 82% FRL vs 47% district-wide (35 pts higher); higher-poverty schools than district average — tighter screening recommended.
- Zoned-school proficiency averages 30% at this address vs 50% district-wide (-19 pts) — the specific schools serving this property underperform the Pender County Schools average; the district grade overstates school quality for this exact location.
- Market conditions: 112 active listings in the ZIP; 943 units permitted in Pender County in 2024 (0 in 5+ unit buildings).
Forward outlook
- Local home prices are declining (-3.0%/yr); year-one equity from $919 of loan paydown is wiped out by about $4k of value loss. Plan a longer hold.
- Pender County population projected at +38% by 2050 — long-run rental-demand tailwind backs the buy-and-hold thesis.
Negotiation context
- Only 8 days on market — expect competitive offers; lowballing is unlikely to land.
- 2 sale attempts since 26y ago with the ask held roughly flat each time — persistent listings suggest the price (not the market) is what's stuck; bring a comps-based counter.
- Current owner paid $34k; list at $133k implies a 291% gain — meaningful room to come down on a strong offer.
Risks & watch-outs
- Climate carrying-cost: severe wind risk, 92% chance of damaging wind over 30y; major wildfire risk; extreme-heat days projected 7→17/yr by 2055 (HVAC capex compounding) — expect insurance premiums to compound above CPI over the hold.
Questions for the listing agent
- Is there a deadline driving the sale (1031 exchange, divorce, estate, relocation)? That informs how much negotiation room exists.
- What's the average days-on-market for RENTAL listings here right now (not sales)? A rising rental-DOM trend means longer vacancies and softer asking-rent achievability than the comps imply.
- What's the recent tenant-quality profile in this submarket — average credit score on applications, eviction rate, late-payment / NSF rate, and stable-employment percentage? A property-management company in the area should have these aggregated.
- How much new for-sale + rental construction is in the pipeline within 1–3 miles? Heavy new supply typically softens prices + rents 12–24 months out; constrained supply supports both.
Investment metrics
- 1% rule
- 0.94% ✗
- Cap rate
- 8.10%
- Cash-on-cash
- 6.46%
- DSCR
- 1.29
- GRM
- 8.9
CMA / ARV
No comps found within radius.
Projected returns pro-forma
-3.0% appreciation · 3.0% rent growth · sell at horizon
- IRR
- -6.4%
- Equity multiple
- 0.76×
- Total profit
- $-8,842
- Equity at exit
- $19,811
- IRR
- 3.2%
- Equity multiple
- 1.23×
- Total profit
- $8,467
- Equity at exit
- $11,488
Cash invested: $37,202 (down + closing). Projections, not guarantees.
Landlord ↔ Tenant lean methodology
- Overall (STATE)
- 85 Strongly Landlord-Friendly
- State North Carolina
- 85 Strongly Landlord-Friendly · R+3
- County
- — inherits STATE
- City
- — inherits STATE
ZIP-level market 28425
- Home prices YoY
- -28.3%
- Active inventory
- 112
- Price-to-rent
- 8.9×
Monthly cashflow live
- Estimated rent
- $1,250 medium interval (Pro) →
- Mortgage (P&I)
- −$697
- Tax from tax record
- −$35 /mo · $426/yr
- Insurance
- −$55
- HOA
- −$0
- Vacancy / Maint / Mgmt
- −$263
- Net cashflow
- $200
Break-even live
UW: 25.0% down · 7.5% · 30yr · 1.5% tax · 5.0% vac · 8.0% maint · 8.0% mgmt
Financing live
Cash to close
- Down payment
- $33,216
- Closing costs
- $3,986
- Reserves months
- —
- Total cash needed
- —
Loan-product check · same deal, 3 products live
Conventional
25% down · 7.5% · 30yr
- Down + closing
- —
- Monthly P&I
- —
- Monthly cashflow
- —
- DSCR
- —
- Eligible?
- —
Personal DTI + credit; lowest rate.
DSCR
20% down · 8.5% · 30yr
- Down + closing
- —
- Monthly P&I
- —
- Monthly cashflow
- —
- DSCR
- —
- Eligible?
- —
No personal income docs; deal must DSCR.
Hard money
10% down · 12.0% · 12mo
- Down + closing
- —
- Monthly P&I
- —
- Monthly cashflow
- —
- DSCR
- —
- Eligible?
- —
Short-term bridge; refi at stabilization.
Listing history 7 events
-
2026-06-18days on market $132,865 Active 8 DOM
-
2026-06-17days on market $132,865 Active 7 DOM
-
2026-06-16days on market $132,865 Active 6 DOM
-
2026-06-15days on market $132,865 Active 5 DOM
-
2026-06-14days on market $132,865 Active 3 DOM
-
2026-06-13remarks 229-char remark
-
2026-06-13$132,865 Active 2 DOM
ⓘ Source: listings_history table (triggers on properties + properties_extension) + one-shot
backfill from property_details.listing_events for pre-trigger history.
Tax reassessment forecast NC · Resets to sale price
- Current annual tax
- $426 · $35/mo
- Projected year-2 tax
- $1,089 · $91/mo
- Expected delta
- +$664/yr (+$55/mo · 155.9%)
ⓘ Screening estimate from a state-policy table — verify with the county assessor before closing.
Climate risk First Street
- Flood 1/10 Low FEMA zone X (unshaded) · 0% chance over 30 yrs
- Wildfire 6/10 Major
- Heat 8/10 Severe 7 d/yr ≥106°F today · 17 d/yr by 30 yrs out
- Wind 8/10 Severe 92% chance of damaging wind over 30 yrs
- Air quality 2/10 Low 1 unhealthy d/yr today · 1 by 30 yrs out
Nearby sold comps map
Loading sold comps map…
Walkable amenities ~0.75 mi
Loading nearby amenities…
Taxation est. · year 1
- Rental income
- $15,004
- − Mortgage interest
- −$7,443
- − Property taxes
- −$426
- − Insurance
- −$664
- − Repairs & maintenance
- −$1,200
- − Management
- −$1,200
- − Depreciation
- −$3,865
- Taxable income
- $206
- Est. tax owed @ 24.0%
- −$49
- After-tax cash flow
- $2,353/yr
For passive investors: Depreciation is non-cash, so a rental often shows a tax loss while cash-flowing — sheltering income. Rental losses are passive: they offset passive income freely, and up to $25,000/yr can offset ordinary (W-2) income if you actively participate and your MAGI is under $100k (phasing out to $0 by $150k); unused losses carry forward. On sale, claimed depreciation is recaptured at up to 25%, and gains may owe capital-gains tax (a 1031 exchange can defer both). Figures are a year-1 estimate at your 24.0% rate — not tax advice; consult a CPA.
Schools (NCES district)
- District
- Pender County Schools
- NCES district ID
- 3703570
- Math proficiency
- 49% ▲ 3.00%
- Reading proficiency
- 50% ▬ 0.00%
- Median HH income
- $45,792
- Composite
- 41.97/100
- National rank
- #3342
- State rank
- #66 of 178 in NC
Livability — Long Creek
No livability data for this city. (Only ~50 U.S. cities are tracked.)
Census & demographics
- Population (ZIP)
- 10,823
Population outlook (Pender County) Hauer SSP2
- Today (2025)
- 69,295 people
- By 2030
- 74,990 · +8.2%
- By 2040
- 85,954 · +24.0%
- By 2050
- 95,925 · +38.4%
- By 2075
- 117,525 · +69.6%
- By 2100
- 129,074 · +86.3%
Race, ethnicity, and origin ACS 2023
- Neighborhood character
- Predominantly White (65%)
- Race & ethnicity
- White 65% Black 21% Hispanic / Latino 8% Two or more races 5%
- Hispanic origin (detail)
- Mexican 5%
- Common ancestry
- Italian 2% Serbian 2% Slovak 2%
- Foreign-born
- 4% · Canada
- Languages at home
- 93% English-only · Spanish 6%
Political lean MEDSL · Pender
- 2024 margin
- Solid R (+35.0) · D 32.1% · R 67.0%
- 2008→2024 swing
- -19.4pp toward R · 2008: -15.6pp · 2024: -35.0pp
- All cycles
- 2024: R+35.0 2020: R+29.9 2016: R+30.4 2012: R+20.4 2008: R+15.6
Not yet ingested
- Civics
- —
Market trends
- HPI YoY
- ▼ -87.03%
- Current HPI
- 220.2477
- Rent YoY
- —
- Metro
- —
- State GDP YoY
- ▲ 3.28%
- F500 in state
- 26
Industry mix (Fortune 500 HQ in NC)
| Industry | F500 HQs | Revenue |
|---|---|---|
| Financial Services | 2 | $213B |
|
||
| Retail | 2 | $95B |
|
||
| Industrial Conglomerate | 1 | $38B |
|
||
| Metals / Steel | 1 | $35B |
|
||
| Utilities | 1 | $30B |
|
||
| Industrial Machinery | 1 | $19B |
|
||
Price history
+249.6% since first listed3 events — show timeline
- 2026-06-10 Listed $132,865 Hive MLS
- 2000-11-01 Sold (MLS) $34,000 Hive MLS
- 2000-07-31 Listed $38,000 Hive MLS
Property tax history
+1.5%/yrLatest (2025): $426 · +0.0% YoY. Source: county tax records.
Cash-flow waterfall
monthlySold comps — $/sqft
last 12 mo · ≤1 miLoading sold comps…