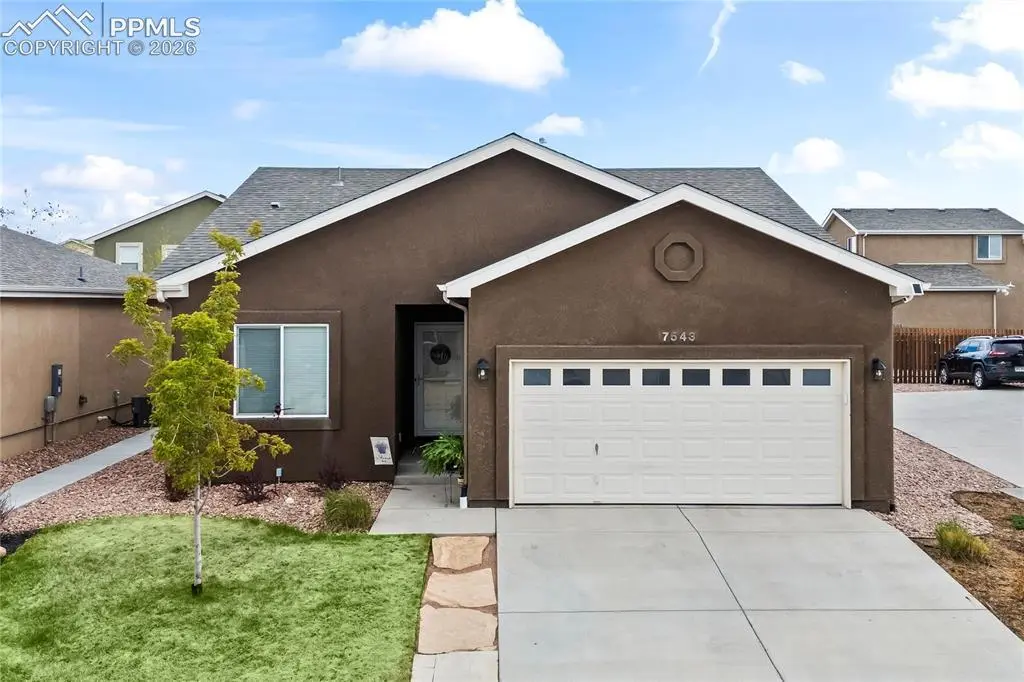
7543 Saynassalo Pt · Colorado Springs, CO
Flood risk 1/10 · Minimal
- FEMA flood zone
- X (unshaded)
- Chance of flooding over 30 yrs
- 0.0%
- Est. flood insurance / yr
- $473 – $860
Fire risk 6/10 · Moderate
- Est. fire insurance / yr
- $939 – $1,743
Heat risk 2/10 · Minimal
- Hot days now (above 87°F)
- 7 days/yr
- Hot days in 30 yrs
- 18 days/yr
Wind risk 2/10 · Minimal
- Chance of severe wind over 30 yrs
- —
Air-quality risk 1/10 · Minimal
- Unhealthy air days now
- 0 days/yr
- Unhealthy air days in 30 yrs
- 0 days/yr
Risk factors via First Street. Map © Google.
Why this score? — see what drove the F grade
The composite is a weighted blend of 9 inputs, each scored 0–100. Each bar is that input's sub-score; the figure is the points it added to the 100-point composite (weight × sub-score).
- Cash flow +8.8/30.0
- ARV discount +8.2/15.0
- Livability +3.9/5.0
- Schools +3.4/10.0
- Rent growth +3.3/5.0
- Condition / age +2.5/5.0
- DSCR +2.4/10.0
- 1% rule +2.0/10.0
- Appreciation +0.0/10.0
$415,000
🖨 Deal sheet (PDF) 📄 Offer letter ✓ Due diligence
Listing remarks MLS
Home is located on a cul-de-sac in a quite low maintenance community. Front yard landscaping and back yard fencing is included. Great open floor plan. 4 bedrooms, 3 bathrooms, 2 car garage, master suite with attached bath and walk in closet. Huge rec room, 2 more bedrooms and full bath in the finished basement.
Key facts
- 4,157 sq ft lot
- 2 garage spots
- Built 2015
Property features AI
Finance
- Financial info: Financing accepted: Cash, Conventional, FHA, VA
- HOA & community: HOA required with monthly fee of $130; HOA covers covenant enforcement, management, and snow removal; Auto sprinkler system maintained by HOA
Exterior
- Parking: Attached 2-car garage; Concrete driveway
- Utilities: Water provided by an association/district; Electricity available
- Home design: Single-family home; Located on a cul-de-sac; Located near a hospital, park, schools, and shopping
- Construction: Wood frame construction; Stucco siding; Composite shingle roof; Full basement (about 95% finished); Existing home
- Exterior features: Concrete patio; Rear fence; Fully landscaped
Interior
- Kitchen: Dishwasher; Garbage disposal; Microwave; Oven; Range (gas/electric); Refrigerator
- Bedrooms: Main floor bedroom; Primary bedroom on the main level
- Flooring: Carpet; Wood
- Bathrooms: Three full bathrooms
- Heating & cooling: Forced air heating (natural gas); Central air conditioning
- Interior features: Carpet and wood floors; Wood entry; Fireplace on the main level with a stove-style insert; Kitchen pantry
- Laundry & utility: Washer and dryer included; Laundry on the main floor
Neighborhood map
What this means for you Summary
Snapshot
- This is a 4-bed/3.0-bath single-family listed at $415k.
Deal economics
- At list price, monthly cash flow is $-345 ($-4k/yr) — negative.
- To cash-flow at today's rent, offer at most $354k (14.7% below list).
- To meet the 1% rule (rent ≥ 1% of price), the offer needs to be $291k (29.8% below list).
- Recommended offer: $291k (29.8% below list) — sets the bar for 1% rule.
- Cap rate 5.3% vs local median 3.3% in Colorado Springs — top-decile yield for the area; either an underpriced asset or a hidden risk that comps aren't pricing in. Stress-test before assuming the spread holds.
Location & tenants
- Location reads 78/100 on livability (#23 in CO, #2,639 nationally) — a middle-class / working-renter tenant base. Strengths: amenities A+, housing A+, health & safety A+; Watch: cost of living C-, crime F.
- El Paso County Colorado School District 49 (urban): math 27% / reading 47% proficiency, ranked #27 of 86 in CO (top 31%) — families likely to look elsewhere, expect single-tenant / working-renter base with shorter leases; only 17% free/reduced lunch — higher-income household profile.
- Zoned schools: Woodmen Hills Elementary School (math 24% / reading 64%, grade F, #277 of 966 statewide, top 31%, 609 students, 24% FRL); Falcon Middle School (math 17% / reading 37%, grade F, #154 of 270 statewide, top 59%, 937 students, 27% FRL); Falcon High School (math 32% / reading 67%, grade D, #115 of 381 statewide, top 34%, 1,248 students, 23% FRL).
- Market conditions: Rents rising (+3.1%/yr); 523 active listings in the ZIP; 7 comparable units currently listed for rent nearby; rentals leasing fast (median 5d on market — plan ~1-2 weeks tenant-placement turnaround); high-income renter base; 3,906 units permitted in El Paso County in 2024 (872 in 5+ unit buildings).
Forward outlook
- Local home prices are declining (-3.0%/yr); year-one equity from $3k of loan paydown is wiped out by about $12k of value loss. Plan a longer hold.
- El Paso County population projected at +28% by 2050 — long-run rental-demand tailwind backs the buy-and-hold thesis.
Negotiation context
- Only 9 days on market — expect competitive offers; lowballing is unlikely to land.
- 2 sale attempts since 11y ago with the ask held roughly flat each time — persistent listings suggest the price (not the market) is what's stuck; bring a comps-based counter.
- Current owner paid $355k; 17% above their basis — modest negotiation headroom, anchor on the comps not their cost.
Risks & watch-outs
- Climate carrying-cost: major wildfire risk — expect insurance premiums to compound above CPI over the hold.
Questions for the listing agent
- What do current leases actually rent for vs. the listed asking? Can we see a recent rent roll and the last 12 months of T-12 income?
- What does the HOA fee cover, when was the last increase, and are there any pending special assessments or reserve-fund shortfalls?
- Is there a deadline driving the sale (1031 exchange, divorce, estate, relocation)? That informs how much negotiation room exists.
- Schools are B-rated — typically a magnet for longer-tenancy family renters. What's the average tenant stay here, and is there a school-zone premium baked into asking?
- Crime grade is F in this area — have there been break-ins, vandalism, or insurance claims at this property in the last 3 years? What carrier currently insures it and at what premium?
- The area grade is low — what's the realistic commute time and amenity access for the typical tenant pool here? Any planned neighborhood developments (good or bad) we should know about?
- What's the average days-on-market for RENTAL listings here right now (not sales)? A rising rental-DOM trend means longer vacancies and softer asking-rent achievability than the comps imply.
- What's the recent tenant-quality profile in this submarket — average credit score on applications, eviction rate, late-payment / NSF rate, and stable-employment percentage? A property-management company in the area should have these aggregated.
- How much new for-sale + rental construction is in the pipeline within 1–3 miles? Heavy new supply typically softens prices + rents 12–24 months out; constrained supply supports both.
Investment metrics
- 1% rule
- 0.70% ✗
- Cap rate
- 5.29%
- Cash-on-cash
- -3.57%
- DSCR
- 0.84
- GRM
- 11.9
CMA / ARV
- ARV (median comp)
- $421,402
- List price
- $415,000
- Delta
- -1.52%
- Verdict
- FAIR
- Comps
- 20 within 1.0 mi
Show comp detail 12 sales within ~0.75 mi
| Address | Dist | Beds/Ba | Sqft | Sold | Price | $/sf | Match |
|---|---|---|---|---|---|---|---|
| 11324 Neutra Grv | 0.09mi | 4/3.0 | 2,442 (+6%) | 5mo | $420,000 | $172 | 82 |
| 7802 Hirshorn Pt | 0.19mi | 3/2.5 (-1) | 2,266 (-2%) | 5mo | $425,000 | $188 | 77 |
| 11584 Louvre Pt | 0.09mi | 3/2.5 (-1) | 2,218 (-4%) | 6mo | $372,000 | $168 | 77 |
| 11649 Shaolin Grv | 0.13mi | 3/3.0 (-1) | 2,064 (-11%) | 6mo | $295,000 | $143 | 66 |
| 7751 Berwyn Loop | 0.57mi | 3/2.5 (-1) | 2,266 (-2%) | 1mo | $475,000 | $210 | 63 |
| 7791 Berwyn Loop | 0.57mi | 3/3.0 (-1) | 2,266 (-2%) | 5mo | $444,000 | $196 | 61 |
| 7313 Owings Pt | 0.65mi | 4/4.0 | 2,404 (+4%) | 1mo | $435,000 | $181 | 58 |
| 11751 Sedge | 0.56mi | 3/3.0 (-1) | 2,123 (-8%) | 2mo | $442,000 | $208 | 54 |
| 8250 Henzlee Pl | 0.73mi | 3/2.5 (-1) | 2,199 (-5%) | 4mo | $515,575 | $234 | 48 |
| 12093 Merrill Hts | 0.65mi | 4/3.0 | 2,000 (-13%) | 2mo | $350,000 | $175 | 45 |
| 10922 Jolie Ct | 0.72mi | 3/2.5 (-1) | 2,066 (-10%) | 3mo | $523,000 | $253 | 39 |
| 8173 Isabel Pl | 0.75mi | 3/2.5 (-1) | 2,066 (-10%) | 6mo | $488,285 | $236 | 36 |
Match score weights: distance 35% · size 25% · config 20% · recency 20%. Top-matched comps best support the ARV.
Projected returns pro-forma
-3.0% appreciation · 3.09% rent growth · sell at horizon
- IRR
- -22.2%
- Equity multiple
- 0.23×
- Total profit
- $-89,072
- Equity at exit
- $61,878
- IRR
- -16.1%
- Equity multiple
- 0.09×
- Total profit
- $-105,175
- Equity at exit
- $35,882
Cash invested: $116,200 (down + closing). Projections, not guarantees.
Landlord ↔ Tenant lean methodology
- Overall (STATE)
- 38 Tenant-Leaning
- State Colorado
- 38 Tenant-Leaning · D+4
- County
- — inherits STATE
- City
- — inherits STATE
ZIP-level market 80831
- Home prices YoY
- -30.4%
- Rents YoY
- 3.1%
- Active inventory
- 523
- Price-to-rent
- 11.9×
Monthly cashflow live
- Estimated rent
- $2,913 high interval (Pro) →
- Mortgage (P&I)
- −$2,176
- Tax from tax record
- −$167 /mo · $2,009/yr
- Insurance
- −$173
- HOA
- −$130
- Vacancy / Maint / Mgmt
- −$612
- Net cashflow
- $-345
Break-even live
Sensitivity live
| Price | -10% $-110 | -5% $-228 | +0% $-345 | +5% $-463 | +10% $-580 |
|---|---|---|---|---|---|
| Rent | -10% $-575 | -5% $-460 | +0% $-345 | +5% $-230 | +10% $-115 |
| Rate | -1.0pp $-136 | -0.5pp $-240 | base $-345 | +0.5pp $-453 | +1.0pp $-562 |
UW: 25.0% down · 7.5% · 30yr · 1.5% tax · 5.0% vac · 8.0% maint · 8.0% mgmt
Financing live
Cash to close
- Down payment
- $103,750
- Closing costs
- $12,450
- Reserves months
- —
- Total cash needed
- —
Loan-product check · same deal, 3 products live
Conventional
25% down · 7.5% · 30yr
- Down + closing
- —
- Monthly P&I
- —
- Monthly cashflow
- —
- DSCR
- —
- Eligible?
- —
Personal DTI + credit; lowest rate.
DSCR
20% down · 8.5% · 30yr
- Down + closing
- —
- Monthly P&I
- —
- Monthly cashflow
- —
- DSCR
- —
- Eligible?
- —
No personal income docs; deal must DSCR.
Hard money
10% down · 12.0% · 12mo
- Down + closing
- —
- Monthly P&I
- —
- Monthly cashflow
- —
- DSCR
- —
- Eligible?
- —
Short-term bridge; refi at stabilization.
Rent comps 7 comps
| Address | Beds | Baths | Sqft | Rent | $/sqft | DOM | Units | Dist |
|---|---|---|---|---|---|---|---|---|
| 11663 Ducal Pt Peyton, CO | 3.0 | 3.0 | 1600 | $2,380 | $1.49 | 4d | 1 | 0.16mi |
| 11482 Moonrock Hts Peyton, CO | 4.0 | 1.0 | 2266 | $2,750 | $1.21 | 4d | 1 | 0.21mi |
| 7553 Jaoul Pt Peyton, CO | 3.0 | 2.5 | 1639 | $2,300 | $1.40 | 4d | 1 | 0.53mi |
| 7146 Honeycomb Dr Peyton, CO | 3.0 | 2.0 | 1784 | $2,400 | $1.35 | 4d | 1 | 0.65mi |
| 7559 Coffee Rd Peyton, CO | 3.0 | 3.0 | 2510 | $2,395 | $0.95 | 4d | 1 | 0.82mi |
| 6628 Watusi Rd Unit 1 Peyton, CO | 3.0 | 2.5 | 1735 | $1,995 | $1.15 | 4d | 1 | 0.93mi |
| 6628 Watusi Rd Peyton, CO | 3.0 | 3.0 | 1735 | $1,995 | $1.15 | 4d | 1 | 0.93mi |
HOA detail
- Monthly dues
- $130 · $1,560/yr
- Likely covers
- landscaping
Listing history 7 events
-
2026-05-17status Pending 1102-char remark
-
2026-05-08$415,000 Active 1102-char remark
-
2020-09-03soldstatus $355,000
-
2016-06-16soldstatus $250,000 Sold 314-char remark
Show marketing remark (314 chars)
Home is located on a cul-de-sac in a quite low maintenance community. Front yard landscaping and back yard fencing is included. Great open floor plan. 4 bedrooms, 3 bathrooms, 2 car garage, master suite with attached bath and walk in closet. Huge rec room, 2 more bedrooms and full bath in the finished basement.
-
2016-02-09status Under Contract 314-char remark
Show marketing remark (314 chars)
Home is located on a cul-de-sac in a quite low maintenance community. Front yard landscaping and back yard fencing is included. Great open floor plan. 4 bedrooms, 3 bathrooms, 2 car garage, master suite with attached bath and walk in closet. Huge rec room, 2 more bedrooms and full bath in the finished basement.
-
2015-11-02price $250,000 314-char remark
Show marketing remark (314 chars)
Home is located on a cul-de-sac in a quite low maintenance community. Front yard landscaping and back yard fencing is included. Great open floor plan. 4 bedrooms, 3 bathrooms, 2 car garage, master suite with attached bath and walk in closet. Huge rec room, 2 more bedrooms and full bath in the finished basement.
-
2015-10-14$259,332 Active 314-char remark
Show marketing remark (314 chars)
Home is located on a cul-de-sac in a quite low maintenance community. Front yard landscaping and back yard fencing is included. Great open floor plan. 4 bedrooms, 3 bathrooms, 2 car garage, master suite with attached bath and walk in closet. Huge rec room, 2 more bedrooms and full bath in the finished basement.
ⓘ Source: listings_history table (triggers on properties + properties_extension) + one-shot
backfill from property_details.listing_events for pre-trigger history.
Tax reassessment forecast CO · Resets to sale price
- Current annual tax
- $2,009 · $167/mo
- Projected year-2 tax
- $2,282 · $190/mo
- Expected delta
- +$274/yr (+$23/mo · 13.6%)
ⓘ Screening estimate from a state-policy table — verify with the county assessor before closing.
Climate risk First Street
- Flood 1/10 Low FEMA zone X (unshaded) · 0% chance over 30 yrs
- Wildfire 6/10 Major
- Heat 2/10 Low 7 d/yr ≥87°F today · 18 d/yr by 30 yrs out
- Wind 2/10 Low
- Air quality 1/10 Low 0 unhealthy d/yr today · 0 by 30 yrs out
Nearby sold comps map
Loading sold comps map…
Walkable amenities ~0.75 mi
Loading nearby amenities…
Taxation est. · year 1
- Rental income
- $34,956
- − Mortgage interest
- −$23,246
- − Property taxes
- −$2,009
- − Insurance
- −$2,075
- − Repairs & maintenance
- −$2,796
- − Management
- −$2,796
- − HOA
- −$1,560
- − Depreciation
- −$12,073
- Taxable loss
- −$11,600
- Est. tax savings @ 24.0%
- +$2,784
- After-tax cash flow
- $-1,360/yr
For passive investors: Depreciation is non-cash, so a rental often shows a tax loss while cash-flowing — sheltering income. Rental losses are passive: they offset passive income freely, and up to $25,000/yr can offset ordinary (W-2) income if you actively participate and your MAGI is under $100k (phasing out to $0 by $150k); unused losses carry forward. On sale, claimed depreciation is recaptured at up to 25%, and gains may owe capital-gains tax (a 1031 exchange can defer both). Figures are a year-1 estimate at your 24.0% rate — not tax advice; consult a CPA.
Schools (NCES district)
- District
- El Paso County Colorado School District 49
- NCES district ID
- 0803870
- Math proficiency
- 27% ▼ -4.00%
- Reading proficiency
- 47% ▼ -1.00%
- Median HH income
- $75,604
- Composite
- 34.38/100
- National rank
- #5210
- State rank
- #27 of 86 in CO
Livability — Colorado Springs
- Score
- 78/100
- State rank
- #23
- US rank
- #2639
Category grades
Schools grade is shown separately in the Schools card above.
Census & demographics
- County
- El Paso County · 689,348 people
- City population
- 555,783
- Metro
- Colorado Springs, CO
- Population (ZIP)
- 33,912
- Household income
- $132,467
- Rent vs Own
- Severe rent burden
- 142.0
Population outlook (El Paso County) Hauer SSP2
- Today (2025)
- 768,926 people
- By 2030
- 815,739 · +6.1%
- By 2040
- 903,489 · +17.5%
- By 2050
- 981,204 · +27.6%
- By 2075
- 1,155,542 · +50.3%
- By 2100
- 1,202,070 · +56.3%
Race, ethnicity, and origin ACS 2023
- Neighborhood character
- Predominantly White (73%)
- Race & ethnicity
- White 73% Two or more races 14% Hispanic / Latino 12% Black 4% Asian 2% Native American 1%
- Hispanic origin (detail)
- Mexican 6% Puerto Rican 1%
- Common ancestry
- Italian 4% Slovak 3% Portuguese 3%
- Foreign-born
- 4% · Canada, South Korea
- Languages at home
- 94% English-only · Spanish 5% Other Asian/Pacific 1%
Political lean MEDSL · El Paso
- 2024 margin
- Lean R (+9.8) · D 43.8% · R 53.5% · Other 2.7%
- 2008→2024 swing
- +9.0pp toward D · 2008: -18.8pp · 2024: -9.8pp
- All cycles
- 2024: R+9.8 2020: R+10.8 2016: R+22.6 2012: R+21.4 2008: R+18.8
Not yet ingested
- Civics
- —
Market trends
- HPI YoY
- ▼ -115.34%
- Current HPI
- 264.0763
- Rent YoY
- ▲ 3.09%
- Metro
- Colorado Springs, CO
- State GDP YoY
- ▲ 1.95%
- F500 in state
- 14
Industry mix (Fortune 500 HQ in CO)
| Industry | F500 HQs | Revenue |
|---|---|---|
| Technology Distribution | 1 | $31B |
|
||
| Food / Agriculture | 1 | $18B |
|
||
| Packaging | 1 | $14B |
|
||
| Healthcare | 1 | $13B |
|
||
| Energy | 1 | $10B |
|
||
| Technology | 1 | $4B |
|
||
Price history
+60.0% since first listed7 events — show timeline
- 2026-05-17 Pending — elevateMLS
- 2026-05-08 Listed $415,000 elevateMLS
- 2020-09-03 Sold (Public Records) $355,000 Public Records
- 2016-06-16 Sold (MLS) $250,000 REColorado as Distributed by MLS Grid
- 2016-02-09 Pending — REColorado as Distributed by MLS Grid
- 2015-11-02 Price Changed $250,000 REColorado as Distributed by MLS Grid
- 2015-10-14 Listed $259,332 REColorado as Distributed by MLS Grid
Property tax history
+16.7%/yrLatest (2025): $2,009 · +10.1% YoY. Source: county tax records.
Cash-flow waterfall
monthlySold comps — $/sqft
last 12 mo · ≤1 miLoading sold comps…