 🏗️ New Construction
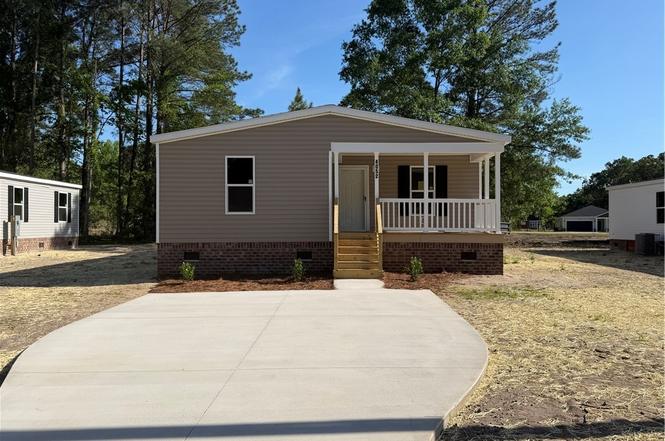
4056 Lodge Dr · Wade, NC
Flood risk No data
- FEMA flood zone
- —
- Chance of flooding over 30 yrs
- —
- Est. flood insurance / yr
- —
Fire risk No data
- Est. fire insurance / yr
- —
Heat risk No data
- Hot days now (above threshold)
- —
- Hot days in 30 yrs
- —
Wind risk No data
- Chance of severe wind over 30 yrs
- —
Air-quality risk No data
- Unhealthy air days now
- —
- Unhealthy air days in 30 yrs
- —
Risk factors via First Street. Map © Google.
Why this score? — see what drove the C grade
The composite is a weighted blend of 9 inputs, each scored 0–100. Each bar is that input's sub-score; the figure is the points it added to the 100-point composite (weight × sub-score).
- Cash flow +19.1/30.0
- Appreciation +10.0/10.0
- ARV discount +7.5/15.0
- DSCR +6.0/10.0
- 1% rule +5.1/10.0
- Schools +3.1/10.0
- Livability +2.8/5.0
- Rent growth +2.5/5.0
- Condition / age +2.5/5.0
$189,999
🖨 Deal sheet 📄 Offer letter ✓ Due diligence
Listing remarks
Brand-new manufactured home on a permanent brick foundation. This is not a typical manufactured home and features a large front porch. The interior offers vinyl flooring throughout, three bedrooms, and two full bathrooms. The kitchen is open to the living area and provides ample cabinet storage along with a large walk-in pantry. Fantastic location with easy access to I-295 outer loop, Fort Bragg and Methodist University.
Key facts
- 0.32 acre lot
- Built 2025
- Listed 76 days
Property features AI
Finance
- Other: Lot is cleared and level; Zoned R6A - Residential District; Lot approximately 0.32 acres
Exterior
- Security: Smoke detectors
- Utilities: Public water; Public sewer
- Home design: One-story manufactured home; New construction; Residential property
- Construction: Brick veneer and vinyl siding exterior
- Exterior features: Covered porch
Interior
- Kitchen: Eat-in kitchen with kitchen island; Refrigerator, Dishwasher, Range
- Bedrooms: 5 total rooms (includes bedrooms and living spaces)
- Flooring: Hardwood; Vinyl
- Bathrooms: 2 full bathrooms
- Heating & cooling: Heat pump heating; Electric cooling
- Interior features: Eat-in kitchen; Kitchen island; Skylights; Insulated windows; Refrigerator; Dishwasher; Range
- Laundry & utility: Crawl space basement (utility access)
Neighborhood map
What this means for you Summary
Snapshot
- This is a 3-bed/2.0-bath manufactured listed at $190k.
Deal economics
- At list price, monthly cash flow is $195 ($2k/yr) — positive.
- The deal already cash-flows at list — no discount required.
- To meet the 1% rule (rent ≥ 1% of price), the offer needs to be $187k (1.6% below list).
- Recommended offer: $179k (6.0% below list) — sets the bar for market timing.
- Cap rate 7.6% vs local median 3.8% in Wade — top-decile yield for the area; either an underpriced asset or a hidden risk that comps aren't pricing in. Stress-test before assuming the spread holds.
Location & tenants
- Location reads 55/100 on livability (#650 in NC) — a working-class tenant base; expect higher turnover. Strengths: cost of living A+; Watch: housing D, crime F, amenities F.
- Cumberland County Schools (urban): math 32% / reading 41% proficiency, ranked #126 of 178 in NC (top 71%) — families likely to look elsewhere, expect single-tenant / working-renter base with shorter leases.
- Zoned schools: Mac Williams Middle (math 40% / reading 50%, grade D, #160 of 475 statewide, top 35%, 1,151 students, 58% FRL); Cape Fear High (math 75% / reading 47%, grade C+, #202 of 535 statewide, top 39%, 1,529 students, 50% FRL) — zoned schools at 54% FRL track the district average.
- Zoned-school proficiency averages 53% at this address vs 36% district-wide (+16 pts) — the actual schools serving this property are materially stronger than the Cumberland County Schools average implies; a family-tenant draw the district grade alone would hide.
- Market conditions: 47 active listings in the ZIP; 1,125 units permitted in Cumberland County in 2024 (104 in 5+ unit buildings).
Forward outlook
- In year one you build about $20k of equity ($1k loan paydown + $18k appreciation (9.9% local appreciation)).
- At projected returns (9.9% appreciation + 3.0% rent growth), your $52k cash investment doubles in ~3 years — after that, you're playing with house money.
- By year 2, paydown + projected appreciation supports a ~$32k cash-out refi (75% LTV) — recoverable capital for the next deal without selling this one.
Negotiation context
- It's been on market 76 days — a 6% lower offer ($179k) is reasonable based on typical stale-listing flexibility.
Questions for the listing agent
- It's been on market 76 days. Have you received any prior offers? Is the seller open to a 6% concession, seller financing, or rate buy-down credit?
- Why hasn't it sold? Are there any deal-killer items the seller is aware of (foundation, flood, title, zoning, code violations)?
- Is there a deadline driving the sale (1031 exchange, divorce, estate, relocation)? That informs how much negotiation room exists.
- Schools are D-rated, which usually means shorter tenancies and higher turnover. Who's the typical renter profile here, and what's been the actual vacancy rate?
- Crime grade is F in this area — have there been break-ins, vandalism, or insurance claims at this property in the last 3 years? What carrier currently insures it and at what premium?
- What's the average days-on-market for RENTAL listings here right now (not sales)? A rising rental-DOM trend means longer vacancies and softer asking-rent achievability than the comps imply.
- What's the recent tenant-quality profile in this submarket — average credit score on applications, eviction rate, late-payment / NSF rate, and stable-employment percentage? A property-management company in the area should have these aggregated.
- How much new for-sale + rental construction is in the pipeline within 1–3 miles? Heavy new supply typically softens prices + rents 12–24 months out; constrained supply supports both.
Investment metrics
- 1% rule
- 1.01% ✓
- Cap rate
- 7.56%
- Cash-on-cash
- 4.52%
- DSCR
- 1.20
- GRM
- 8.3
CMA / ARV
- ARV (on-the-fly)
- $185,420
- Comps found
- 11
Show comp detail 11 sales within ~0.75 mi
| Address | Dist | Beds/Ba | Sqft | Sold | Price | $/sf | Match |
|---|---|---|---|---|---|---|---|
| 4057 Lodge Dr | 0.02mi | 3/2.0 | 1,577 (+8%) | 3mo | $185,000 | $117 | 83 |
| 4055 Lodge Dr | 0.02mi | 3/2.0 | 1,577 (+8%) | 3mo | $185,000 | $117 | 83 |
| 4051 Lodge Dr | 0.04mi | 3/2.0 | 1,577 (+8%) | 3mo | $185,000 | $117 | 82 |
| 3911 Mckethan St | 0.31mi | 4/2.0 (+1) | 1,498 (+3%) | 4mo | $192,999 | $129 | 73 |
| 3912 Mckethan (lot 19) St | 0.31mi | 4/2.0 (+1) | 1,456 (-0%) | 14mo | $185,000 | $127 | 68 |
| 3916 Mckethan (lot 20) St | 0.33mi | 4/2.0 (+1) | 1,456 (-0%) | 13mo | $185,000 | $127 | 68 |
| 3934 Mckethan (lot 5) St | 0.42mi | 4/2.0 (+1) | 1,456 (-0%) | 12mo | $185,000 | $127 | 65 |
| 3942 Mckethan (lot 3) St | 0.45mi | 4/2.0 (+1) | 1,456 (-0%) | 12mo | $185,000 | $127 | 64 |
| 3905 Mckethan St | 0.28mi | 4/2.0 (+1) | 1,493 (+2%) | 22mo | $187,000 | $125 | 60 |
| 7572 Dunn Rd | 0.72mi | 3/2.0 | 1,450 (-1%) | 7mo | $250,000 | $172 | 60 |
| 3901 Mckethan St | 0.27mi | 3/2.0 | 1,264 (-13%) | 23mo | $169,000 | $134 | 46 |
Match score weights: distance 35% · size 25% · config 20% · recency 20%. Top-matched comps best support the ARV.
Projected returns pro-forma
9.91% appreciation · 3.0% rent growth · sell at horizon
- IRR
- 27.4%
- Equity multiple
- 3.16×
- Total profit
- $112,308
- Equity at exit
- $165,812
- IRR
- 23.9%
- Equity multiple
- 7.18×
- Total profit
- $320,681
- Equity at exit
- $356,279
Cash invested: $51,918 (down + closing). Projections, not guarantees.
Landlord ↔ Tenant lean methodology
- Overall (STATE)
- 85 Strongly Landlord-Friendly
- State North Carolina
- 85 Strongly Landlord-Friendly · R+3
- County
- — inherits STATE
- City
- — inherits STATE
ZIP-level market 28395
- Home prices YoY
- 3.0%
- Active inventory
- 47
- Price-to-rent
- 8.5×
Monthly cashflow live
- Estimated rent
- $1,869 medium interval (Pro) →
- Mortgage (P&I)
- −$972
- Tax est. 1.5%
- −$232 /mo · $2,781/yr
- Insurance
- −$77
- HOA
- −$0
- Vacancy / Maint / Mgmt
- −$393
- Net cashflow
- $195
Break-even live
UW: 25.0% down · 7.5% · 30yr · 1.5% tax · 5.0% vac · 8.0% maint · 8.0% mgmt
Financing live
Cash to close
- Down payment
- $46,355
- Closing costs
- $5,563
- Reserves months
- —
- Total cash needed
- —
Loan-product check · same deal, 3 products live
Conventional
25% down · 7.5% · 30yr
- Down + closing
- —
- Monthly P&I
- —
- Monthly cashflow
- —
- DSCR
- —
- Eligible?
- —
Personal DTI + credit; lowest rate.
DSCR
20% down · 8.5% · 30yr
- Down + closing
- —
- Monthly P&I
- —
- Monthly cashflow
- —
- DSCR
- —
- Eligible?
- —
No personal income docs; deal must DSCR.
Hard money
10% down · 12.0% · 12mo
- Down + closing
- —
- Monthly P&I
- —
- Monthly cashflow
- —
- DSCR
- —
- Eligible?
- —
Short-term bridge; refi at stabilization.
Listing history 18 events
-
2026-06-18days on market $189,999 Active 76 DOM
-
2026-06-17days on market $189,999 Active 75 DOM
-
2026-06-16days on market $189,999 Active 74 DOM
-
2026-06-15days on market $189,999 Active 73 DOM
-
2026-06-14days on market $189,999 Active 71 DOM
-
2026-06-13days on market $189,999 Active 70 DOM
-
2026-06-10days on market $189,999 Active 68 DOM
-
2026-06-09days on market $189,999 Active 67 DOM
-
2026-06-08days on market $189,999 Active 66 DOM
-
2026-06-07days on market $189,999 Active 65 DOM
-
2026-06-03days on market $189,999 Active 61 DOM
-
2026-06-02days on market $189,999 Active 60 DOM
-
2026-06-01days on market $189,999 Active 59 DOM
-
2026-05-31days on market $189,999 Active 58 DOM
-
2026-05-30pricedays on market $189,999 Active 57 DOM
-
2026-04-27price $199,900
-
2026-04-03status Active
-
2026-01-29historical $210,000
ⓘ Source: listings_history table (triggers on properties + properties_extension) + one-shot
backfill from property_details.listing_events for pre-trigger history.
Nearby sold comps map
Loading sold comps map…
Walkable amenities ~0.75 mi
Loading nearby amenities…
Taxation est. · year 1
- Rental income
- $22,434
- − Mortgage interest
- −$10,386
- − Property taxes
- −$2,781
- − Insurance
- −$927
- − Repairs & maintenance
- −$1,795
- − Management
- −$1,795
- − Depreciation
- −$5,394
- Taxable loss
- −$645
- Est. tax savings @ 24.0%
- +$155
- After-tax cash flow
- $2,500/yr
For passive investors: Depreciation is non-cash, so a rental often shows a tax loss while cash-flowing — sheltering income. Rental losses are passive: they offset passive income freely, and up to $25,000/yr can offset ordinary (W-2) income if you actively participate and your MAGI is under $100k (phasing out to $0 by $150k); unused losses carry forward. On sale, claimed depreciation is recaptured at up to 25%, and gains may owe capital-gains tax (a 1031 exchange can defer both). Figures are a year-1 estimate at your 24.0% rate — not tax advice; consult a CPA.
Schools (NCES district)
- District
- Cumberland County Schools
- NCES district ID
- 3700011
- Math proficiency
- 32% ▼ -2.00%
- Reading proficiency
- 41% ▼ -1.00%
- Median HH income
- $44,168
- Composite
- 31.0/100
- National rank
- #6096
- State rank
- #126 of 178 in NC
Livability — Wade
- Score
- 55/100
- State rank
- #650
- US rank
- #23543
Category grades
Schools grade is shown separately in the Schools card above.
Census & demographics
- Census place
- Wade, NC
- Population (ZIP)
- 2,524
Population outlook (Cumberland County) Hauer SSP2
- Today (2025)
- 330,855 people
- By 2030
- 333,523 · +0.8%
- By 2040
- 335,583 · +1.4%
- By 2050
- 335,325 · +1.4%
- By 2075
- 342,853 · +3.6%
- By 2100
- 340,698 · +3.0%
Race, ethnicity, and origin ACS 2023
- Neighborhood character
- Predominantly White (76%)
- Race & ethnicity
- White 76% Black 12% Hispanic / Latino 4% Two or more races 3%
- Common ancestry
- Slovak 9% Iranian 1% Serbian 1%
- Foreign-born
- 2% · Canada
- Languages at home
- 95% English-only · Spanish 3% Korean 1%
Political lean MEDSL · Cumberland
- 2024 margin
- D (+13.4) · D 56.1% · R 42.7% · Other 1.2%
- 2008→2024 swing
- -4.3pp toward R · 2008: 17.7pp · 2024: 13.4pp
- All cycles
- 2024: D+13.4 2020: D+16.6 2016: D+16.0 2012: D+19.7 2008: D+17.7
Not yet ingested
- Civics
- —
Market trends
- HPI YoY
- ▲ 9.91%
- Current HPI
- 336.2104
- Rent YoY
- —
- Metro
- —
- State GDP YoY
- ▲ 3.28%
- F500 in state
- 26
Industry mix (Fortune 500 HQ in NC)
| Industry | F500 HQs | Revenue |
|---|---|---|
| Financial Services | 2 | $213B |
|
||
| Retail | 2 | $95B |
|
||
| Industrial Conglomerate | 1 | $38B |
|
||
| Metals / Steel | 1 | $35B |
|
||
| Utilities | 1 | $30B |
|
||
| Industrial Machinery | 1 | $19B |
|
||
Price history
-4.8% since first listed3 events — show timeline
- 2026-04-27 Price Changed $199,900 LPRMLS
- 2026-04-03 Relisted — LPRMLS
- 2026-01-29 Coming Soon $210,000 LPRMLS
Cash-flow waterfall
monthlySold comps — $/sqft
last 12 mo · ≤1 miLoading sold comps…