425 Old Monterey Rd · Owenton, KY
Flood risk 1/10 · Minimal
- FEMA flood zone
- X (unshaded)
- Chance of flooding over 30 yrs
- 0.0%
- Est. flood insurance / yr
- $507 – $1,088
Fire risk 3/10 · Minor
- Est. fire insurance / yr
- $839 – $1,559
Heat risk 4/10 · Minor
- Hot days now (above 103°F)
- 7 days/yr
- Hot days in 30 yrs
- 18 days/yr
Wind risk 2/10 · Minimal
- Chance of severe wind over 30 yrs
- 1.0%
Air-quality risk 2/10 · Minimal
- Unhealthy air days now
- 0 days/yr
- Unhealthy air days in 30 yrs
- 1 days/yr
Risk factors via First Street. Map © Google.
Why this score? — see what drove the D grade
The composite is a weighted blend of 9 inputs, each scored 0–100. Each bar is that input's sub-score; the figure is the points it added to the 100-point composite (weight × sub-score).
- Appreciation +10.0/10.0
- Cash flow +9.2/30.0
- ARV discount +7.5/15.0
- Livability +3.1/5.0
- DSCR +2.6/10.0
- Rent growth +2.5/5.0
- Condition / age +2.5/5.0
- Schools +2.4/10.0
- 1% rule +1.7/10.0
$134,900
🖨 Deal sheet 📄 Offer letter ✓ Due diligence
Listing remarks
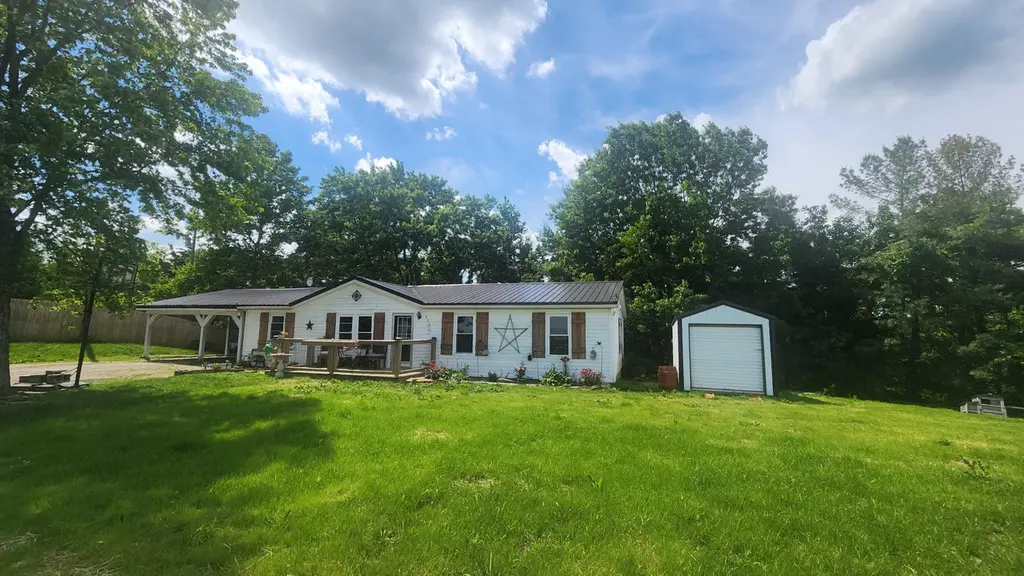
Convenient country living! This 3BR, 2BA manufactured home offers a great location with the peace of the countryside and easy access to city amenities. Recent improvements include a new septic system and leach lines, newer windows, new subflooring, and a 5-year-old roof. While some TLC and cosmetic updates remain, many major improvements have already been completed. Move in and finish it to your taste while building equity. Great opportunity for homeowners or investors alike! Interior pics still to come.
Key facts
- 5 year old roof
- Great location
- New septic system
Tags
Property features AI
Exterior
- Parking: Carport; Driveway
- Utilities: Public water; Septic tank
- Home design: Single family residence; Manufactured double-wide home; One level
- Construction: Vinyl siding; Block foundation and mobile home base; Built as a manufactured house
- Exterior features: Vinyl frames on windows; Metal roof; County road frontage
Interior
- Kitchen: Electric cooktop, electric oven, refrigerator
- Bedrooms: Primary bedroom; Bedroom 2; Bedroom 3
- Bathrooms: 2 full bathrooms
- Heating & cooling: Heat pump; Forced air heating; Central air and window unit cooling
- Interior features: Electric cooktop, electric oven, refrigerator; Living room, dining room, den
Neighborhood map
What this means for you Summary
Snapshot
- This is a 3-bed/2.0-bath other listed at $135k.
Deal economics
- At list price, monthly cash flow is $-102 ($-1k/yr) — negative.
- To cash-flow at today's rent, offer at most $117k (13.4% below list).
- To meet the 1% rule (rent ≥ 1% of price), the offer needs to be $91k (32.6% below list).
- Recommended offer: $91k (32.6% below list) — sets the bar for 1% rule.
- Cap rate 5.4% vs local median 1.4% in Owenton — top-decile yield for the area; either an underpriced asset or a hidden risk that comps aren't pricing in. Stress-test before assuming the spread holds.
Location & tenants
- Location reads 62/100 on livability (#355 in KY) — a middle-class / working-renter tenant base. Strengths: crime A+, cost of living A+, housing A+; Watch: amenities F, commute F, employment F.
- Owen County (rural): math 24% / reading 32% proficiency, ranked #120 of 165 in KY (top 73%) — low school quality limits family demand, transient renter base, plan for 1-2y turnover.
- Zoned schools: Owen County Elementary/Primary School (math 27% / reading 35%, grade F, #378 of 676 statewide, top 57%, 690 students, 62% FRL); Maurice Bowling Middle School (math 22% / reading 33%, grade F, #168 of 217 statewide, top 78%, 484 students, 62% FRL); Owen County High School (math 27% / reading 27%, grade F, #158 of 254 statewide, top 68%, 558 students, 53% FRL).
- Market conditions: 100 active listings in the ZIP; 18 units permitted in Owen County in 2024 (0 in 5+ unit buildings).
Forward outlook
- In year one you build about $14k of equity ($933 loan paydown + $13k appreciation (10.0% local appreciation)).
- Owen County population projected at -14% by 2050 — secular population decline; favor cash flow + early exit over multi-decade hold.
- By year 3, paydown + projected appreciation supports a ~$37k cash-out refi (75% LTV) — recoverable capital for the next deal without selling this one.
Negotiation context
- Only 11 days on market — expect competitive offers; lowballing is unlikely to land.
Questions for the listing agent
- What do current leases actually rent for vs. the listed asking? Can we see a recent rent roll and the last 12 months of T-12 income?
- Is there a deadline driving the sale (1031 exchange, divorce, estate, relocation)? That informs how much negotiation room exists.
- Schools are F-rated, which usually means shorter tenancies and higher turnover. Who's the typical renter profile here, and what's been the actual vacancy rate?
- The area grade is low — what's the realistic commute time and amenity access for the typical tenant pool here? Any planned neighborhood developments (good or bad) we should know about?
- What's the average days-on-market for RENTAL listings here right now (not sales)? A rising rental-DOM trend means longer vacancies and softer asking-rent achievability than the comps imply.
- What's the recent tenant-quality profile in this submarket — average credit score on applications, eviction rate, late-payment / NSF rate, and stable-employment percentage? A property-management company in the area should have these aggregated.
- How much new for-sale + rental construction is in the pipeline within 1–3 miles? Heavy new supply typically softens prices + rents 12–24 months out; constrained supply supports both.
Investment metrics
- 1% rule
- 0.67% ✗
- Cap rate
- 5.38%
- Cash-on-cash
- -3.25%
- DSCR
- 0.86
- GRM
- 12.4
CMA / ARV
No comps found within radius.
Projected returns pro-forma
10.0% appreciation · 3.0% rent growth · sell at horizon
- IRR
- 21.9%
- Equity multiple
- 2.77×
- Total profit
- $66,897
- Equity at exit
- $121,529
- IRR
- 19.7%
- Equity multiple
- 6.35×
- Total profit
- $202,019
- Equity at exit
- $262,081
Cash invested: $37,772 (down + closing). Projections, not guarantees.
Landlord ↔ Tenant lean methodology
- Overall (STATE)
- 83 Strongly Landlord-Friendly
- State Kentucky
- 83 Strongly Landlord-Friendly · R+16
- County
- — inherits STATE
- City
- — inherits STATE
ZIP-level market 40359
- Home prices YoY
- 8.3%
- Active inventory
- 100
- Price-to-rent
- 12.4×
Monthly cashflow live
- Estimated rent
- $910 medium interval (Pro) →
- Mortgage (P&I)
- −$707
- Tax from tax record
- −$57 /mo · $689/yr
- Insurance
- −$56
- HOA
- −$0
- Vacancy / Maint / Mgmt
- −$191
- Net cashflow
- $-102
Break-even live
UW: 25.0% down · 7.5% · 30yr · 1.5% tax · 5.0% vac · 8.0% maint · 8.0% mgmt
Financing live
Cash to close
- Down payment
- $33,725
- Closing costs
- $4,047
- Reserves months
- —
- Total cash needed
- —
Loan-product check · same deal, 3 products live
Conventional
25% down · 7.5% · 30yr
- Down + closing
- —
- Monthly P&I
- —
- Monthly cashflow
- —
- DSCR
- —
- Eligible?
- —
Personal DTI + credit; lowest rate.
DSCR
20% down · 8.5% · 30yr
- Down + closing
- —
- Monthly P&I
- —
- Monthly cashflow
- —
- DSCR
- —
- Eligible?
- —
No personal income docs; deal must DSCR.
Hard money
10% down · 12.0% · 12mo
- Down + closing
- —
- Monthly P&I
- —
- Monthly cashflow
- —
- DSCR
- —
- Eligible?
- —
Short-term bridge; refi at stabilization.
Listing history 10 events
-
2026-06-09status $134,900 Pending 11 DOM
-
2026-06-08days on market $134,900 Active 11 DOM
-
2026-06-07days on market $134,900 Active 10 DOM
-
2026-06-05days on market $134,900 Active 7 DOM
-
2026-06-03days on market $134,900 Active 6 DOM
-
2026-06-02days on market $134,900 Active 5 DOM
-
2026-06-01days on market $134,900 Active 4 DOM
-
2026-05-31days on market $134,900 Active 3 DOM
-
2026-05-30days on market $134,900 Active 2 DOM
-
2026-05-28$134,900 Active
ⓘ Source: listings_history table (triggers on properties + properties_extension) + one-shot
backfill from property_details.listing_events for pre-trigger history.
Tax reassessment forecast KY · Resets to sale price
- Current annual tax
- $689 · $57/mo
- Projected year-2 tax
- $1,160 · $97/mo
- Expected delta
- +$471/yr (+$39/mo · 68.3%)
ⓘ Screening estimate from a state-policy table — verify with the county assessor before closing.
Climate risk First Street
- Flood 1/10 Low FEMA zone X (unshaded) · 0% chance over 30 yrs
- Wildfire 3/10 Moderate
- Heat 4/10 Moderate 7 d/yr ≥103°F today · 18 d/yr by 30 yrs out
- Wind 2/10 Low 100% chance of damaging wind over 30 yrs
- Air quality 2/10 Low 0 unhealthy d/yr today · 1 by 30 yrs out
Nearby sold comps map
Loading sold comps map…
Walkable amenities ~0.75 mi
Loading nearby amenities…
Taxation est. · year 1
- Rental income
- $10,917
- − Mortgage interest
- −$7,556
- − Property taxes
- −$689
- − Insurance
- −$674
- − Repairs & maintenance
- −$873
- − Management
- −$873
- − Depreciation
- −$3,924
- Taxable loss
- −$3,674
- Est. tax savings @ 24.0%
- +$882
- After-tax cash flow
- $-346/yr
For passive investors: Depreciation is non-cash, so a rental often shows a tax loss while cash-flowing — sheltering income. Rental losses are passive: they offset passive income freely, and up to $25,000/yr can offset ordinary (W-2) income if you actively participate and your MAGI is under $100k (phasing out to $0 by $150k); unused losses carry forward. On sale, claimed depreciation is recaptured at up to 25%, and gains may owe capital-gains tax (a 1031 exchange can defer both). Figures are a year-1 estimate at your 24.0% rate — not tax advice; consult a CPA.
Schools (NCES district)
- District
- Owen County
- NCES district ID
- 2104560
- Math proficiency
- 24% ▼ -19.00%
- Reading proficiency
- 32% ▼ -18.00%
- Median HH income
- $42,943
- Composite
- 23.84/100
- National rank
- #7804
- State rank
- #120 of 165 in KY
Livability — Owenton
- Score
- 62/100
- State rank
- #355
- US rank
- #16856
Category grades
Schools grade is shown separately in the Schools card above.
Census & demographics
- Population (ZIP)
- 7,222
Population outlook (Owen County) Hauer SSP2
- Today (2025)
- 10,496 people
- By 2030
- 10,251 · -2.3%
- By 2040
- 9,650 · -8.1%
- By 2050
- 8,984 · -14.4%
- By 2075
- 7,589 · -27.7%
- By 2100
- 6,380 · -39.2%
Race, ethnicity, and origin ACS 2023
- Neighborhood character
- Predominantly White (97%)
- Race & ethnicity
- White 97% Two or more races 2%
- Common ancestry
- Lithuanian 2% Slovak 2% Italian 1%
- Foreign-born
- 0%
- Languages at home
- 99% English-only · Spanish 1%
Political lean MEDSL · Owen
- 2024 margin
- Solid R (+62.7) · D 18.0% · R 80.7% · Other 1.3%
- 2008→2024 swing
- -35.9pp toward R · 2008: -26.8pp · 2024: -62.7pp
- All cycles
- 2024: R+62.7 2020: R+58.5 2016: R+53.7 2012: R+32.3 2008: R+26.8
Not yet ingested
- Civics
- —
Market trends
- HPI YoY
- ▲ 16.56%
- Current HPI
- 215.21
- Rent YoY
- —
- Metro
- —
- State GDP YoY
- ▲ 1.81%
- F500 in state
- 4
Industry mix (Fortune 500 HQ in KY)
| Industry | F500 HQs | Revenue |
|---|---|---|
| Healthcare | 1 | $118B |
|
||
| Food / Beverage | 1 | $7B |
|
||
Price history
1 event — show timeline
- 2026-05-28 Listed $134,900 NKMLS
Property tax history
+21.8%/yrLatest (2025): $689 · +2.6% YoY. Source: county tax records.
Cash-flow waterfall
monthlySold comps — $/sqft
last 12 mo · ≤1 miLoading sold comps…