3357 SW Raymo Rd · Boardman, MI
Flood risk 1/10 · Minimal
- FEMA flood zone
- X
- Chance of flooding over 30 yrs
- 0.0%
- Est. flood insurance / yr
- $473 – $860
Fire risk 4/10 · Minor
- Est. fire insurance / yr
- $784 – $1,456
Heat risk 1/10 · Minimal
- Hot days now (above 92°F)
- 7 days/yr
- Hot days in 30 yrs
- 14 days/yr
Wind risk 1/10 · Minimal
- Chance of severe wind over 30 yrs
- —
Air-quality risk 2/10 · Minimal
- Unhealthy air days now
- 0 days/yr
- Unhealthy air days in 30 yrs
- 1 days/yr
Risk factors via First Street. Map © Google.
Why this score? — see what drove the D+ grade
The composite is a weighted blend of 9 inputs, each scored 0–100. Each bar is that input's sub-score; the figure is the points it added to the 100-point composite (weight × sub-score).
- Cash flow +14.2/30.0
- Appreciation +10.0/10.0
- ARV discount +7.5/15.0
- DSCR +4.3/10.0
- 1% rule +2.8/10.0
- Rent growth +2.5/5.0
- Livability +2.5/5.0
- Condition / age +2.5/5.0
- Schools +2.0/10.0
$139,900
🖨 Deal sheet 📄 Offer letter ✓ Due diligence
Listing remarks MLS
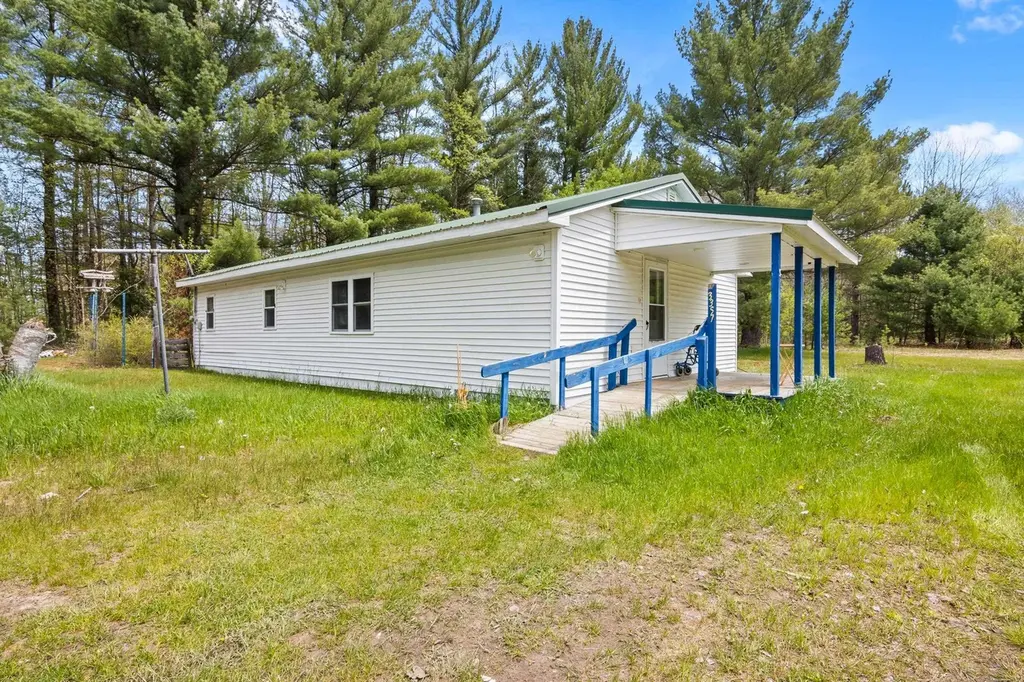
Opportunity awaits at 3357 Raymo Rd SW in South Boardman! Situated on approximately 5 beautiful acres with pine trees and a peaceful setting, this 3 bedroom, 1 bathroom home offers convenient single-level living with roughly 1,100 square feet of space. Recent exterior updates include newer siding, windows, septic, and doors, while the interior has been cleaned out and is ready for its next owner. Move in as-is or bring your vision and make additional updates and improvements to truly make it your own. Features include natural gas, a covered porch, ramp access, and a low-threshold shower for added accessibility and convenience. Located just a short distance from US-131, this property offers easy access to Traverse City, Kalkaska, South Boardman, and Cadillac while still enjoying a quiet country atmosphere. Whether you are looking for a primary residence, investment opportunity, remodel project, or a great future build site, this property offers endless potential and flexibility for a variety of uses.
Key facts
- Covered porch
- Newer doors
- Newer siding
Tags
Property features AI
Exterior
- Utilities: Private well water; Septic system; Natural gas
- Home design: One-story residential home; Built in 1970
- Construction: Vinyl siding exterior; Crawl foundation
- Exterior features: Wooded lot; Gravel road access
Interior
- Kitchen: Kitchen on the main level (approx. 11 x 12); Range/Oven; Refrigerator; Dishwasher
- Bedrooms: Three bedrooms on the main level (approx. 10 x 12; 10 x 11; 11 wide)
- Bathrooms: One full bathroom on the main level
- Heating & cooling: Forced air heating; Natural gas heat/fuel; Gas water heater
- Interior features: Accessible entrance; Porch
- Laundry & utility: Main-level laundry room (approx. 8 x 10); Washer; Dryer
Neighborhood map
What this means for you Summary
Snapshot
- This is a 3-bed/1.0-bath single-family listed at $140k.
Deal economics
- At list price, monthly cash flow is $22 ($262/yr) — positive.
- The deal already cash-flows at list — no discount required.
- To meet the 1% rule (rent ≥ 1% of price), the offer needs to be $109k (21.9% below list).
- Recommended offer: $109k (21.9% below list) — sets the bar for 1% rule.
Location & tenants
- Location reads: area grade D — affects rentability + tenant quality, not the cash-flow math above.
- Forest Area Community Schools (rural): math 16% / reading 31% proficiency, ranked #438 of 540 in MI (top 81%) — low school quality limits family demand, transient renter base, plan for 1-2y turnover.
- Market conditions: 25 active listings in the ZIP; 38 units permitted in Kalkaska County in 2024 (0 in 5+ unit buildings).
Forward outlook
- In year one you build about $15k of equity ($967 loan paydown + $14k appreciation (10.0% local appreciation)).
- Kalkaska County population projected to shrink 9% by 2050 — rents likely to lag national; underwrite the cash flow, not the appreciation.
- At projected returns (10.0% appreciation + 3.0% rent growth), your $39k cash investment doubles in ~3 years — after that, you're playing with house money.
- By year 3, paydown + projected appreciation supports a ~$38k cash-out refi (75% LTV) — recoverable capital for the next deal without selling this one.
Negotiation context
- It's been on market 26 days — a 2% lower offer ($138k) is reasonable based on typical stale-listing flexibility.
- 2 sale attempts with the ask held roughly flat each time — persistent listings suggest the price (not the market) is what's stuck; bring a comps-based counter.
Questions for the listing agent
- Built in 1970 — when were the roof, HVAC, electrical panel, plumbing, and water heater last replaced?
- Is there a deadline driving the sale (1031 exchange, divorce, estate, relocation)? That informs how much negotiation room exists.
- The area grade is low — what's the realistic commute time and amenity access for the typical tenant pool here? Any planned neighborhood developments (good or bad) we should know about?
- What's the average days-on-market for RENTAL listings here right now (not sales)? A rising rental-DOM trend means longer vacancies and softer asking-rent achievability than the comps imply.
- What's the recent tenant-quality profile in this submarket — average credit score on applications, eviction rate, late-payment / NSF rate, and stable-employment percentage? A property-management company in the area should have these aggregated.
- How much new for-sale + rental construction is in the pipeline within 1–3 miles? Heavy new supply typically softens prices + rents 12–24 months out; constrained supply supports both.
Investment metrics
- 1% rule
- 0.78% ✗
- Cap rate
- 6.48%
- Cash-on-cash
- 0.67%
- DSCR
- 1.03
- GRM
- 10.7
CMA / ARV
No comps found within radius.
Projected returns pro-forma
10.0% appreciation · 3.0% rent growth · sell at horizon
- IRR
- 24.7%
- Equity multiple
- 2.98×
- Total profit
- $77,526
- Equity at exit
- $126,033
- IRR
- 21.8%
- Equity multiple
- 6.80×
- Total profit
- $227,085
- Equity at exit
- $271,795
Cash invested: $39,172 (down + closing). Projections, not guarantees.
Landlord ↔ Tenant lean methodology
- Overall (STATE)
- 62 Landlord-Friendly
- State Michigan
- 62 Landlord-Friendly · EVEN
- County
- — inherits STATE
- City
- — inherits STATE
ZIP-level market 49680
- Home prices YoY
- 4.3%
- Active inventory
- 25
- Price-to-rent
- 10.7×
Monthly cashflow live
- Estimated rent
- $1,093 medium interval (Pro) →
- Mortgage (P&I)
- −$734
- Tax from tax record
- −$50 /mo · $594/yr
- Insurance
- −$58
- HOA
- −$0
- Vacancy / Maint / Mgmt
- −$229
- Net cashflow
- $22
Break-even live
UW: 25.0% down · 7.5% · 30yr · 1.5% tax · 5.0% vac · 8.0% maint · 8.0% mgmt
Financing live
Cash to close
- Down payment
- $34,975
- Closing costs
- $4,197
- Reserves months
- —
- Total cash needed
- —
Loan-product check · same deal, 3 products live
Conventional
25% down · 7.5% · 30yr
- Down + closing
- —
- Monthly P&I
- —
- Monthly cashflow
- —
- DSCR
- —
- Eligible?
- —
Personal DTI + credit; lowest rate.
DSCR
20% down · 8.5% · 30yr
- Down + closing
- —
- Monthly P&I
- —
- Monthly cashflow
- —
- DSCR
- —
- Eligible?
- —
No personal income docs; deal must DSCR.
Hard money
10% down · 12.0% · 12mo
- Down + closing
- —
- Monthly P&I
- —
- Monthly cashflow
- —
- DSCR
- —
- Eligible?
- —
Short-term bridge; refi at stabilization.
Listing history 17 events
-
2026-06-18days on market $139,900 Active 26 DOM
-
2026-06-17days on market $139,900 Active 25 DOM
-
2026-06-16days on market $139,900 Active 24 DOM
-
2026-06-15days on market $139,900 Active 23 DOM
-
2026-06-13days on market $139,900 Active 21 DOM
-
2026-06-12days on market $139,900 Active 20 DOM
-
2026-06-09days on market $139,900 Active 17 DOM
-
2026-06-08days on market $139,900 Active 16 DOM
-
2026-06-07days on market $139,900 Active 15 DOM
-
2026-06-05days on market $139,900 Active 13 DOM
-
2026-06-04days on market $139,900 Active 11 DOM
-
2026-06-02days on market $139,900 Active 10 DOM
-
2026-06-01days on market $139,900 Active 9 DOM
-
2026-05-31days on market $139,900 Active 8 DOM
-
2026-05-31days on market $139,900 Active 7 DOM
-
2026-05-22$139,900 Active 1014-char remark
Show marketing remark (1014 chars)
Opportunity awaits at 3357 Raymo Rd SW in South Boardman! Situated on approximately 5 beautiful acres with pine trees and a peaceful setting, this 3 bedroom, 1 bathroom home offers convenient single-level living with roughly 1,100 square feet of space. Recent exterior updates include newer siding, windows, septic, and doors, while the interior has been cleaned out and is ready for its next owner. Move in as-is or bring your vision and make additional updates and improvements to truly make it your own. Features include natural gas, a covered porch, ramp access, and a low-threshold shower for added accessibility and convenience. Located just a short distance from US-131, this property offers easy access to Traverse City, Kalkaska, South Boardman, and Cadillac while still enjoying a quiet country atmosphere. Whether you are looking for a primary residence, investment opportunity, remodel project, or a great future build site, this property offers endless potential and flexibility for a variety of uses.
-
2026-05-22$139,900 Active
Show marketing remark (1014 chars)
Opportunity awaits at 3357 Raymo Rd SW in South Boardman! Situated on approximately 5 beautiful acres with pine trees and a peaceful setting, this 3 bedroom, 1 bathroom home offers convenient single-level living with roughly 1,100 square feet of space. Recent exterior updates include newer siding, windows, septic, and doors, while the interior has been cleaned out and is ready for its next owner. Move in as-is or bring your vision and make additional updates and improvements to truly make it your own. Features include natural gas, a covered porch, ramp access, and a low-threshold shower for added accessibility and convenience. Located just a short distance from US-131, this property offers easy access to Traverse City, Kalkaska, South Boardman, and Cadillac while still enjoying a quiet country atmosphere. Whether you are looking for a primary residence, investment opportunity, remodel project, or a great future build site, this property offers endless potential and flexibility for a variety of uses.
ⓘ Source: listings_history table (triggers on properties + properties_extension) + one-shot
backfill from property_details.listing_events for pre-trigger history.
Tax reassessment forecast MI · Partial reset (capped growth)
- Current annual tax
- $594 · $50/mo
- Projected year-2 tax
- $1,374 · $115/mo
- Expected delta
- +$780/yr (+$65/mo · 131.3%)
ⓘ Screening estimate from a state-policy table — verify with the county assessor before closing.
Climate risk First Street
- Flood 1/10 Low FEMA zone X · 0% chance over 30 yrs
- Wildfire 4/10 Moderate
- Heat 1/10 Low 7 d/yr ≥92°F today · 14 d/yr by 30 yrs out
- Wind 1/10 Low
- Air quality 2/10 Low 0 unhealthy d/yr today · 1 by 30 yrs out
Nearby sold comps map
Loading sold comps map…
Walkable amenities ~0.75 mi
Loading nearby amenities…
Taxation est. · year 1
- Rental income
- $13,114
- − Mortgage interest
- −$7,837
- − Property taxes
- −$594
- − Insurance
- −$700
- − Repairs & maintenance
- −$1,049
- − Management
- −$1,049
- − Depreciation
- −$4,070
- Taxable loss
- −$2,184
- Est. tax savings @ 24.0%
- +$524
- After-tax cash flow
- $787/yr
For passive investors: Depreciation is non-cash, so a rental often shows a tax loss while cash-flowing — sheltering income. Rental losses are passive: they offset passive income freely, and up to $25,000/yr can offset ordinary (W-2) income if you actively participate and your MAGI is under $100k (phasing out to $0 by $150k); unused losses carry forward. On sale, claimed depreciation is recaptured at up to 25%, and gains may owe capital-gains tax (a 1031 exchange can defer both). Figures are a year-1 estimate at your 24.0% rate — not tax advice; consult a CPA.
Schools (NCES district)
- District
- Forest Area Community Schools
- NCES district ID
- 2614570
- Math proficiency
- 16% ▼ -8.00%
- Reading proficiency
- 31% ▼ -9.00%
- Median HH income
- $43,072
- Composite
- 20.09/100
- National rank
- #8649
- State rank
- #438 of 540 in MI
Livability — Boardman
No livability data for this city. (Only ~50 U.S. cities are tracked.)
Census & demographics
- Population (ZIP)
- 2,125
Population outlook (Kalkaska County) Hauer SSP2
- Today (2025)
- 17,359 people
- By 2030
- 17,222 · -0.8%
- By 2040
- 16,643 · -4.1%
- By 2050
- 15,810 · -8.9%
- By 2075
- 13,772 · -20.7%
- By 2100
- 10,976 · -36.8%
Race, ethnicity, and origin ACS 2023
- Neighborhood character
- Predominantly White (94%)
- Race & ethnicity
- White 94% Black 4% Two or more races 1%
- Common ancestry
- Iranian 12% Romanian 6% Lithuanian 3%
- Foreign-born
- 0%
- Languages at home
- 99% English-only · German/W. Germanic 1%
Political lean MEDSL · Kalkaska
- 2024 margin
- Solid R (+42.9) · D 27.8% · R 70.7% · Other 1.5%
- 2008→2024 swing
- -34.1pp toward R · 2008: -8.8pp · 2024: -42.9pp
- All cycles
- 2024: R+42.9 2020: R+41.7 2016: R+44.1 2012: R+19.7 2008: R+8.8
Not yet ingested
- Civics
- —
Market trends
- HPI YoY
- ▲ 13.35%
- Current HPI
- 320.5552
- Rent YoY
- —
- Metro
- —
- State GDP YoY
- ▲ 1.37%
- F500 in state
- 28
Industry mix (Fortune 500 HQ in MI)
| Industry | F500 HQs | Revenue |
|---|---|---|
| Automotive Parts | 3 | $48B |
|
||
| Automotive | 2 | $372B |
|
||
| Chemicals | 1 | $45B |
|
||
| Automotive Retail | 1 | $29B |
|
||
| Healthcare / Medical Devices | 1 | $23B |
|
||
| Automotive Technology | 1 | $20B |
|
||
Price history
+0.0% since first listed2 events — show timeline
- 2026-05-22 Listed $139,900 MiRealSource-MiMLS
- 2026-05-22 Listed $139,900 REALCOMP
Property tax history
+3.0%/yrLatest (2025): $594 · +2.4% YoY. Source: county tax records.
Cash-flow waterfall
monthlySold comps — $/sqft
last 12 mo · ≤1 miLoading sold comps…