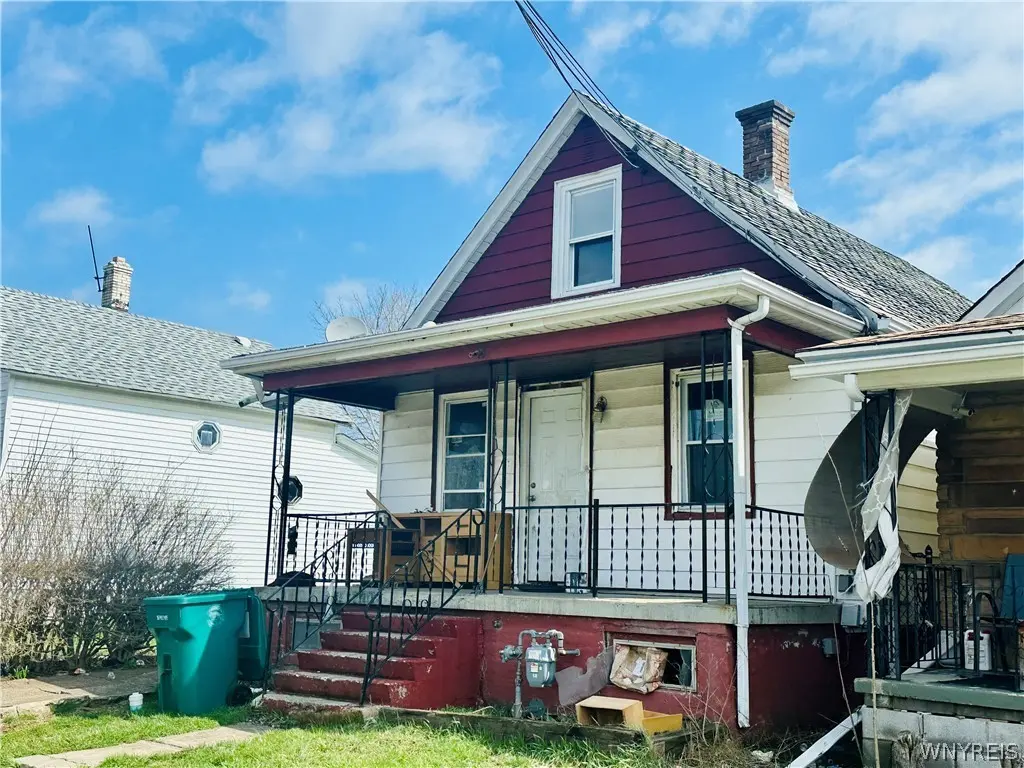
535 20th St · Niagara Falls, NY
Flood risk 3/10 · Minor
- FEMA flood zone
- X (unshaded)
- Chance of flooding over 30 yrs
- 0.2%
- Est. flood insurance / yr
- $473 – $860
Fire risk 1/10 · Minimal
- Est. fire insurance / yr
- $691 – $1,283
Heat risk 2/10 · Minimal
- Hot days now (above 94°F)
- 7 days/yr
- Hot days in 30 yrs
- 15 days/yr
Wind risk 1/10 · Minimal
- Chance of severe wind over 30 yrs
- —
Air-quality risk 3/10 · Minor
- Unhealthy air days now
- 2 days/yr
- Unhealthy air days in 30 yrs
- 3 days/yr
Risk factors via First Street. Map © Google.
Why this score? — see what drove the A- grade
The composite is a weighted blend of 9 inputs, each scored 0–100. Each bar is that input's sub-score; the figure is the points it added to the 100-point composite (weight × sub-score).
- Cash flow +30.0/30.0
- 1% rule +10.0/10.0
- DSCR +10.0/10.0
- Appreciation +10.0/10.0
- ARV discount +7.5/15.0
- Rent growth +4.7/5.0
- Livability +3.0/5.0
- Schools +2.5/10.0
- Condition / age +2.5/5.0
$53,500
🖨 Deal sheet (PDF) 📄 Offer letter ✓ Due diligence
Listing remarks MLS
Discover this beautiful updated ready to move single family home with 2 bedroom and 1 bathroom property along with 1 additional lot on the left side of the house. The location is quite and 10 minutes from Niagara Falls. The entire property was remodeled, renovated few years back. Now need some TLC. The location and exquisite interiors design make you feel at home with comfort, peace and tranquility. It’s a good investment too. The home is accessible to all amenities and facilities within 2 minutes driving distance and 10 minutes drive to access to all major highways and state ways. It’s a vacant property and you can schedule at any time with agent. Offer will be reviewed as they come. Please put your highest and best offer.
Key facts
- Additional lot
- Remodeled property
- 3,125 sq ft lot
Tags
Neighborhood map
What this means for you Summary
Snapshot
- This is a 2-bed/1.0-bath single-family listed at $54k.
Deal economics
- At list price, monthly cash flow is $592 ($7k/yr) — positive.
- The deal already cash-flows at list — no discount required.
- Meets the 1% rule at list price ($1k rent vs $54k).
- Recommended offer: $50k (6.0% below list) — sets the bar for market timing.
- Cap rate 19.6% vs local median 7.5% in Niagara Falls — top-decile yield for the area; either an underpriced asset or a hidden risk that comps aren't pricing in. Stress-test before assuming the spread holds.
Location & tenants
- Location reads 60/100 on livability (#956 in NY) — a middle-class / working-renter tenant base. Strengths: cost of living A+, housing A+; Watch: schools F, crime F, amenities F.
- Niagara Falls City School District (urban): math 26% / reading 34% proficiency, ranked #578 of 590 in NY (top 98%) — families likely to look elsewhere, expect single-tenant / working-renter base with shorter leases; 66% free/reduced lunch — lower-income household profile, screen leases tightly.
- Market conditions: Rents rising fast (+8.8%/yr); 164 active listings in the ZIP; 27 comparable units currently listed for rent nearby; rentals at typical pace (median 19d on market — plan ~3-4 weeks tenant-placement turnaround); lower-income renter base — watch delinquency; 167 units permitted in Niagara County in 2024 (0 in 5+ unit buildings).
- This rent runs 42% of the median local income ($35k/yr) — at the standard rent-burdened threshold; future hikes will face affordability resistance.
Forward outlook
- In year one you build about $6k of equity ($370 loan paydown + $5k appreciation (10.0% local appreciation)).
- Niagara County population projected at -19% by 2050 — secular population decline; favor cash flow + early exit over multi-decade hold.
- At projected returns (10.0% appreciation + 8.0% rent growth), your $15k cash investment doubles in ~2 years — after that, you're playing with house money.
- By year 6, paydown + projected appreciation supports a ~$34k cash-out refi (75% LTV) — recoverable capital for the next deal without selling this one.
Negotiation context
- It's been on market 76 days — a 6% lower offer ($50k) is reasonable based on typical stale-listing flexibility.
- 7 sale attempts since 14y ago with the ask held roughly flat each time — persistent listings suggest the price (not the market) is what's stuck; bring a comps-based counter.
- Current owner paid $18k; list at $54k implies a 206% gain — meaningful room to come down on a strong offer.
Risks & watch-outs
- Watch-outs: built in 1910 — expect roof / HVAC / electrical / plumbing capex.
Questions for the listing agent
- It's been on market 76 days. Have you received any prior offers? Is the seller open to a 6% concession, seller financing, or rate buy-down credit?
- Built in 1910 — when were the roof, HVAC, electrical panel, plumbing, and water heater last replaced?
- Why hasn't it sold? Are there any deal-killer items the seller is aware of (foundation, flood, title, zoning, code violations)?
- Is there a deadline driving the sale (1031 exchange, divorce, estate, relocation)? That informs how much negotiation room exists.
- Schools are F-rated, which usually means shorter tenancies and higher turnover. Who's the typical renter profile here, and what's been the actual vacancy rate?
- Crime grade is F in this area — have there been break-ins, vandalism, or insurance claims at this property in the last 3 years? What carrier currently insures it and at what premium?
- What's the average days-on-market for RENTAL listings here right now (not sales)? A rising rental-DOM trend means longer vacancies and softer asking-rent achievability than the comps imply.
- What's the recent tenant-quality profile in this submarket — average credit score on applications, eviction rate, late-payment / NSF rate, and stable-employment percentage? A property-management company in the area should have these aggregated.
- How much new for-sale + rental construction is in the pipeline within 1–3 miles? Heavy new supply typically softens prices + rents 12–24 months out; constrained supply supports both.
Investment metrics
- 1% rule
- 2.28% ✓
- Cap rate
- 19.58%
- Cash-on-cash
- 47.44%
- DSCR
- 3.11
- GRM
- 3.7
CMA / ARV
- ARV (median comp)
- $122,373
- List price
- $53,500
- Delta
- -56.28%
- Verdict
- UNDERPRICED
- Comps
- 20 within 1.0 mi
Show comp detail 12 sales within ~0.75 mi
| Address | Dist | Beds/Ba | Sqft | Sold | Price | $/sf | Match |
|---|---|---|---|---|---|---|---|
| 609 25th St | 0.30mi | 3/2.0 (+1) | 1,040 (-2%) | 2mo | $158,000 | $152 | 73 |
| 422 21st St | 0.23mi | 3/1.0 (+1) | 992 (-6%) | 5mo | $136,000 | $137 | 70 |
| 1962 Falls St | 0.38mi | 3/1.0 (+1) | 1,040 (-2%) | 6mo | $76,000 | $73 | 69 |
| 2762 Falls St | 0.69mi | 2/1.0 | 1,056 (0%) | 3mo | $120,000 | $114 | 66 |
| 2219 Forest Ave | 0.38mi | 3/1.0 (+1) | 1,116 (+6%) | 5mo | $155,000 | $139 | 64 |
| 1923 Cudaback Ave | 0.46mi | 3/2.0 (+1) | 1,008 (-4%) | 2mo | $143,000 | $142 | 60 |
| 627 13th St | 0.47mi | 3/1.5 (+1) | 1,120 (+6%) | 4mo | $110,000 | $98 | 57 |
| 724 17th St | 0.32mi | 3/1.5 (+1) | 1,179 (+12%) | 4mo | $70,000 | $59 | 56 |
| 2475 La Salle Ave | 0.60mi | 3/2.0 (+1) | 1,024 (-3%) | 6mo | $129,320 | $126 | 53 |
| 544 30th St | 0.58mi | 3/1.0 (+1) | 964 (-9%) | 3mo | $62,000 | $64 | 51 |
| 1812 Pierce Ave | 0.65mi | 3/1.0 (+1) | 1,152 (+9%) | 0mo | $65,000 | $56 | 49 |
| 3028 Welch Ave | 0.74mi | 3/1.5 (+1) | 942 (-11%) | 4mo | $99,000 | $105 | 37 |
Match score weights: distance 35% · size 25% · config 20% · recency 20%. Top-matched comps best support the ARV.
Projected returns pro-forma
10.0% appreciation · 8.0% rent growth · sell at horizon
- IRR
- 65.2%
- Equity multiple
- 5.89×
- Total profit
- $73,306
- Equity at exit
- $48,197
- IRR
- 60.8%
- Equity multiple
- 14.50×
- Total profit
- $202,193
- Equity at exit
- $103,939
Cash invested: $14,980 (down + closing). Projections, not guarantees.
Landlord ↔ Tenant lean methodology
- Overall (STATE)
- 15 Strongly Tenant-Friendly
- State New York
- 15 Strongly Tenant-Friendly · D+10
- County
- — inherits STATE
- City
- — inherits STATE
ZIP-level market 14301
- Home prices YoY
- 6.2%
- Rents YoY
- 8.8%
- Active inventory
- 164
- Price-to-rent
- 3.7×
Monthly cashflow live
- Estimated rent
- $1,218 high interval (Pro) →
- Mortgage (P&I)
- −$281
- Tax est. 1.5%
- −$67 /mo · $802/yr
- Insurance
- −$22
- HOA
- −$0
- Vacancy / Maint / Mgmt
- −$256
- Net cashflow
- $592
Break-even live
Sensitivity live
| Price | -10% $629 | -5% $611 | +0% $592 | +5% $574 | +10% $555 |
|---|---|---|---|---|---|
| Rent | -10% $496 | -5% $544 | +0% $592 | +5% $640 | +10% $688 |
| Rate | -1.0pp $619 | -0.5pp $606 | base $592 | +0.5pp $578 | +1.0pp $564 |
UW: 25.0% down · 7.5% · 30yr · 1.5% tax · 5.0% vac · 8.0% maint · 8.0% mgmt
Financing live
Cash to close
- Down payment
- $13,375
- Closing costs
- $1,605
- Reserves months
- —
- Total cash needed
- —
Loan-product check · same deal, 3 products live
Conventional
25% down · 7.5% · 30yr
- Down + closing
- —
- Monthly P&I
- —
- Monthly cashflow
- —
- DSCR
- —
- Eligible?
- —
Personal DTI + credit; lowest rate.
DSCR
20% down · 8.5% · 30yr
- Down + closing
- —
- Monthly P&I
- —
- Monthly cashflow
- —
- DSCR
- —
- Eligible?
- —
No personal income docs; deal must DSCR.
Hard money
10% down · 12.0% · 12mo
- Down + closing
- —
- Monthly P&I
- —
- Monthly cashflow
- —
- DSCR
- —
- Eligible?
- —
Short-term bridge; refi at stabilization.
Rent comps 27 comps
| Address | Beds | Baths | Sqft | Rent | $/sqft | DOM | Units | Dist |
|---|---|---|---|---|---|---|---|---|
| 434 23rd St Unit Upper Niagara Falls, NY | 2.0 | 1.0 | 816 | $1,100 | $1.35 | 16d | 1 | 0.26mi |
| 769 19th St Niagara Falls, NY | 2.0 | 1.5 | 960 | $1,400 | $1.46 | 22d | 1 | 0.29mi |
| 420 18th St Unit Upper Niagara Falls, NY | 2.0 | 1.0 | 816 | $1,150 | $1.41 | 45d | 1 | 0.31mi |
| 420 25th St Niagara Falls, NY | 3.0 | 1.0 | 1101 | $1,500 | $1.36 | 45d | 1 | 0.38mi |
| 1427 Fort Ave Unit 2 Niagara Falls, NY | 3.0 | 1.0 | 1058 | $950 | $0.90 | 45d | 1 | 0.40mi |
| 1780 Falls St Niagara Falls, NY | 2.0 | 1.0 | 1100 | $1,200 | $1.09 | 45d | 1 | 0.41mi |
| 1001 17th St Niagara Falls, NY | 3.0 | 1.0 | 1152 | $1,800 | $1.56 | 25d | 1 | 0.43mi |
| 754 15th St Niagara Falls, NY | 3.0 | 1.0 | 990 | $1,100 | $1.11 | 25d | 1 | 0.44mi |
| 613 13th St Unit 1 Niagara Falls, NY | 2.0 | 1.0 | 750 | $1,100 | $1.47 | 18d | 1 | 0.48mi |
| 784 15th St Niagara Falls, NY | 3.0 | 1.5 | 1380 | $1,350 | $0.98 | 4d | 1 | 0.49mi |
| 2727 Monroe Ave Niagara Falls, NY | 3.0 | 1.0 | 960 | $1,500 | $1.56 | 12d | 1 | 0.52mi |
| 1808 Whitney Ave Unit 3 Niagara Falls, NY | 2.0 | 1.0 | 1200 | $900 | $0.75 | 45d | 1 | 0.56mi |
| 2473 Pierce Ave Unit 2 Niagara Falls, NY | 2.0 | 1.0 | 1000 | $1,200 | $1.20 | 4d | 1 | 0.66mi |
| 3036 Welch Ave Niagara Falls, NY | 3.0 | 1.0 | 1000 | $1,500 | $1.50 | 3d | 1 | 0.75mi |
| 700 Pine Ave Unit 1 Niagara Falls, NY | 1.0 | 1.0 | 1075 | $1,075 | $1.00 | 13d | 1 | 0.88mi |
| 616 7th St Niagara Falls, NY | 2.0 | 1.0 | 770 | $1,150 | $1.49 | 25d | 1 | 0.89mi |
| 616 Niagara St Niagara Falls, NY | 1.0 | 1.0 | 750 | $1,288 | $1.72 | 3d | 1 | 0.93mi |
| 3626 Dudley Ave Niagara Falls, NY | 2.0 | 1.0 | 700 | $1,250 | $1.79 | 45d | 1 | 0.93mi |
| 2463 South Ave Niagara Falls, NY | 2.0 | 1.0 | 1008 | $1,100 | $1.09 | 18d | 1 | 0.94mi |
| 510 6th St Unit 3 Niagara Falls, NY | 1.0 | 1.0 | 950 | $900 | $0.95 | 45d | 1 | 0.96mi |
| 3340 Simmons Ave Niagara Falls, NY | 3.0 | 1.0 | 1008 | $1,550 | $1.54 | 16d | 1 | 0.98mi |
| 1817 Ontario Ave Unit 2 Niagara Falls, NY | 2.0 | 1.0 | 985 | $1,899 | $1.93 | 3d | 1 | 1.07mi |
| 1817 Ontario Ave Unit 1 Niagara Falls, NY | 2.0 | 1.0 | 999 | $1,899 | $1.90 | 3d | 1 | 1.07mi |
| 714 Buffalo Ave Unit 3 Niagara Falls, NY | 1.0 | 1.0 | 1000 | $1,200 | $1.20 | 45d | 1 | 1.09mi |
| 714 Buffalo Ave Unit 4 Niagara Falls, NY | 1.0 | 1.0 | 1000 | $1,000 | $1.00 | 45d | 1 | 1.09mi |
| 642 Ashland Ave Niagara Falls, NY | 3.0 | 1.0 | 1238 | $1,100 | $0.89 | 4d | 1 | 1.10mi |
| 460 3rd St Niagara Falls, NY | 1.0 | 1.0 | 725 | $1,212 | $1.67 | 3d | 1 | 1.17mi |
Listing history 36 events
-
2026-06-21days on market $53,500 Active 76 DOM
-
2026-06-18days on market $53,500 Active 73 DOM
-
2026-06-17days on market $53,500 Active 72 DOM
-
2026-06-16days on market $53,500 Active 71 DOM
-
2026-06-15days on market $53,500 Active 70 DOM
-
2026-06-13days on market $53,500 Active 68 DOM
-
2026-06-13days on market $53,500 Active 67 DOM
-
2026-06-10days on market $53,500 Active 65 DOM
-
2026-06-09days on market $53,500 Active 64 DOM
-
2026-06-08days on market $53,500 Active 63 DOM
-
2026-06-07days on market $53,500 Active 62 DOM
-
2026-06-03days on market $53,500 Active 58 DOM
-
2026-06-02days on market $53,500 Active 57 DOM
-
2026-06-01days on market $53,500 Active 56 DOM
-
2026-05-31days on market $53,500 Active 55 DOM
-
2026-05-04price $53,500 745-char remark
Show marketing remark (745 chars)
Discover this beautiful updated ready to move single family home with 2 bedroom and 1 bathroom property along with 1 additional lot on the left side of the house. The location is quite and 10 minutes from Niagara Falls. The entire property was remodeled, renovated few years back. Now need some TLC. The location and exquisite interiors design make you feel at home with comfort, peace and tranquility. It’s a good investment too. The home is accessible to all amenities and facilities within 2 minutes driving distance and 10 minutes drive to access to all major highways and state ways. It’s a vacant property and you can schedule at any time with agent. Offer will be reviewed as they come. Please put your highest and best offer.
-
2026-04-06$54,000 Active 745-char remark
Show marketing remark (745 chars)
Discover this beautiful updated ready to move single family home with 2 bedroom and 1 bathroom property along with 1 additional lot on the left side of the house. The location is quite and 10 minutes from Niagara Falls. The entire property was remodeled, renovated few years back. Now need some TLC. The location and exquisite interiors design make you feel at home with comfort, peace and tranquility. It’s a good investment too. The home is accessible to all amenities and facilities within 2 minutes driving distance and 10 minutes drive to access to all major highways and state ways. It’s a vacant property and you can schedule at any time with agent. Offer will be reviewed as they come. Please put your highest and best offer.
-
2025-06-30historical
-
2025-04-03$50,000 Active
-
2024-10-14historical
-
2024-09-09status Active
-
2024-07-03price $59,000
-
2024-05-22$69,900 Active
-
2017-09-26soldstatus $17,500 Closed Sale or Rented
-
2017-08-18status Pending Sale
-
2017-07-17status Under Contract- Do Not Show
-
2017-06-08price $10,000
-
2017-02-27$20,000 Active
-
2016-10-19historical
-
2016-04-19$39,900 Active
-
2014-08-13soldstatus $25,000
-
2012-03-07$23,000
-
2007-03-02soldstatus $11,559
-
2004-06-25soldstatus $38,247
-
2004-06-25soldstatus $10,600
-
1998-06-19soldstatus $27,000
ⓘ Source: listings_history table (triggers on properties + properties_extension) + one-shot
backfill from property_details.listing_events for pre-trigger history.
Climate risk First Street
- Flood 3/10 Moderate FEMA zone X (unshaded) · 20% chance over 30 yrs
- Wildfire 1/10 Low
- Heat 2/10 Low 7 d/yr ≥94°F today · 15 d/yr by 30 yrs out
- Wind 1/10 Low
- Air quality 3/10 Moderate 2 unhealthy d/yr today · 3 by 30 yrs out
Nearby sold comps map
Loading sold comps map…
Walkable amenities ~0.75 mi
Loading nearby amenities…
Taxation est. · year 1
- Rental income
- $14,611
- − Mortgage interest
- −$2,997
- − Property taxes
- −$802
- − Insurance
- −$268
- − Repairs & maintenance
- −$1,169
- − Management
- −$1,169
- − Depreciation
- −$1,556
- Taxable income
- $6,650
- Est. tax owed @ 24.0%
- −$1,596
- After-tax cash flow
- $5,510/yr
For passive investors: Depreciation is non-cash, so a rental often shows a tax loss while cash-flowing — sheltering income. Rental losses are passive: they offset passive income freely, and up to $25,000/yr can offset ordinary (W-2) income if you actively participate and your MAGI is under $100k (phasing out to $0 by $150k); unused losses carry forward. On sale, claimed depreciation is recaptured at up to 25%, and gains may owe capital-gains tax (a 1031 exchange can defer both). Figures are a year-1 estimate at your 24.0% rate — not tax advice; consult a CPA.
Schools (NCES district)
- District
- Niagara Falls City School District
- NCES district ID
- 3620820
- Math proficiency
- 26% ▼ -10.00%
- Reading proficiency
- 34% ▲ 3.00%
- Median HH income
- $32,488
- Composite
- 24.5/100
- National rank
- #7655
- State rank
- #578 of 590 in NY
Livability — Niagara Falls
- Score
- 60/100
- State rank
- #956
- US rank
- #18749
Category grades
Schools grade is shown separately in the Schools card above.
Census & demographics
- Census place
- Niagara Falls, NY
- County
- Niagara County · 157,377 people
- City population
- 62,983
- Metro
- Buffalo-Cheektowaga, NY
- Population (ZIP)
- 10,923
- Household income
- $34,549
- Rent vs Own
- Severe rent burden
- 954.0
Population outlook (Niagara County) Hauer SSP2
- Today (2025)
- 204,149 people
- By 2030
- 197,900 · -3.1%
- By 2040
- 182,239 · -10.7%
- By 2050
- 165,198 · -19.1%
- By 2075
- 129,416 · -36.6%
- By 2100
- 96,222 · -52.9%
Race, ethnicity, and origin ACS 2023
- Neighborhood character
- Diverse neighborhood (Simpson 0.58)
- Race & ethnicity
- White 59% Black 25% Two or more races 8% Hispanic / Latino 8% Asian 2%
- Hispanic origin (detail)
- Puerto Rican 3% Cuban 2%
- Common ancestry
- Romanian 6% Slovak 2% Lithuanian 1%
- Foreign-born
- 5% · Canada, China, Dominican Republic
- Languages at home
- 90% English-only · Spanish 6% Other Indo-European 3% Chinese 1%
Political lean MEDSL · Niagara
- 2024 margin
- R (+14.9) · D 42.5% · R 57.5%
- 2008→2024 swing
- -15.9pp toward R · 2008: 1.0pp · 2024: -14.9pp
- All cycles
- 2024: R+14.9 2020: R+9.7 2016: R+19.0 2012: D+0.6 2008: D+1.0
Not yet ingested
- Civics
- —
Market trends
- HPI YoY
- ▲ 15.41%
- Current HPI
- 266.1457
- Rent YoY
- ▲ 8.79%
- Metro
- Buffalo-Cheektowaga, NY
- State GDP YoY
- ▲ 2.60%
- F500 in state
- 92
Industry mix (Fortune 500 HQ in NY)
| Industry | F500 HQs | Revenue |
|---|---|---|
| Financial Services | 10 | $950B |
|
||
| Consumer Goods | 9 | $162B |
|
||
| Insurance | 4 | $225B |
|
||
| Telecommunications | 2 | $144B |
|
||
| Pharmaceuticals | 2 | $112B |
|
||
| Media / Entertainment | 2 | $69B |
|
||
Price history
+98.1% since first listed21 events — show timeline
- 2026-05-04 Price Changed $53,500 WNYREIS
- 2026-04-06 Listed $54,000 WNYREIS
- 2025-06-30 Listing Removed — WNYREIS
- 2025-04-03 Listed $50,000 WNYREIS
- 2024-10-14 Listing Removed — WNYREIS
- 2024-09-09 Relisted — WNYREIS
- 2024-07-03 Price Changed $59,000 WNYREIS
- 2024-05-22 Listed $69,900 WNYREIS
- 2017-09-26 Sold (MLS) $17,500 WNYREIS
- 2017-08-18 Pending — WNYREIS
- 2017-07-17 Pending — WNYREIS
- 2017-06-08 Price Changed $10,000 WNYREIS
- 2017-02-27 Listed $20,000 WNYREIS
- 2016-10-19 Listing Removed — WNYREIS
- 2016-04-19 Listed $39,900 WNYREIS
- 2014-08-13 Sold (Public Records) $25,000 Public Records
- 2012-03-07 Listed $23,000 WNYREIS
- 2007-03-02 Sold (Public Records) $11,559 Public Records
- 2004-06-25 Sold (Public Records) $10,600 Public Records
- 2004-06-25 Sold (Public Records) $38,247 Public Records
- 1998-06-19 Sold (Public Records) $27,000 Public Records
Property tax history
+6.6%/yrLatest (2025): $2,675 · +1.8% YoY. Source: county tax records.
Cash-flow waterfall
monthlySold comps — $/sqft
last 12 mo · ≤1 miLoading sold comps…