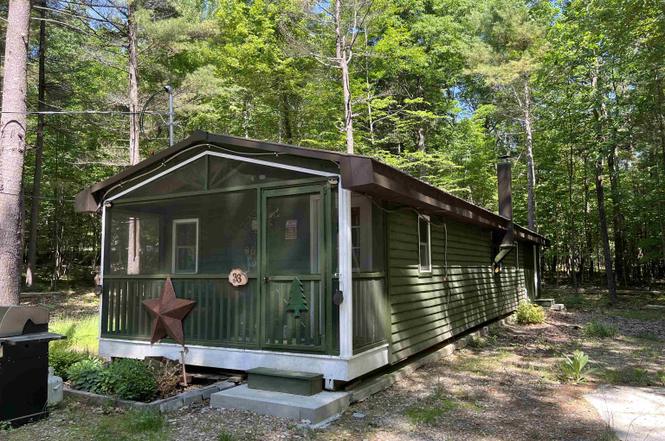
33 Dogwood St · Au Sable Forks, NY
Flood risk 1/10 · Minimal
- FEMA flood zone
- X (unshaded)
- Chance of flooding over 30 yrs
- 0.0%
- Est. flood insurance / yr
- $507 – $1,088
Fire risk 3/10 · Minor
- Est. fire insurance / yr
- $691 – $1,283
Heat risk 1/10 · Minimal
- Hot days now (above 92°F)
- 7 days/yr
- Hot days in 30 yrs
- 14 days/yr
Wind risk 1/10 · Minimal
- Chance of severe wind over 30 yrs
- —
Air-quality risk 2/10 · Minimal
- Unhealthy air days now
- 1 days/yr
- Unhealthy air days in 30 yrs
- 1 days/yr
Risk factors via First Street. Map © Google.
Why this score? — see what drove the D- grade
The composite is a weighted blend of 9 inputs, each scored 0–100. Each bar is that input's sub-score; the figure is the points it added to the 100-point composite (weight × sub-score).
- Appreciation +8.8/10.0
- ARV discount +7.5/15.0
- Cash flow +7.3/30.0
- Schools +3.7/10.0
- 1% rule +2.9/10.0
- Livability +2.7/5.0
- Rent growth +2.5/5.0
- Condition / age +2.5/5.0
- DSCR +1.5/10.0
$140,000
🖨 Deal sheet (PDF) 📄 Offer letter ✓ Due diligence
Listing remarks MLS
This lot that will give you more space. Buildable to a single family home or Vacation Rental with water and electric at the roadside. Au Sable Acre offers Hiking and /ski trails, tennis courts and Lake Eaton for Canoeing and Kayaking pleasure Close to Whiteface Mt. and Lake Placid
Key facts
- Newly constructed
- Adirondack camp
- Almost an acre
Tags
Property features AI
Exterior
- Parking: Gravel parking
- Utilities: Private water
- Home design: Residential property; Single-story
- Construction: Wood siding; Slab foundation; Built with metal roof
- Exterior features: Front porch; Metal roof; Wooded lot; Publicly maintained road; Has a view
Interior
- Kitchen: Electric cooktop; Microwave; Refrigerator
- Bedrooms: Total of 4 rooms (bedroom count not specified)
- Flooring: Wood flooring
- Bathrooms: 1 full bathroom
- Heating & cooling: Electric heating
- Interior features: Wood flooring; Microwave; Refrigerator; Electric cooktop
Neighborhood map
What this means for you Summary
Snapshot
- This is a 2-bed/1.0-bath single-family listed at $140k.
Deal economics
- At list price, monthly cash flow is $-185 ($-2k/yr) — negative.
- To cash-flow at today's rent, offer at most $107k (23.3% below list).
- To meet the 1% rule (rent ≥ 1% of price), the offer needs to be $111k (21.0% below list).
- Recommended offer: $107k (23.3% below list) — sets the bar for cash-flow.
- Cap rate 4.7% vs local median 1.4% in Au Sable Forks — top-decile yield for the area; either an underpriced asset or a hidden risk that comps aren't pricing in. Stress-test before assuming the spread holds.
Location & tenants
- Location reads 54/100 on livability (#1,143 in NY) — a working-class tenant base; expect higher turnover. Strengths: cost of living A+, housing B+; Watch: crime F, amenities F, commute F.
- Ausable Valley Central School District (rural): math 36% / reading 51% proficiency, ranked #474 of 590 in NY (top 80%) — families likely to look elsewhere, expect single-tenant / working-renter base with shorter leases.
- Zoned schools: Ausable Forks Elementary School (math 22% / reading 52%, grade F, #1,519 of 2,108 statewide, top 74%, 225 students, 58% FRL); Ausable Valley Middle School (math 22% / reading 47%, grade F, #483 of 729 statewide, top 68%, 193 students, 54% FRL); Ausable Valley High School (math 92% / reading 75%, grade A, #409 of 1,100 statewide, top 39%, 351 students, 50% FRL) — zoned schools average 54% FRL vs 37% district-wide (17 pts higher); higher-poverty schools than district average — tighter screening recommended.
- Market conditions: 55 active listings in the ZIP; 218 units permitted in Essex County in 2024 (63 in 5+ unit buildings).
Forward outlook
- In year one you build about $12k of equity ($968 loan paydown + $11k appreciation (7.6% local appreciation)).
- Essex County population projected at -20% by 2050 — secular population decline; favor cash flow + early exit over multi-decade hold.
- By year 4, paydown + projected appreciation supports a ~$40k cash-out refi (75% LTV) — recoverable capital for the next deal without selling this one.
Negotiation context
- It's been on market 269 days — a 12% lower offer ($123k) is reasonable based on typical stale-listing flexibility.
- 3 sale attempts since 4y ago; this cycle's ask has dropped $60k (30%) from the opening price — seller is motivated, your offer sets the floor, not the list.
- Current owner paid $20k; list at $140k implies a 583% gain — meaningful room to come down on a strong offer.
Questions for the listing agent
- What do current leases actually rent for vs. the listed asking? Can we see a recent rent roll and the last 12 months of T-12 income?
- It's been on market 269 days. Have you received any prior offers? Is the seller open to a 23% concession, seller financing, or rate buy-down credit?
- Why hasn't it sold? Are there any deal-killer items the seller is aware of (foundation, flood, title, zoning, code violations)?
- Is there a deadline driving the sale (1031 exchange, divorce, estate, relocation)? That informs how much negotiation room exists.
- Schools are D-rated, which usually means shorter tenancies and higher turnover. Who's the typical renter profile here, and what's been the actual vacancy rate?
- Crime grade is F in this area — have there been break-ins, vandalism, or insurance claims at this property in the last 3 years? What carrier currently insures it and at what premium?
- The area grade is low — what's the realistic commute time and amenity access for the typical tenant pool here? Any planned neighborhood developments (good or bad) we should know about?
- What's the average days-on-market for RENTAL listings here right now (not sales)? A rising rental-DOM trend means longer vacancies and softer asking-rent achievability than the comps imply.
- What's the recent tenant-quality profile in this submarket — average credit score on applications, eviction rate, late-payment / NSF rate, and stable-employment percentage? A property-management company in the area should have these aggregated.
- How much new for-sale + rental construction is in the pipeline within 1–3 miles? Heavy new supply typically softens prices + rents 12–24 months out; constrained supply supports both.
Investment metrics
- 1% rule
- 0.79% ✗
- Cap rate
- 4.71%
- Cash-on-cash
- -5.65%
- DSCR
- 0.75
- GRM
- 10.6
CMA / ARV
- ARV (on-the-fly)
- $293,132
- Comps found
- 2
Show comp detail 2 sales within ~0.75 mi
| Address | Dist | Beds/Ba | Sqft | Sold | Price | $/sf | Match |
|---|---|---|---|---|---|---|---|
| 8 Beech St | 0.42mi | 1/1.0 (-1) | 832 (+2%) | 17mo | $300,000 | $361 | 58 |
| 23 Red Fox Dr | 0.68mi | 2/1.0 | 880 (+8%) | 4mo | $300,000 | $341 | 51 |
Match score weights: distance 35% · size 25% · config 20% · recency 20%. Top-matched comps best support the ARV.
Projected returns pro-forma
7.62% appreciation · 3.0% rent growth · sell at horizon
- IRR
- 14.9%
- Equity multiple
- 2.09×
- Total profit
- $42,615
- Equity at exit
- $102,777
- IRR
- 14.7%
- Equity multiple
- 4.38×
- Total profit
- $132,484
- Equity at exit
- $200,685
Cash invested: $39,200 (down + closing). Projections, not guarantees.
Landlord ↔ Tenant lean methodology
- Overall (STATE)
- 15 Strongly Tenant-Friendly
- State New York
- 15 Strongly Tenant-Friendly · D+10
- County
- — inherits STATE
- City
- — inherits STATE
ZIP-level market 12941
- Home prices YoY
- 1.8%
- Active inventory
- 55
- Price-to-rent
- 10.6×
Monthly cashflow live
- Estimated rent
- $1,105 medium interval (Pro) →
- Mortgage (P&I)
- −$734
- Tax from tax record
- −$265 /mo · $3,185/yr
- Insurance
- −$58
- HOA
- −$0
- Vacancy / Maint / Mgmt
- −$232
- Net cashflow
- $-185
Break-even live
Sensitivity live
| Price | -10% $-105 | -5% $-145 | +0% $-185 | +5% $-224 | +10% $-264 |
|---|---|---|---|---|---|
| Rent | -10% $-272 | -5% $-228 | +0% $-185 | +5% $-141 | +10% $-97 |
| Rate | -1.0pp $-114 | -0.5pp $-149 | base $-185 | +0.5pp $-221 | +1.0pp $-258 |
UW: 25.0% down · 7.5% · 30yr · 1.5% tax · 5.0% vac · 8.0% maint · 8.0% mgmt
Financing live
Cash to close
- Down payment
- $35,000
- Closing costs
- $4,200
- Reserves months
- —
- Total cash needed
- —
Loan-product check · same deal, 3 products live
Conventional
25% down · 7.5% · 30yr
- Down + closing
- —
- Monthly P&I
- —
- Monthly cashflow
- —
- DSCR
- —
- Eligible?
- —
Personal DTI + credit; lowest rate.
DSCR
20% down · 8.5% · 30yr
- Down + closing
- —
- Monthly P&I
- —
- Monthly cashflow
- —
- DSCR
- —
- Eligible?
- —
No personal income docs; deal must DSCR.
Hard money
10% down · 12.0% · 12mo
- Down + closing
- —
- Monthly P&I
- —
- Monthly cashflow
- —
- DSCR
- —
- Eligible?
- —
Short-term bridge; refi at stabilization.
Listing history 25 events
-
2026-06-22days on market $140,000 Active 269 DOM
-
2026-06-19days on market $140,000 Active 267 DOM
-
2026-06-18days on market $140,000 Active 266 DOM
-
2026-06-17days on market $140,000 Active 265 DOM
-
2026-06-16days on market $140,000 Active 264 DOM
-
2026-06-15days on market $140,000 Active 263 DOM
-
2026-06-14days on market $140,000 Active 261 DOM
-
2026-06-13days on market $140,000 Active 260 DOM
-
2026-06-10days on market $140,000 Active 258 DOM
-
2026-06-09days on market $140,000 Active 257 DOM
-
2026-06-08days on market $140,000 Active 256 DOM
-
2026-06-07days on market $140,000 Active 255 DOM
-
2026-06-05days on market $140,000 Active 252 DOM
-
2026-06-02days on market $140,000 Active 250 DOM
-
2026-06-01days on market $140,000 Active 249 DOM
-
2026-05-31days on market $140,000 Active 248 DOM
-
2026-05-30days on market $140,000 Active 247 DOM
-
2026-05-14price $140,000
-
2026-04-10price $150,000
-
2026-03-18status Active
-
2026-03-18price $175,000
-
2025-09-17$200,000 Active
-
2023-01-13soldstatus $20,500 Closed 281-char remark
Show marketing remark (281 chars)
This lot that will give you more space. Buildable to a single family home or Vacation Rental with water and electric at the roadside. Au Sable Acre offers Hiking and /ski trails, tennis courts and Lake Eaton for Canoeing and Kayaking pleasure Close to Whiteface Mt. and Lake Placid
-
2022-10-13historical 281-char remark
Show marketing remark (281 chars)
This lot that will give you more space. Buildable to a single family home or Vacation Rental with water and electric at the roadside. Au Sable Acre offers Hiking and /ski trails, tennis courts and Lake Eaton for Canoeing and Kayaking pleasure Close to Whiteface Mt. and Lake Placid
-
2022-02-24$24,000 281-char remark
Show marketing remark (281 chars)
This lot that will give you more space. Buildable to a single family home or Vacation Rental with water and electric at the roadside. Au Sable Acre offers Hiking and /ski trails, tennis courts and Lake Eaton for Canoeing and Kayaking pleasure Close to Whiteface Mt. and Lake Placid
ⓘ Source: listings_history table (triggers on properties + properties_extension) + one-shot
backfill from property_details.listing_events for pre-trigger history.
Tax reassessment forecast NY · Partial reset (capped growth)
- Current annual tax
- $3,185 · $265/mo
- Projected year-2 tax
- $3,185 · $265/mo
- Expected delta
- $0/yr ($0/mo · 0.0%)
ⓘ Screening estimate from a state-policy table — verify with the county assessor before closing.
Climate risk First Street
- Flood 1/10 Low FEMA zone X (unshaded) · 0% chance over 30 yrs
- Wildfire 3/10 Moderate
- Heat 1/10 Low 7 d/yr ≥92°F today · 14 d/yr by 30 yrs out
- Wind 1/10 Low
- Air quality 2/10 Low 1 unhealthy d/yr today · 1 by 30 yrs out
Nearby sold comps map
Loading sold comps map…
Walkable amenities ~0.75 mi
Loading nearby amenities…
Taxation est. · year 1
- Rental income
- $13,265
- − Mortgage interest
- −$7,842
- − Property taxes
- −$3,185
- − Insurance
- −$700
- − Repairs & maintenance
- −$1,061
- − Management
- −$1,061
- − Depreciation
- −$4,073
- Taxable loss
- −$4,657
- Est. tax savings @ 24.0%
- +$1,118
- After-tax cash flow
- $-1,098/yr
For passive investors: Depreciation is non-cash, so a rental often shows a tax loss while cash-flowing — sheltering income. Rental losses are passive: they offset passive income freely, and up to $25,000/yr can offset ordinary (W-2) income if you actively participate and your MAGI is under $100k (phasing out to $0 by $150k); unused losses carry forward. On sale, claimed depreciation is recaptured at up to 25%, and gains may owe capital-gains tax (a 1031 exchange can defer both). Figures are a year-1 estimate at your 24.0% rate — not tax advice; consult a CPA.
Schools (NCES district)
- District
- Ausable Valley Central School District
- NCES district ID
- 3616170
- Math proficiency
- 36% ▼ -14.00%
- Reading proficiency
- 51% ▲ 5.00%
- Median HH income
- $50,989
- Composite
- 37.43/100
- National rank
- #4417
- State rank
- #474 of 590 in NY
Livability — Au Sable Forks
- Score
- 54/100
- State rank
- #1143
- US rank
- #23832
Category grades
Schools grade is shown separately in the Schools card above.
Census & demographics
- Population (ZIP)
- 1,477
Population outlook (Essex County) Hauer SSP2
- Today (2025)
- 36,758 people
- By 2030
- 35,697 · -2.9%
- By 2040
- 32,697 · -11.0%
- By 2050
- 29,248 · -20.4%
- By 2075
- 22,641 · -38.4%
- By 2100
- 16,602 · -54.8%
Race, ethnicity, and origin ACS 2023
- Neighborhood character
- Predominantly White (95%)
- Race & ethnicity
- White 95% Hispanic / Latino 2% Two or more races 1%
- Common ancestry
- Romanian 8% Lithuanian 6% Slovak 5%
- Foreign-born
- 4% · Canada
- Languages at home
- 96% English-only · Spanish 1% Other Indo-European 1% Russian/Polish/Slavic 1%
Political lean MEDSL · Essex
- 2024 margin
- Toss-up / Even · D 50.2% · R 49.8%
- 2008→2024 swing
- -12.8pp toward R · 2008: 13.3pp · 2024: 0.5pp
- All cycles
- 2024: D+0.5 2020: D+5.0 2016: R+3.4 2012: D+15.0 2008: D+13.3
Not yet ingested
- Civics
- —
Market trends
- HPI YoY
- ▲ 7.62%
- Current HPI
- 431.184
- Rent YoY
- —
- Metro
- —
- State GDP YoY
- ▲ 2.60%
- F500 in state
- 92
Industry mix (Fortune 500 HQ in NY)
| Industry | F500 HQs | Revenue |
|---|---|---|
| Financial Services | 10 | $950B |
|
||
| Consumer Goods | 9 | $162B |
|
||
| Insurance | 4 | $225B |
|
||
| Telecommunications | 2 | $144B |
|
||
| Pharmaceuticals | 2 | $112B |
|
||
| Media / Entertainment | 2 | $69B |
|
||
Price history
+483.3% since first listed8 events — show timeline
- 2026-05-14 Price Changed $140,000 SLCMLS
- 2026-04-10 Price Changed $150,000 SLCMLS
- 2026-03-18 Relisted — SLCMLS
- 2026-03-18 Price Changed $175,000 SLCMLS
- 2025-09-17 Listed $200,000 SLCMLS
- 2023-01-13 Sold (MLS) $20,500 ACVMLS
- 2022-10-13 Delisted — ACVMLS
- 2022-02-24 Listed $24,000 ACVMLS
Property tax history
+18.2%/yrLatest (2025): $3,185 · +2.6% YoY. Source: county tax records.
Cash-flow waterfall
monthlySold comps — $/sqft
last 12 mo · ≤1 miLoading sold comps…