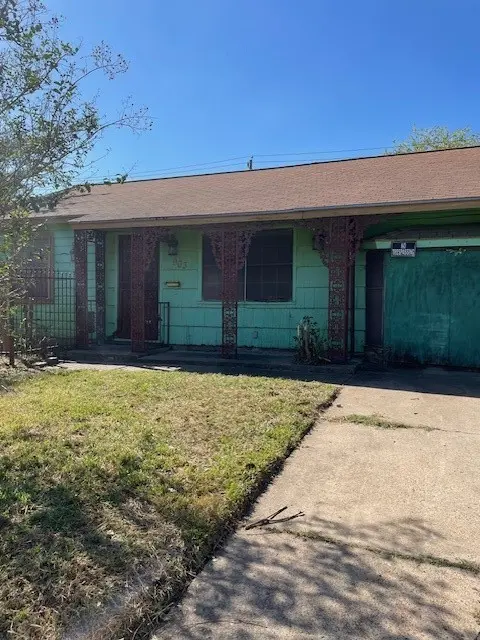
903 Bank Dr · Galena Park, TX
Flood risk 1/10 · Minimal
- FEMA flood zone
- X (unshaded)
- Chance of flooding over 30 yrs
- 0.0%
- Est. flood insurance / yr
- $507 – $1,088
Fire risk 2/10 · Minimal
- Est. fire insurance / yr
- $1,222 – $2,270
Heat risk 9/10 · Severe
- Hot days now (above 109°F)
- 7 days/yr
- Hot days in 30 yrs
- 24 days/yr
Wind risk 9/10 · Severe
- Chance of severe wind over 30 yrs
- 99.0%
Air-quality risk 2/10 · Minimal
- Unhealthy air days now
- 2 days/yr
- Unhealthy air days in 30 yrs
- 2 days/yr
Risk factors via First Street. Map © Google.
Why this score? — see what drove the A- grade
The composite is a weighted blend of 9 inputs, each scored 0–100. Each bar is that input's sub-score; the figure is the points it added to the 100-point composite (weight × sub-score).
- Cash flow +30.0/30.0
- ARV discount +15.0/15.0
- 1% rule +10.0/10.0
- DSCR +10.0/10.0
- Appreciation +7.5/10.0
- Livability +3.4/5.0
- Schools +2.8/10.0
- Rent growth +2.5/5.0
- Condition / age +2.5/5.0
$79,900
🖨 Deal sheet 📄 Offer letter ✓ Due diligence
Listing remarks MLS
Great investment opportunity with this 2 Bedroom with possible 3rd bedroom. Also has a large detached garage with lots of storage space. Fenced yard with driveway gate.
Key facts
- Driveway gate
- Fenced yard
- Detached garage
Tags
Neighborhood map
What this means for you Summary
Snapshot
- This is a 2-bed/1.0-bath single-family listed at $80k.
Deal economics
- At list price, monthly cash flow is $506 ($6k/yr) — positive.
- The deal already cash-flows at list — no discount required.
- Meets the 1% rule at list price ($1k rent vs $80k).
- Recommended offer: $70k (12.0% below list) — sets the bar for market timing.
- Cap rate 13.9% vs local median 4.1% in Galena Park — top-decile yield for the area; either an underpriced asset or a hidden risk that comps aren't pricing in. Stress-test before assuming the spread holds.
Location & tenants
- Location reads 68/100 on livability (#456 in TX) — a middle-class / working-renter tenant base. Strengths: crime A+, cost of living A+, housing A+; Watch: schools D, amenities F, commute F.
- Galena Park ISD (suburban): math 32% / reading 33% proficiency, ranked #578 of 826 in TX (top 70%) — families likely to look elsewhere, expect single-tenant / working-renter base with shorter leases; 74% free/reduced lunch — lower-income household profile, screen leases tightly.
- Market conditions: 38 active listings in the ZIP; 13 comparable units currently listed for rent nearby; rentals at typical pace (median 24d on market — plan ~3-4 weeks tenant-placement turnaround); 46% of comp listings sitting > 30 days — soft ceiling on asking rent; 29,883 units permitted in Harris County in 2024 (8,621 in 5+ unit buildings).
Forward outlook
- In year one you build about $5k of equity ($552 loan paydown + $4k appreciation (5.0% local appreciation)).
- Harris County population projected at +47% by 2050 — long-run rental-demand tailwind backs the buy-and-hold thesis.
- At projected returns (5.0% appreciation + 3.0% rent growth), your $22k cash investment doubles in ~3 years — after that, you're playing with house money.
- By year 8, paydown + projected appreciation supports a ~$34k cash-out refi (75% LTV) — recoverable capital for the next deal without selling this one.
Negotiation context
- It's been on market 222 days — a 12% lower offer ($70k) is reasonable based on typical stale-listing flexibility.
- 3 sale attempts since 3y ago; this cycle's ask has dropped $14k (15%) from the opening price — seller is motivated, your offer sets the floor, not the list.
Risks & watch-outs
- Watch-outs: property tax is 3.0% of price; built in 1953 — expect roof / HVAC / electrical / plumbing capex.
- Climate carrying-cost: severe wind risk, 99% chance of damaging wind over 30y; extreme-heat days projected 7→24/yr by 2055 (HVAC capex compounding) — expect insurance premiums to compound above CPI over the hold.
Questions for the listing agent
- It's been on market 222 days. Have you received any prior offers? Is the seller open to a 12% concession, seller financing, or rate buy-down credit?
- Built in 1953 — when were the roof, HVAC, electrical panel, plumbing, and water heater last replaced?
- Property tax is high relative to price — has the assessment been appealed recently, and will the sale trigger a re-assessment?
- Why hasn't it sold? Are there any deal-killer items the seller is aware of (foundation, flood, title, zoning, code violations)?
- Is there a deadline driving the sale (1031 exchange, divorce, estate, relocation)? That informs how much negotiation room exists.
- Schools are D-rated, which usually means shorter tenancies and higher turnover. Who's the typical renter profile here, and what's been the actual vacancy rate?
- What's the average days-on-market for RENTAL listings here right now (not sales)? A rising rental-DOM trend means longer vacancies and softer asking-rent achievability than the comps imply.
- What's the recent tenant-quality profile in this submarket — average credit score on applications, eviction rate, late-payment / NSF rate, and stable-employment percentage? A property-management company in the area should have these aggregated.
- How much new for-sale + rental construction is in the pipeline within 1–3 miles? Heavy new supply typically softens prices + rents 12–24 months out; constrained supply supports both.
Investment metrics
- 1% rule
- 1.83% ✓
- Cap rate
- 13.89%
- Cash-on-cash
- 27.12%
- DSCR
- 2.21
- GRM
- 4.5
CMA / ARV
- ARV (median comp)
- $159,683
- List price
- $79,900
- Delta
- -49.96%
- Verdict
- UNDERPRICED
- Comps
- 20 within 1.0 mi
Show comp detail 12 sales within ~0.75 mi
| Address | Dist | Beds/Ba | Sqft | Sold | Price | $/sf | Match |
|---|---|---|---|---|---|---|---|
| 506 Sage Dr | 0.22mi | 2/1.0 | 1,008 (-3%) | 4mo | $137,000 | $136 | 81 |
| 1101 Bank Dr | 0.08mi | 2/1.0 | 1,104 (+6%) | 19mo | $130,000 | $118 | 70 |
| 2515 7th St | 0.11mi | 2/2.0 | 1,171 (+13%) | 2mo | $169,900 | $145 | 68 |
| 1106 Sage Dr | 0.15mi | 3/1.0 (+1) | 1,142 (+10%) | 11mo | $140,000 | $123 | 62 |
| 2224 11th St | 0.34mi | 3/2.0 (+1) | 1,120 (+8%) | 1mo | $179,900 | $161 | 61 |
| 2219 8th St | 0.38mi | 3/1.0 (+1) | 1,080 (+4%) | 12mo | $140,000 | $130 | 60 |
| 1304 Pugh Dr | 0.52mi | 2/1.0 | 955 (-8%) | 5mo | $194,000 | $203 | 57 |
| 2113 10th St | 0.55mi | 2/2.0 | 1,103 (+6%) | 7mo | $135,000 | $122 | 55 |
| 2106 6th St | 0.60mi | 3/1.0 (+1) | 936 (-10%) | 1mo | $140,000 | $150 | 50 |
| 1402 Sage Dr | 0.26mi | 3/1.0 (+1) | 1,157 (+11%) | 20mo | $76,000 | $66 | 47 |
| 810 Eastway St | 0.72mi | 3/1.0 (+1) | 1,085 (+4%) | 12mo | $199,900 | $184 | 44 |
| 2110 8th St | 0.56mi | 3/1.0 (+1) | 1,120 (+8%) | 19mo | $185,000 | $165 | 40 |
Match score weights: distance 35% · size 25% · config 20% · recency 20%. Top-matched comps best support the ARV.
Projected returns pro-forma
4.96% appreciation · 3.0% rent growth · sell at horizon
- IRR
- 36.6%
- Equity multiple
- 3.26×
- Total profit
- $50,519
- Equity at exit
- $45,091
- IRR
- 34.9%
- Equity multiple
- 6.59×
- Total profit
- $125,140
- Equity at exit
- $77,665
Cash invested: $22,372 (down + closing). Projections, not guarantees.
Landlord ↔ Tenant lean methodology
- Overall (STATE)
- 87 Strongly Landlord-Friendly
- State Texas
- 87 Strongly Landlord-Friendly · R+5
- County
- — inherits STATE
- City
- — inherits STATE
ZIP-level market 77547
- Home prices YoY
- 2.0%
- Active inventory
- 38
- Price-to-rent
- 4.5×
Monthly cashflow live
- Estimated rent
- $1,464 high interval (Pro) →
- Mortgage (P&I)
- −$419
- Tax from tax record
- −$198 /mo · $2,381/yr
- Insurance
- −$33
- HOA
- −$0
- Vacancy / Maint / Mgmt
- −$307
- Net cashflow
- $506
Break-even live
UW: 25.0% down · 7.5% · 30yr · 1.5% tax · 5.0% vac · 8.0% maint · 8.0% mgmt
Financing live
Cash to close
- Down payment
- $19,975
- Closing costs
- $2,397
- Reserves months
- —
- Total cash needed
- —
Loan-product check · same deal, 3 products live
Conventional
25% down · 7.5% · 30yr
- Down + closing
- —
- Monthly P&I
- —
- Monthly cashflow
- —
- DSCR
- —
- Eligible?
- —
Personal DTI + credit; lowest rate.
DSCR
20% down · 8.5% · 30yr
- Down + closing
- —
- Monthly P&I
- —
- Monthly cashflow
- —
- DSCR
- —
- Eligible?
- —
No personal income docs; deal must DSCR.
Hard money
10% down · 12.0% · 12mo
- Down + closing
- —
- Monthly P&I
- —
- Monthly cashflow
- —
- DSCR
- —
- Eligible?
- —
Short-term bridge; refi at stabilization.
Rent comps 13 comps
| Address | Beds | Baths | Sqft | Rent | $/sqft | DOM | Units | Dist |
|---|---|---|---|---|---|---|---|---|
| 335 Delaware St Houston, TX | 2.0 | 1.0 | 784 | $940 | $1.20 | 12d | 1 | 0.10mi |
| 423 Armstrong St Houston, TX | 3.0 | 2.0 | 1090 | $1,515 | $1.39 | 1d | 1 | 0.13mi |
| 403 Armstrong St Houston, TX | 3.0 | 2.0 | 909 | $1,435 | $1.58 | 5d | 1 | 0.15mi |
| 205 Bolden St Unit A Houston, TX | 3.0 | 2.0 | 1200 | $2,500 | $2.08 | 43d | 1 | 0.32mi |
| 311 Massachusetts St Unit A Houston, TX | 3.0 | 2.0 | 1184 | $1,700 | $1.44 | 12d | 1 | 0.35mi |
| 2216 3rd St Galena Park, TX | 3.0 | 2.0 | 1500 | $1,400 | $0.93 | 43d | 1 | 0.52mi |
| 9743 Veyblum St Unit B Houston, TX | 3.0 | 2.0 | 872 | $1,145 | $1.31 | 5d | 1 | 0.77mi |
| 9821 Turnbow St Unit C Houston, TX | 3.0 | 2.0 | 1140 | $1,720 | $1.51 | 43d | 1 | 0.82mi |
| 9713 Stedman St Unit b Houston, TX | 3.0 | 2.0 | 872 | $1,095 | $1.26 | 43d | 1 | 0.92mi |
| 9710 Tuffly St Houston, TX | 3.0 | 2.0 | 1275 | $1,795 | $1.41 | 24d | 1 | 1.13mi |
| 9709 Cargill St Houston, TX | 3.0 | 2.0 | 1184 | $2,300 | $1.94 | 43d | 1 | 1.34mi |
| 9806 Fillmore St Houston, TX | 2.0 | 2.0 | 850 | $1,850 | $2.18 | 43d | 1 | 1.36mi |
| 9907 Lanewell St Unit a Houston, TX | 3.0 | 2.0 | 872 | $1,154 | $1.32 | 21d | 1 | 1.43mi |
Listing history 23 events
-
2026-06-18days on market $79,900 Active 222 DOM
-
2026-06-17days on market $79,900 Active 221 DOM
-
2026-06-16days on market $79,900 Active 220 DOM
-
2026-06-15days on market $79,900 Active 219 DOM
-
2026-06-13days on market $79,900 Active 217 DOM
-
2026-06-13days on market $79,900 Active 216 DOM
-
2026-06-09days on market $79,900 Active 213 DOM
-
2026-06-08days on market $79,900 Active 212 DOM
-
2026-06-07days on market $79,900 Active 211 DOM
-
2026-06-04days on market $79,900 Active 208 DOM
-
2026-06-03days on market $79,900 Active 207 DOM
-
2026-06-02days on market $79,900 Active 206 DOM
-
2026-06-01days on market $79,900 Active 205 DOM
-
2026-05-31days on market $79,900 Active 204 DOM
-
2026-04-15price $79,900 168-char remark
Show marketing remark (168 chars)
Great investment opportunity with this 2 Bedroom with possible 3rd bedroom. Also has a large detached garage with lots of storage space. Fenced yard with driveway gate.
-
2026-02-14price $87,900 168-char remark
Show marketing remark (168 chars)
Great investment opportunity with this 2 Bedroom with possible 3rd bedroom. Also has a large detached garage with lots of storage space. Fenced yard with driveway gate.
-
2025-11-07$93,600 Active 168-char remark
Show marketing remark (168 chars)
Great investment opportunity with this 2 Bedroom with possible 3rd bedroom. Also has a large detached garage with lots of storage space. Fenced yard with driveway gate.
-
2024-01-02status Active
-
2023-10-27historical
-
2023-10-20status Pending
-
2023-10-05price $85,000
-
2023-09-27$99,000 Active
-
1988-01-01soldstatus
ⓘ Source: listings_history table (triggers on properties + properties_extension) + one-shot
backfill from property_details.listing_events for pre-trigger history.
Tax reassessment forecast TX · Resets to sale price
- Current annual tax
- $2,381 · $198/mo
- Projected year-2 tax
- $2,381 · $198/mo
- Expected delta
- $0/yr ($0/mo · 0.0%)
ⓘ Screening estimate from a state-policy table — verify with the county assessor before closing.
Climate risk First Street
- Flood 1/10 Low FEMA zone X (unshaded) · 0% chance over 30 yrs
- Wildfire 2/10 Low
- Heat 9/10 Extreme 7 d/yr ≥109°F today · 24 d/yr by 30 yrs out
- Wind 9/10 Extreme 99% chance of damaging wind over 30 yrs
- Air quality 2/10 Low 2 unhealthy d/yr today · 2 by 30 yrs out
Nearby sold comps map
Loading sold comps map…
Walkable amenities ~0.75 mi
Loading nearby amenities…
Taxation est. · year 1
- Rental income
- $17,563
- − Mortgage interest
- −$4,476
- − Property taxes
- −$2,381
- − Insurance
- −$400
- − Repairs & maintenance
- −$1,405
- − Management
- −$1,405
- − Depreciation
- −$2,324
- Taxable income
- $5,172
- Est. tax owed @ 24.0%
- −$1,241
- After-tax cash flow
- $4,825/yr
For passive investors: Depreciation is non-cash, so a rental often shows a tax loss while cash-flowing — sheltering income. Rental losses are passive: they offset passive income freely, and up to $25,000/yr can offset ordinary (W-2) income if you actively participate and your MAGI is under $100k (phasing out to $0 by $150k); unused losses carry forward. On sale, claimed depreciation is recaptured at up to 25%, and gains may owe capital-gains tax (a 1031 exchange can defer both). Figures are a year-1 estimate at your 24.0% rate — not tax advice; consult a CPA.
Schools (NCES district)
- District
- Galena Park ISD
- NCES district ID
- 4820250
- Math proficiency
- 32% ▼ -20.00%
- Reading proficiency
- 33% ▼ -7.00%
- Median HH income
- $43,158
- Composite
- 27.62/100
- National rank
- #6927
- State rank
- #578 of 826 in TX
Livability — Galena Park
- Score
- 68/100
- State rank
- #456
- US rank
- #9227
Category grades
Schools grade is shown separately in the Schools card above.
Census & demographics
- Census place
- Galena Park, TX
- City population
- 9,380
- Population (ZIP)
- 9,380
Population outlook (Harris County) Hauer SSP2
- Today (2025)
- 5,571,493 people
- By 2030
- 6,089,821 · +9.3%
- By 2040
- 7,142,806 · +28.2%
- By 2050
- 8,185,864 · +46.9%
- By 2075
- 10,574,329 · +89.8%
- By 2100
- 12,109,958 · +117.4%
Race, ethnicity, and origin ACS 2023
- Neighborhood character
- Predominantly Hispanic (90%)
- Race & ethnicity
- Hispanic / Latino 90% Two or more races 46% Black 5% White 4%
- Hispanic origin (detail)
- Mexican 88%
- Foreign-born
- 32% · Canada
- Languages at home
- 21% English-only · Spanish 79%
Political lean MEDSL · Harris
- 2024 margin
- Lean D (+5.5) · D 52.0% · R 46.4% · Other 1.6%
- 2008→2024 swing
- +3.9pp toward D · 2008: 1.6pp · 2024: 5.5pp
- All cycles
- 2024: D+5.5 2020: D+13.3 2016: D+12.4 2012: D+0.1 2008: D+1.6
Not yet ingested
- Civics
- —
Market trends
- HPI YoY
- ▲ 4.96%
- Current HPI
- 252.9899
- Rent YoY
- —
- Metro
- —
- State GDP YoY
- ▲ 3.95%
- F500 in state
- 110
Industry mix (Fortune 500 HQ in TX)
| Industry | F500 HQs | Revenue |
|---|---|---|
| Energy | 16 | $1,198B |
|
||
| Technology | 5 | $198B |
|
||
| Engineering / Construction | 4 | $72B |
|
||
| Energy Services | 3 | $60B |
|
||
| Utilities | 3 | $41B |
|
||
| Healthcare | 2 | $330B |
|
||
Price history
-19.3% since first listed9 events — show timeline
- 2026-04-15 Price Changed $79,900 HARMLS
- 2026-02-14 Price Changed $87,900 HARMLS
- 2025-11-07 Listed $93,600 HARMLS
- 2024-01-02 Relisted — HARMLS
- 2023-10-27 Listing Removed — HARMLS
- 2023-10-20 Pending — HARMLS
- 2023-10-05 Price Changed $85,000 HARMLS
- 2023-09-27 Listed $99,000 HARMLS
- 1988-01-01 Sold (Public Records) — Public Records
Property tax history
+5.8%/yrLatest (2025): $2,381 · +14.7% YoY. Source: county tax records.
Cash-flow waterfall
monthlySold comps — $/sqft
last 12 mo · ≤1 miLoading sold comps…