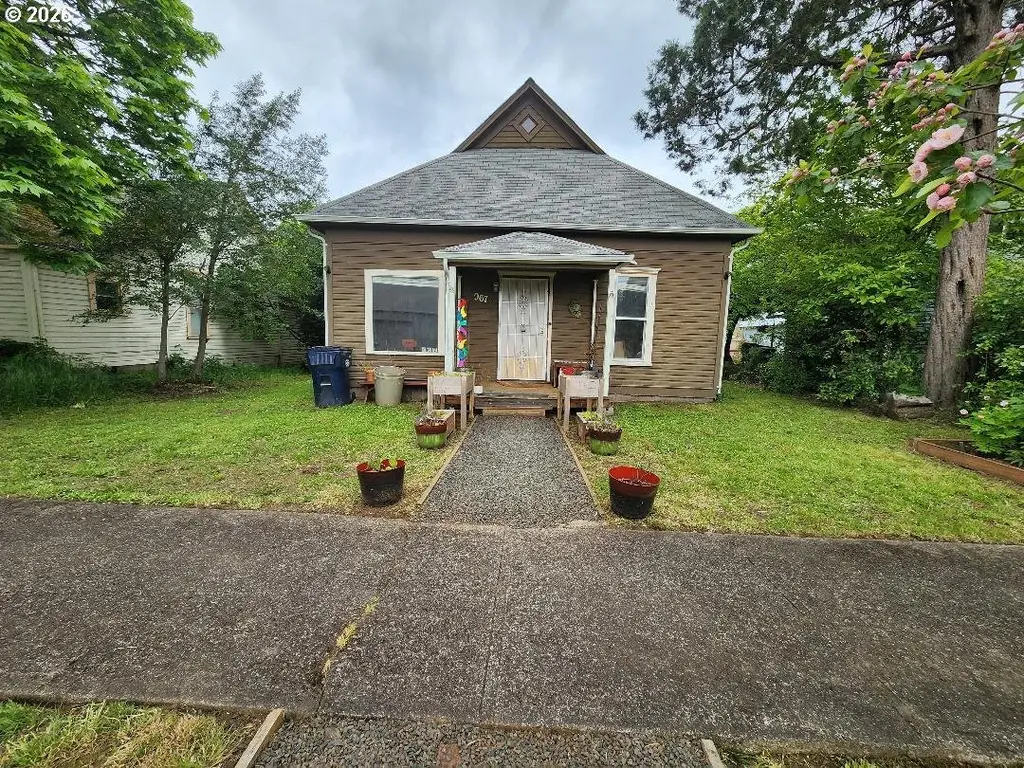
967 Greenwood St · Junction City, OR
Flood risk 8/10 · Major
- FEMA flood zone
- X (unshaded)
- Chance of flooding over 30 yrs
- 0.99%
- Est. flood insurance / yr
- $507 – $1,088
Fire risk 1/10 · Minimal
- Est. fire insurance / yr
- $498 – $926
Heat risk 4/10 · Minor
- Hot days now (above 92°F)
- 7 days/yr
- Hot days in 30 yrs
- 15 days/yr
Wind risk 1/10 · Minimal
- Chance of severe wind over 30 yrs
- —
Air-quality risk 10/10 · Severe
- Unhealthy air days now
- 12 days/yr
- Unhealthy air days in 30 yrs
- 13 days/yr
Risk factors via First Street. Map © Google.
Why this score? — see what drove the D grade
The composite is a weighted blend of 9 inputs, each scored 0–100. Each bar is that input's sub-score; the figure is the points it added to the 100-point composite (weight × sub-score).
- ARV discount +15.0/15.0
- Cash flow +8.7/30.0
- Livability +4.1/5.0
- Schools +2.9/10.0
- Rent growth +2.5/5.0
- Condition / age +2.5/5.0
- DSCR +2.4/10.0
- 1% rule +2.0/10.0
- Appreciation +0.0/10.0
$199,900
🖨 Deal sheet (PDF) 📄 Offer letter ✓ Due diligence
Listing remarks MLS
Charming vintage farmhouse style home. Large attic third bedroom. Spacious living areas, tall ceilings. Large laundry room. Detached garage.Home retains much of the original vintage character.
Key facts
- Alley access
- Block foundation
- 10x30 storage shed
Tags
Property features AI
Finance
- Other: Lot roughly 0.11 acre (3,000–4,999 sq ft range); Parcel number 0011393
- HOA & community: Not a senior community; Zoning: GC
Exterior
- Parking: On-street parking
- Utilities: Public water; Public sewer; Electric and gas available
- Home design: Single-family residence, detached; Residential property in fixer condition; No notable view
- Construction: Built in 1900; Composition roof; Foundation: block, concrete perimeter, pier/pillar/post
- Exterior features: Wood siding
Interior
- Kitchen: Kitchen (details not provided)
- Bedrooms: Primary bedroom on the main level; Second bedroom on the main level; Third bedroom on the upper level
- Bathrooms: One full bathroom (main level)
- Interior features: High ceilings; Crawl space basement
Neighborhood map
What this means for you Summary
Snapshot
- This is a 2-bed/1.0-bath single-family listed at $200k.
Deal economics
- At list price, monthly cash flow is $-236 ($-3k/yr) — negative.
- To cash-flow at today's rent, offer at most $158k (20.8% below list).
- To meet the 1% rule (rent ≥ 1% of price), the offer needs to be $140k (30.0% below list).
- Recommended offer: $140k (30.0% below list) — sets the bar for 1% rule.
- Cap rate 5.3% vs local median 2.7% in Junction City — top-decile yield for the area; either an underpriced asset or a hidden risk that comps aren't pricing in. Stress-test before assuming the spread holds.
Location & tenants
- Location reads 82/100 on livability (#46 in OR, #1,184 nationally) — a professional / high-income tenant draw. Strengths: housing A+, health & safety A+, cost of living B+.
- Junction City SD 69 (town): math 26% / reading 41% proficiency, ranked #27 of 58 in OR (top 47%) — families likely to look elsewhere, expect single-tenant / working-renter base with shorter leases.
- Zoned schools: Laurel Elementary School (math 32% / reading 42%, grade F, #205 of 412 statewide, top 51%, 501 students, 50% FRL); Oaklea Middle School (math 32% / reading 47%, grade F, #45 of 128 statewide, top 35%, 490 students, 52% FRL); Junction City High School (math 10% / reading 70%, grade F, #69 of 143 statewide, top 54%, 539 students, 43% FRL).
- Market conditions: 87 active listings in the ZIP; 6 comparable units currently listed for rent nearby; rentals at typical pace (median 16d on market — plan ~3-4 weeks tenant-placement turnaround); 1,808 units permitted in Lane County in 2024 (972 in 5+ unit buildings).
Forward outlook
- Local home prices are declining (-3.0%/yr); year-one equity from $1k of loan paydown is wiped out by about $6k of value loss. Plan a longer hold.
- Lane County population projected at +15% by 2050 — long-run rental-demand tailwind backs the buy-and-hold thesis.
Negotiation context
- It's been on market 42 days — a 3% lower offer ($194k) is reasonable based on typical stale-listing flexibility.
- 4 sale attempts since 25y ago; this cycle's ask has dropped $25k (11%) from the opening price — seller is motivated, your offer sets the floor, not the list.
Risks & watch-outs
- Watch-outs: flood insurance adds $66/mo; built in 1900 — expect roof / HVAC / electrical / plumbing capex.
- Climate carrying-cost: severe flood risk — expect insurance premiums to compound above CPI over the hold.
Questions for the listing agent
- What do current leases actually rent for vs. the listed asking? Can we see a recent rent roll and the last 12 months of T-12 income?
- It's been on market 42 days. Have you received any prior offers? Is the seller open to a 30% concession, seller financing, or rate buy-down credit?
- Built in 1900 — when were the roof, HVAC, electrical panel, plumbing, and water heater last replaced?
- What's the actual annual flood-insurance premium (NFIP or private), and is the property in a SFHA with mandatory coverage?
- Is there a deadline driving the sale (1031 exchange, divorce, estate, relocation)? That informs how much negotiation room exists.
- Schools are D-rated, which usually means shorter tenancies and higher turnover. Who's the typical renter profile here, and what's been the actual vacancy rate?
- The area grade is low — what's the realistic commute time and amenity access for the typical tenant pool here? Any planned neighborhood developments (good or bad) we should know about?
- What's the average days-on-market for RENTAL listings here right now (not sales)? A rising rental-DOM trend means longer vacancies and softer asking-rent achievability than the comps imply.
- What's the recent tenant-quality profile in this submarket — average credit score on applications, eviction rate, late-payment / NSF rate, and stable-employment percentage? A property-management company in the area should have these aggregated.
- How much new for-sale + rental construction is in the pipeline within 1–3 miles? Heavy new supply typically softens prices + rents 12–24 months out; constrained supply supports both.
Investment metrics
- 1% rule
- 0.70% ✗
- Cap rate
- 5.28%
- Cash-on-cash
- -3.63%
- DSCR
- 0.84
- GRM
- 11.9
CMA / ARV
- ARV (median comp)
- $344,906
- List price
- $199,900
- Delta
- -42.04%
- Verdict
- UNDERPRICED
- Comps
- 20 within 1.0 mi
Show comp detail 12 sales within ~0.75 mi
| Address | Dist | Beds/Ba | Sqft | Sold | Price | $/sf | Match |
|---|---|---|---|---|---|---|---|
| 954 Elm St | 0.15mi | 2/1.0 | 978 (+1%) | 6mo | $285,000 | $291 | 86 |
| 805 Deal St | 0.19mi | 3/1.0 (+1) | 1,024 (+6%) | 7mo | $279,000 | $272 | 70 |
| 1540 Juniper St | 0.36mi | 2/2.0 | 988 (+2%) | 10mo | $339,000 | $343 | 67 |
| 1138 W 7th Pl | 0.49mi | 3/1.0 (+1) | 936 (-3%) | 1mo | $330,000 | $353 | 66 |
| 455 Crona St | 0.53mi | 3/1.0 (+1) | 988 (+2%) | 3mo | $332,000 | $336 | 64 |
| 810 Birch St | 0.32mi | 3/1.0 (+1) | 1,058 (+10%) | 5mo | $318,000 | $301 | 60 |
| 775 Alder St | 0.35mi | 3/1.0 (+1) | 1,040 (+8%) | 11mo | $331,500 | $319 | 57 |
| 271 Alder St | 0.53mi | 3/1.0 (+1) | 912 (-6%) | 6mo | $360,000 | $395 | 56 |
| 790 Birch St | 0.33mi | 3/2.0 (+1) | 1,092 (+13%) | 0mo | $345,000 | $316 | 54 |
| 1010 E Birch Pl | 0.32mi | 3/2.0 (+1) | 1,092 (+13%) | 7mo | $360,000 | $330 | 48 |
| 471 Birch St | 0.41mi | 3/2.0 (+1) | 1,094 (+13%) | 3mo | $247,900 | $227 | 48 |
| 191 SW Quince St | 0.75mi | 3/2.0 (+1) | 1,030 (+7%) | 8mo | $389,000 | $378 | 38 |
Match score weights: distance 35% · size 25% · config 20% · recency 20%. Top-matched comps best support the ARV.
Projected returns pro-forma
-3.0% appreciation · 3.0% rent growth · sell at horizon
- IRR
- -24.9%
- Equity multiple
- 0.15×
- Total profit
- $-47,412
- Equity at exit
- $29,806
- IRR
- -20.8%
- Equity multiple
- -0.08×
- Total profit
- $-60,636
- Equity at exit
- $17,284
Cash invested: $55,972 (down + closing). Projections, not guarantees.
Landlord ↔ Tenant lean methodology
- Overall (STATE)
- 28 Tenant-Leaning
- State Oregon
- 28 Tenant-Leaning · D+6
- County
- — inherits STATE
- City
- — inherits STATE
ZIP-level market 97448
- Home prices YoY
- -35.0%
- Active inventory
- 87
- Price-to-rent
- 11.9×
Monthly cashflow live
- Estimated rent
- $1,399 high interval (Pro) →
- Mortgage (P&I)
- −$1,048
- Tax from tax record
- −$143 /mo · $1,716/yr
- Insurance
- −$83
- Flood insurance flood zone
- −$66 /mo · $798/yr
- HOA
- −$0
- Vacancy / Maint / Mgmt
- −$294
- Net cashflow
- $-236
Break-even live
Sensitivity live
| Price | -10% $-123 | -5% $-179 | +0% $-236 | +5% $-292 | +10% $-349 |
|---|---|---|---|---|---|
| Rent | -10% $-346 | -5% $-291 | +0% $-236 | +5% $-181 | +10% $-125 |
| Rate | -1.0pp $-135 | -0.5pp $-185 | base $-236 | +0.5pp $-288 | +1.0pp $-340 |
UW: 25.0% down · 7.5% · 30yr · 1.5% tax · 5.0% vac · 8.0% maint · 8.0% mgmt
Financing live
Cash to close
- Down payment
- $49,975
- Closing costs
- $5,997
- Reserves months
- —
- Total cash needed
- —
Loan-product check · same deal, 3 products live
Conventional
25% down · 7.5% · 30yr
- Down + closing
- —
- Monthly P&I
- —
- Monthly cashflow
- —
- DSCR
- —
- Eligible?
- —
Personal DTI + credit; lowest rate.
DSCR
20% down · 8.5% · 30yr
- Down + closing
- —
- Monthly P&I
- —
- Monthly cashflow
- —
- DSCR
- —
- Eligible?
- —
No personal income docs; deal must DSCR.
Hard money
10% down · 12.0% · 12mo
- Down + closing
- —
- Monthly P&I
- —
- Monthly cashflow
- —
- DSCR
- —
- Eligible?
- —
Short-term bridge; refi at stabilization.
Rent comps 6 comps
| Address | Beds | Baths | Sqft | Rent | $/sqft | DOM | Units | Dist |
|---|---|---|---|---|---|---|---|---|
| 151 Maple St Unit 20102 Junction City, OR | 2.0 | 1.0 | 810 | $1,295 | $1.60 | 15d | 1 | 0.56mi |
| 165 SW Kalmia St Ste 3 Junction City, OR | 2.0 | 1.0 | 886 | $1,295 | $1.46 | 15d | 1 | 0.56mi |
| 165 SW Kalmia St Unit 4 Junction City, OR | 2.0 | 1.0 | 886 | $1,295 | $1.46 | 45d | 1 | 0.56mi |
| 2254 W 10th Ave Unit 414-115 Junction City, OR | 2.0 | 2.0 | 968 | $1,599 | $1.65 | 45d | 1 | 1.04mi |
| 2280 W 10th Ave Unit 414-259 Junction City, OR | 2.0 | 2.0 | 968 | $1,565 | $1.62 | 15d | 1 | 1.09mi |
| 2272 W 10th Ave Junction City, OR | 2.0 | 2.0 | 990 | $1,575 | $1.59 | 15d | 1 | 1.14mi |
Listing history 22 events
-
2026-06-10status $199,900 Pending 42 DOM
-
2026-06-09days on market $199,900 Active 42 DOM
-
2026-06-08days on market $199,900 Active 41 DOM
-
2026-06-07days on market $199,900 Active 40 DOM
-
2026-06-05days on market $199,900 Active 37 DOM
-
2026-06-03days on market $199,900 Active 36 DOM
-
2026-06-02days on market $199,900 Active 35 DOM
-
2026-06-01days on market $199,900 Active 34 DOM
-
2026-05-31days on market $199,900 Active 33 DOM
-
2026-05-30days on market $199,900 Active 32 DOM
-
2026-04-28$225,000 Active 605-char remark
-
2016-06-10soldstatus $88,500 Sold 192-char remark
Show marketing remark (192 chars)
Charming vintage farmhouse style home. Large attic third bedroom. Spacious living areas, tall ceilings. Large laundry room. Detached garage.Home retains much of the original vintage character.
-
2016-05-10status Pending 192-char remark
Show marketing remark (192 chars)
Charming vintage farmhouse style home. Large attic third bedroom. Spacious living areas, tall ceilings. Large laundry room. Detached garage.Home retains much of the original vintage character.
-
2016-04-22$93,900 Active 192-char remark
Show marketing remark (192 chars)
Charming vintage farmhouse style home. Large attic third bedroom. Spacious living areas, tall ceilings. Large laundry room. Detached garage.Home retains much of the original vintage character.
-
2006-01-05soldstatus $151,900
Show marketing remark (287 chars)
completely remodeled vintage home, adorable and move-in ready! freshly painted in and out, new carpet/floor coverings, 9 1/2' ceilings on main level, ceiling fan, cheery sunroom w/french door off kitchen,indoor util., new gutters,newer roof,fenced yard,12x28 shop,alley acc.,inc. fridge.
-
2006-01-03soldstatus $151,900
-
2005-11-25historical
Show marketing remark (287 chars)
completely remodeled vintage home, adorable and move-in ready! freshly painted in and out, new carpet/floor coverings, 9 1/2' ceilings on main level, ceiling fan, cheery sunroom w/french door off kitchen,indoor util., new gutters,newer roof,fenced yard,12x28 shop,alley acc.,inc. fridge.
-
2005-11-16$149,900
Show marketing remark (287 chars)
completely remodeled vintage home, adorable and move-in ready! freshly painted in and out, new carpet/floor coverings, 9 1/2' ceilings on main level, ceiling fan, cheery sunroom w/french door off kitchen,indoor util., new gutters,newer roof,fenced yard,12x28 shop,alley acc.,inc. fridge.
-
2005-08-19soldstatus $109,500
-
2001-09-18soldstatus $40,000
-
2001-09-18soldstatus $40,000
-
2001-05-04$45,000
ⓘ Source: listings_history table (triggers on properties + properties_extension) + one-shot
backfill from property_details.listing_events for pre-trigger history.
Tax reassessment forecast OR · Resets to sale price
- Current annual tax
- $1,716 · $143/mo
- Projected year-2 tax
- $1,939 · $162/mo
- Expected delta
- +$223/yr (+$19/mo · 13.0%)
ⓘ Screening estimate from a state-policy table — verify with the county assessor before closing.
Climate risk First Street
- Flood 8/10 Severe FEMA zone X (unshaded) · 99% chance over 30 yrs
- Wildfire 1/10 Low
- Heat 4/10 Moderate 7 d/yr ≥92°F today · 15 d/yr by 30 yrs out
- Wind 1/10 Low
- Air quality 10/10 Extreme 12 unhealthy d/yr today · 13 by 30 yrs out
Nearby sold comps map
Loading sold comps map…
Walkable amenities ~0.75 mi
Loading nearby amenities…
Taxation est. · year 1
- Rental income
- $16,789
- − Mortgage interest
- −$11,198
- − Property taxes
- −$1,716
- − Insurance
- −$1,797
- − Repairs & maintenance
- −$1,343
- − Management
- −$1,343
- − Depreciation
- −$5,815
- Taxable loss
- −$6,423
- Est. tax savings @ 24.0%
- +$1,542
- After-tax cash flow
- $-1,288/yr
For passive investors: Depreciation is non-cash, so a rental often shows a tax loss while cash-flowing — sheltering income. Rental losses are passive: they offset passive income freely, and up to $25,000/yr can offset ordinary (W-2) income if you actively participate and your MAGI is under $100k (phasing out to $0 by $150k); unused losses carry forward. On sale, claimed depreciation is recaptured at up to 25%, and gains may owe capital-gains tax (a 1031 exchange can defer both). Figures are a year-1 estimate at your 24.0% rate — not tax advice; consult a CPA.
Schools (NCES district)
- District
- Junction City SD 69
- NCES district ID
- 4106930
- Math proficiency
- 26% ▼ -10.00%
- Reading proficiency
- 41% ▼ -11.00%
- Median HH income
- $50,018
- Composite
- 29.05/100
- National rank
- #6608
- State rank
- #27 of 58 in OR
Livability — Junction City
- Score
- 82/100
- State rank
- #46
- US rank
- #1184
Category grades
Schools grade is shown separately in the Schools card above.
Census & demographics
- Census place
- Junction City, OR
- Population (ZIP)
- 14,629
Population outlook (Lane County) Hauer SSP2
- Today (2025)
- 391,933 people
- By 2030
- 405,860 · +3.6%
- By 2040
- 429,386 · +9.6%
- By 2050
- 452,016 · +15.3%
- By 2075
- 508,825 · +29.8%
- By 2100
- 531,208 · +35.5%
Race, ethnicity, and origin ACS 2023
- Neighborhood character
- Predominantly White (84%)
- Race & ethnicity
- White 84% Two or more races 8% Hispanic / Latino 8%
- Hispanic origin (detail)
- Mexican 6%
- Common ancestry
- Lithuanian 4% Portuguese 2% Italian 2%
- Foreign-born
- 3% · Canada
- Languages at home
- 95% English-only · Spanish 4%
Political lean MEDSL · Lane
- 2024 margin
- Strong D (+23.1) · D 60.0% · R 36.9% · Other 3.1%
- 2008→2024 swing
- -4.3pp toward R · 2008: 27.4pp · 2024: 23.1pp
- All cycles
- 2024: D+23.1 2020: D+24.3 2016: D+18.9 2012: D+23.4 2008: D+27.4
Not yet ingested
- Civics
- —
Market trends
- HPI YoY
- ▼ -151.05%
- Current HPI
- 281.1105
- Rent YoY
- —
- Metro
- —
- State GDP YoY
- ▲ 2.05%
- F500 in state
- 2
Industry mix (Fortune 500 HQ in OR)
| Industry | F500 HQs | Revenue |
|---|---|---|
| Consumer Goods | 1 | $51B |
|
||
Price history
+311.1% since first listed16 events — show timeline
- 2026-06-17 Sold (MLS) $185,000 RMLS
- 2026-06-09 Pending — RMLS
- 2026-05-26 Price Changed $199,900 RMLS
- 2026-05-19 Price Changed $215,000 RMLS
- 2026-04-28 Listed $225,000 RMLS
- 2016-06-10 Sold (MLS) $88,500 RMLS
- 2016-05-10 Pending — RMLS
- 2016-04-22 Listed $93,900 RMLS
- 2006-01-05 Sold (MLS) $151,900 RMLS
- 2006-01-03 Sold (Public Records) $151,900 Public Records
- 2005-11-25 Delisted — RMLS
- 2005-11-16 Listed $149,900 RMLS
- 2005-08-19 Sold (Public Records) $109,500 Public Records
- 2001-09-18 Sold (Public Records) $40,000 Public Records
- 2001-09-18 Sold (MLS) $40,000 RMLS
- 2001-05-04 Listed $45,000 RMLS
Property tax history
+4.0%/yrLatest (2025): $1,716 · +3.6% YoY. Source: county tax records.
Cash-flow waterfall
monthlySold comps — $/sqft
last 12 mo · ≤1 miLoading sold comps…