5750 Paradise Dr · Lumberton, TX
Flood risk 6/10 · Moderate
- FEMA flood zone
- X (unshaded)
- Chance of flooding over 30 yrs
- 0.74%
- Est. flood insurance / yr
- $507 – $1,088
Fire risk 5/10 · Moderate
- Est. fire insurance / yr
- $1,222 – $2,270
Heat risk 9/10 · Severe
- Hot days now (above 112°F)
- 7 days/yr
- Hot days in 30 yrs
- 23 days/yr
Wind risk 9/10 · Severe
- Chance of severe wind over 30 yrs
- 99.0%
Air-quality risk 2/10 · Minimal
- Unhealthy air days now
- 1 days/yr
- Unhealthy air days in 30 yrs
- 1 days/yr
Risk factors via First Street. Map © Google.
Why this score? — see what drove the B+ grade
The composite is a weighted blend of 9 inputs, each scored 0–100. Each bar is that input's sub-score; the figure is the points it added to the 100-point composite (weight × sub-score).
- Cash flow +30.0/30.0
- ARV discount +15.0/15.0
- 1% rule +10.0/10.0
- DSCR +10.0/10.0
- Livability +3.8/5.0
- Schools +3.0/10.0
- Rent growth +2.5/5.0
- Condition / age +2.5/5.0
- Appreciation +0.0/10.0
$119,000
🖨 Deal sheet 📄 Offer letter ✓ Due diligence
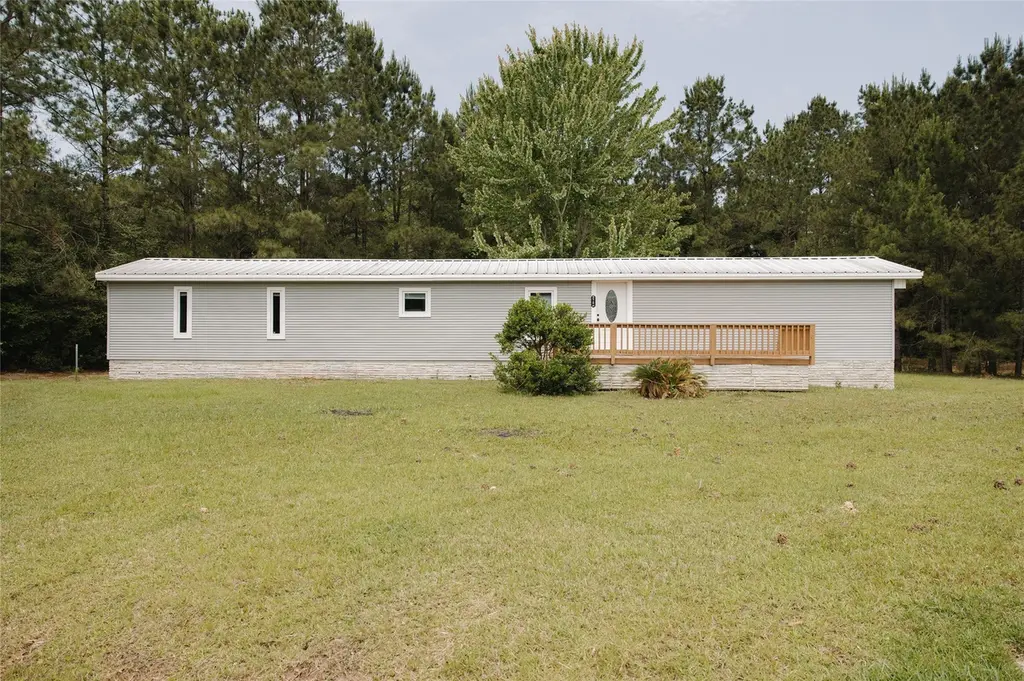
Listing remarks
Welcome to this charming mobile home located in Lumberton, TX. This is a sought after school district. Nestled on a spacious dead end cul-de-sac lot, this home has a comfortable living environment with an open floor plan and abundant natural light. Enjoy the convenience of a well-appointed kitchen, ample storage space, and a cozy living area. The outdoor space provides room for relaxation on large covered back deck, or gardening. Make this delightful property your new haven.
Key facts
- Cul-de-sac lot
- Covered back deck
- School district
Tags
Property features AI
Exterior
- Utilities: Public sewer
- Home design: Residential property; Built in 2005; Pillar/post/pier foundation
- Construction: Wood siding exterior; Metal roof
- Exterior features: Subdivision lot
Interior
- Bedrooms: Primary bedroom on the first floor (16 x 13); Bedroom on the first floor (13 x 10); Bedroom on the second floor (10 x 16)
- Bathrooms: 2 full bathrooms
- Heating & cooling: Central heating (electric); Central air conditioning (electric)
- Interior features: 3 total rooms
Neighborhood map
What this means for you Summary
Snapshot
- This is a 3-bed/2.0-bath manufactured listed at $119k.
Deal economics
- At list price, monthly cash flow is $945 ($11k/yr) — positive.
- The deal already cash-flows at list — no discount required.
- Meets the 1% rule at list price ($2k rent vs $119k).
- Recommended offer: $115k (3.0% below list) — sets the bar for market timing.
- Cap rate 15.8% vs local median 3.2% in Lumberton — top-decile yield for the area; either an underpriced asset or a hidden risk that comps aren't pricing in. Stress-test before assuming the spread holds.
Location & tenants
- Location reads 75/100 on livability (#160 in TX, #4,326 nationally) — a middle-class / working-renter tenant base. Strengths: crime A+, employment A+, cost of living A+; Watch: amenities F, commute F.
- Kountze ISD (rural): math 35% / reading 35% proficiency, ranked #506 of 826 in TX (top 61%) — families likely to look elsewhere, expect single-tenant / working-renter base with shorter leases.
- Market conditions: 318 active listings in the ZIP; 4 comparable units currently listed for rent nearby; rentals leasing fast (median 14d on market — plan ~1-2 weeks tenant-placement turnaround); solid renter incomes; 358 units permitted in Hardin County in 2024 (0 in 5+ unit buildings).
Forward outlook
- Local home prices are declining (-3.0%/yr); year-one equity from $823 of loan paydown is wiped out by about $4k of value loss. Plan a longer hold.
- At projected returns (-3.0% appreciation + 3.0% rent growth), your $33k cash investment doubles in ~4 years — after that, you're playing with house money.
Negotiation context
- It's been on market 41 days — a 3% lower offer ($115k) is reasonable based on typical stale-listing flexibility.
- Current owner paid $23k; list at $119k implies a 419% gain — meaningful room to come down on a strong offer.
Risks & watch-outs
- Climate carrying-cost: major flood risk; severe wind risk, 99% chance of damaging wind over 30y; moderate wildfire risk; extreme-heat days projected 7→23/yr by 2055 (HVAC capex compounding) — expect insurance premiums to compound above CPI over the hold.
Questions for the listing agent
- It's been on market 41 days. Have you received any prior offers? Is the seller open to a 3% concession, seller financing, or rate buy-down credit?
- Is there a deadline driving the sale (1031 exchange, divorce, estate, relocation)? That informs how much negotiation room exists.
- What's the average days-on-market for RENTAL listings here right now (not sales)? A rising rental-DOM trend means longer vacancies and softer asking-rent achievability than the comps imply.
- What's the recent tenant-quality profile in this submarket — average credit score on applications, eviction rate, late-payment / NSF rate, and stable-employment percentage? A property-management company in the area should have these aggregated.
- How much new for-sale + rental construction is in the pipeline within 1–3 miles? Heavy new supply typically softens prices + rents 12–24 months out; constrained supply supports both.
Investment metrics
- 1% rule
- 1.80% ✓
- Cap rate
- 15.83%
- Cash-on-cash
- 34.05%
- DSCR
- 2.51
- GRM
- 4.6
CMA / ARV
- ARV (median comp)
- $149,000
- List price
- $119,000
- Delta
- -20.13%
- Verdict
- UNDERPRICED
- Comps
- 1 within 2.0 mi
Projected returns pro-forma
-3.0% appreciation · 3.0% rent growth · sell at horizon
- IRR
- 29.4%
- Equity multiple
- 2.23×
- Total profit
- $40,914
- Equity at exit
- $17,743
- IRR
- 36.7%
- Equity multiple
- 4.39×
- Total profit
- $113,099
- Equity at exit
- $10,289
Cash invested: $33,320 (down + closing). Projections, not guarantees.
Landlord ↔ Tenant lean methodology
- Overall (STATE)
- 87 Strongly Landlord-Friendly
- State Texas
- 87 Strongly Landlord-Friendly · R+5
- County
- — inherits STATE
- City
- — inherits STATE
ZIP-level market 77657
- Active inventory
- 318
- Price-to-rent
- 4.6×
Monthly cashflow live
- Estimated rent
- $2,140 medium interval (Pro) →
- Mortgage (P&I)
- −$624
- Tax from tax record
- −$72 /mo · $862/yr
- Insurance
- −$50
- HOA
- −$0
- Vacancy / Maint / Mgmt
- −$449
- Net cashflow
- $945
Break-even live
UW: 25.0% down · 7.5% · 30yr · 1.5% tax · 5.0% vac · 8.0% maint · 8.0% mgmt
Financing live
Cash to close
- Down payment
- $29,750
- Closing costs
- $3,570
- Reserves months
- —
- Total cash needed
- —
Loan-product check · same deal, 3 products live
Conventional
25% down · 7.5% · 30yr
- Down + closing
- —
- Monthly P&I
- —
- Monthly cashflow
- —
- DSCR
- —
- Eligible?
- —
Personal DTI + credit; lowest rate.
DSCR
20% down · 8.5% · 30yr
- Down + closing
- —
- Monthly P&I
- —
- Monthly cashflow
- —
- DSCR
- —
- Eligible?
- —
No personal income docs; deal must DSCR.
Hard money
10% down · 12.0% · 12mo
- Down + closing
- —
- Monthly P&I
- —
- Monthly cashflow
- —
- DSCR
- —
- Eligible?
- —
Short-term bridge; refi at stabilization.
Rent comps 4 comps
| Address | Beds | Baths | Sqft | Rent | $/sqft | DOM | Units | Dist |
|---|---|---|---|---|---|---|---|---|
| 5525 Westchase Loop Lumberton, TX | 3.0 | 2.0 | 1384 | $2,100 | $1.52 | 13d | 1 | 0.17mi |
| 30 Stephens Ln Lumberton, TX | 2.0 | 2.0 | 1290 | $1,650 | $1.28 | 43d | 1 | 0.62mi |
| 5670 Shadowbend Cir N Unit 104 Lumberton, TX | 3.0 | 2.5 | 1500 | $1,900 | $1.27 | 13d | 1 | 0.66mi |
| 65 Jordan Dr Lumberton, TX | 4.0 | 2.0 | 1352 | $1,995 | $1.48 | 13d | 1 | 1.46mi |
Listing history 19 events
-
2026-06-18days on market $119,000 Active 41 DOM
-
2026-06-17days on market $119,000 Active 40 DOM
-
2026-06-16days on market $119,000 Active 39 DOM
-
2026-06-15days on market $119,000 Active 38 DOM
-
2026-06-14days on market $119,000 Active 36 DOM
-
2026-06-13days on market $119,000 Active 35 DOM
-
2026-06-10days on market $119,000 Active 33 DOM
-
2026-06-09days on market $119,000 Active 32 DOM
-
2026-06-08days on market $119,000 Active 31 DOM
-
2026-06-07days on market $119,000 Active 30 DOM
-
2026-06-05days on market $119,000 Active 27 DOM
-
2026-06-03days on market $119,000 Active 26 DOM
-
2026-06-02days on market $119,000 Active 25 DOM
-
2026-06-01days on market $119,000 Active 24 DOM
-
2026-05-31days on market $119,000 Active 23 DOM
-
2026-05-30days on market $119,000 Active 22 DOM
-
2026-05-08$119,000 Active 481-char remark
-
2003-10-09soldstatus $22,925
-
1999-05-01soldstatus $44,000
ⓘ Source: listings_history table (triggers on properties + properties_extension) + one-shot
backfill from property_details.listing_events for pre-trigger history.
Tax reassessment forecast TX · Resets to sale price
- Current annual tax
- $862 · $72/mo
- Projected year-2 tax
- $2,178 · $181/mo
- Expected delta
- +$1,315/yr (+$110/mo · 152.5%)
ⓘ Screening estimate from a state-policy table — verify with the county assessor before closing.
Climate risk First Street
- Flood 6/10 Major FEMA zone X (unshaded) · 74% chance over 30 yrs
- Wildfire 5/10 Major
- Heat 9/10 Extreme 7 d/yr ≥112°F today · 23 d/yr by 30 yrs out
- Wind 9/10 Extreme 99% chance of damaging wind over 30 yrs
- Air quality 2/10 Low 1 unhealthy d/yr today · 1 by 30 yrs out
Nearby sold comps map
Loading sold comps map…
Walkable amenities ~0.75 mi
Loading nearby amenities…
Taxation est. · year 1
- Rental income
- $25,684
- − Mortgage interest
- −$6,666
- − Property taxes
- −$862
- − Insurance
- −$595
- − Repairs & maintenance
- −$2,055
- − Management
- −$2,055
- − Depreciation
- −$3,462
- Taxable income
- $9,990
- Est. tax owed @ 24.0%
- −$2,398
- After-tax cash flow
- $8,947/yr
For passive investors: Depreciation is non-cash, so a rental often shows a tax loss while cash-flowing — sheltering income. Rental losses are passive: they offset passive income freely, and up to $25,000/yr can offset ordinary (W-2) income if you actively participate and your MAGI is under $100k (phasing out to $0 by $150k); unused losses carry forward. On sale, claimed depreciation is recaptured at up to 25%, and gains may owe capital-gains tax (a 1031 exchange can defer both). Figures are a year-1 estimate at your 24.0% rate — not tax advice; consult a CPA.
Schools (NCES district)
- District
- Kountze ISD
- NCES district ID
- 4825920
- Math proficiency
- 35% ▼ -11.00%
- Reading proficiency
- 35% ▼ -7.00%
- Median HH income
- $50,702
- Composite
- 30.42/100
- National rank
- #6244
- State rank
- #506 of 826 in TX
Livability — Lumberton
- Score
- 75/100
- State rank
- #160
- US rank
- #4326
Category grades
Schools grade is shown separately in the Schools card above.
Census & demographics
- County
- Hardin County · 39,783 people
- Metro
- Beaumont-Port Arthur, TX
- Population (ZIP)
- 22,258
- Household income
- $95,718
- Rent vs Own
- Severe rent burden
- 147.0
Population outlook (Hardin County) Hauer SSP2
- Today (2025)
- 57,780 people
- By 2030
- 58,296 · +0.9%
- By 2040
- 58,421 · +1.1%
- By 2050
- 57,391 · -0.7%
- By 2075
- 53,132 · -8.0%
- By 2100
- 44,905 · -22.3%
Race, ethnicity, and origin ACS 2023
- Neighborhood character
- Predominantly White (89%)
- Race & ethnicity
- White 89% Hispanic / Latino 5% Two or more races 5%
- Hispanic origin (detail)
- Mexican 4%
- Common ancestry
- Lithuanian 10% Serbian 3% Slovak 2%
- Foreign-born
- 2% · Canada
- Languages at home
- 97% English-only · Spanish 2%
Political lean MEDSL · Hardin
- 2024 margin
- Solid R (+75.8) · D 11.9% · R 87.7%
- 2008→2024 swing
- -14.6pp toward R · 2008: -61.2pp · 2024: -75.8pp
- All cycles
- 2024: R+75.8 2020: R+73.8 2016: R+73.9 2012: R+67.6 2008: R+61.2
Not yet ingested
- Civics
- —
Market trends
- HPI YoY
- ▼ -160.56%
- Current HPI
- 156.2265
- Rent YoY
- —
- Metro
- Beaumont-Port Arthur, TX
- State GDP YoY
- ▲ 3.95%
- F500 in state
- 110
Industry mix (Fortune 500 HQ in TX)
| Industry | F500 HQs | Revenue |
|---|---|---|
| Energy | 16 | $1,198B |
|
||
| Technology | 5 | $198B |
|
||
| Engineering / Construction | 4 | $72B |
|
||
| Energy Services | 3 | $60B |
|
||
| Utilities | 3 | $41B |
|
||
| Healthcare | 2 | $330B |
|
||
Price history
+170.5% since first listed3 events — show timeline
- 2026-05-08 Listed $119,000 HARMLS
- 2003-10-09 Sold (Public Records) $22,925 Public Records
- 1999-05-01 Sold (Public Records) $44,000 Public Records
Property tax history
+3.5%/yrLatest (2025): $862 · -0.8% YoY. Source: county tax records.
Cash-flow waterfall
monthlySold comps — $/sqft
last 12 mo · ≤1 miLoading sold comps…