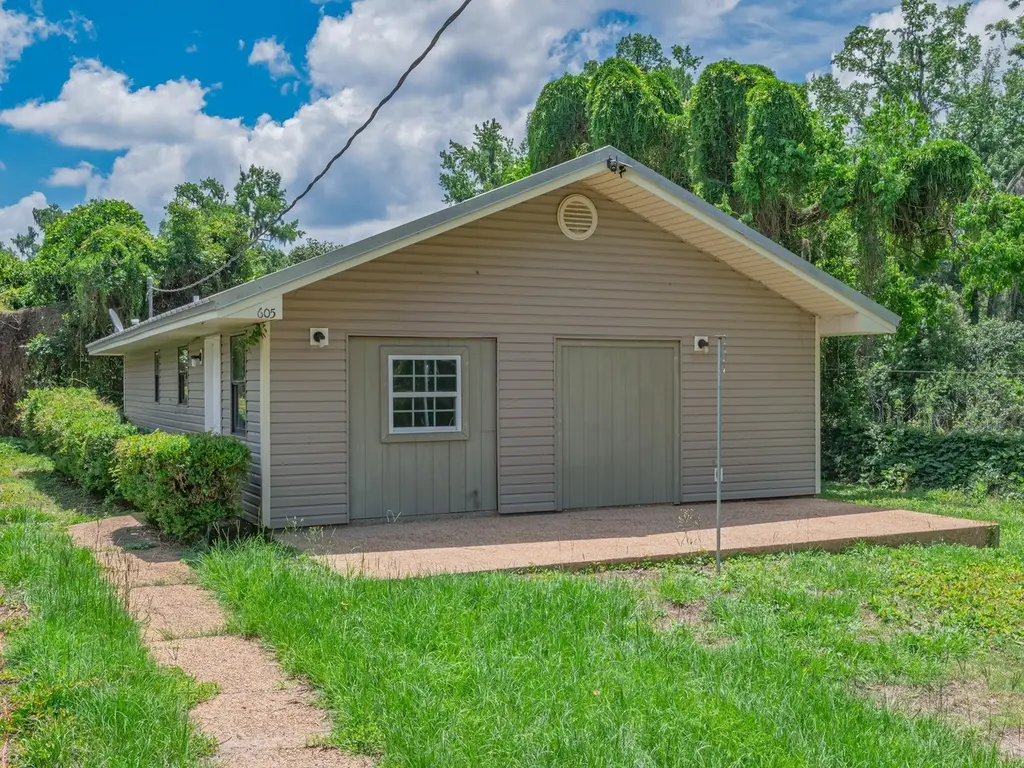
605 E Seaboard St · Tallahassee, FL
Flood risk 1/10 · Minimal
- FEMA flood zone
- X (unshaded)
- Chance of flooding over 30 yrs
- 0.0%
- Est. flood insurance / yr
- $507 – $1,088
Fire risk 3/10 · Minor
- Est. fire insurance / yr
- $947 – $1,759
Heat risk 8/10 · Major
- Hot days now (above 108°F)
- 7 days/yr
- Hot days in 30 yrs
- 20 days/yr
Wind risk 9/10 · Severe
- Chance of severe wind over 30 yrs
- 99.0%
Air-quality risk 4/10 · Minor
- Unhealthy air days now
- 5 days/yr
- Unhealthy air days in 30 yrs
- 6 days/yr
Risk factors via First Street. Map © Google.
Why this score? — see what drove the C grade
The composite is a weighted blend of 9 inputs, each scored 0–100. Each bar is that input's sub-score; the figure is the points it added to the 100-point composite (weight × sub-score).
- Cash flow +17.6/30.0
- ARV discount +15.0/15.0
- DSCR +5.5/10.0
- 1% rule +4.7/10.0
- Schools +4.3/10.0
- Livability +4.3/5.0
- Rent growth +3.5/5.0
- Condition / age +2.2/5.0
- Appreciation +0.0/10.0
$150,000
🖨 Deal sheet 📄 Offer letter ✓ Due diligence
Listing remarks
Downtown Tallahassee Living at Its Best! Discover a rare opportunity just off Lafayette Street — perfectly situated next to more than 60 acres of beautiful city parks, including Cascades Park and Myers Park. Enjoy direct access to walking trails, scenic lakes, tennis courts, baseball fields, and the Myers Park Pool, only 600 feet away! You’ll love the convenience of being within a quarter mile of restaurants, shopping, and downtown entertainment, offering the perfect blend of nature, recreation, and city living. These two homes must be sold together. 603 E Seaboard St: 3 bedrooms, 2 baths, built in 1991, all vinyl siding 605 E Seaboard St: 2 bedrooms, 1 bath, built in 1984, all
Key facts
- Tennis courts
- Scenic lakes
- Myers park pool
Tags
Property features AI
Finance
- Other: Lot about 0.2 acre; Road surface unimproved
- Financial info: Offered for sale
Exterior
- Parking: On-street parking
- Utilities: Public sewer; Public maintained road
- Home design: Single-story home; Vinyl siding
- Construction: Vinyl siding construction
- Exterior features: Covered porch/patio
Interior
- Kitchen: Dishwasher; Icemaker; Oven; Range; Refrigerator
- Bedrooms: Bedroom 2 — 12 x 11
- Flooring: Plank flooring; Tile flooring; Vinyl flooring
- Bathrooms: 1 full bathroom
- Heating & cooling: Central heating; Central air; Electric cooling; Heat pump
- Interior features: Tray ceilings; Vaulted ceilings; Walk-in closets
- Laundry & utility: Utility room
Neighborhood map
What this means for you Summary
Snapshot
- This is a 2-bed/1.0-bath single-family listed at $150k. Condition is rated fair.
Deal economics
- At list price, monthly cash flow is $118 ($1k/yr) — positive.
- The deal already cash-flows at list — no discount required.
- To meet the 1% rule (rent ≥ 1% of price), the offer needs to be $146k (2.6% below list).
- Recommended offer: $146k (3.0% below list) — sets the bar for market timing.
- Cap rate 7.2% vs local median 4.2% in Tallahassee — top-decile yield for the area; either an underpriced asset or a hidden risk that comps aren't pricing in. Stress-test before assuming the spread holds.
Location & tenants
- Location reads 86/100 on livability (#19 in FL, #429 nationally) — a professional / high-income tenant draw. Strengths: amenities A+, commute A+, health & safety A+; Watch: employment D.
- Leon (urban): math 48% / reading 53% proficiency, ranked #33 of 73 in FL (top 45%) — acceptable for families but not a draw, mixed tenant base, ~2y average lease.
- Market conditions: Rents rising fast (+4.2%/yr); 121 active listings in the ZIP; 37 comparable units currently listed for rent nearby; rentals at typical pace (median 21d on market — plan ~3-4 weeks tenant-placement turnaround); 1,765 units permitted in Leon County in 2024 (975 in 5+ unit buildings).
- This rent runs 34% of the median local income ($51k/yr) — at the standard rent-burdened threshold; future hikes will face affordability resistance.
Forward outlook
- Local home prices are declining (-3.0%/yr); year-one equity from $1k of loan paydown is wiped out by about $4k of value loss. Plan a longer hold.
- Leon County population projected at +23% by 2050 — long-run rental-demand tailwind backs the buy-and-hold thesis.
Negotiation context
- It's been on market 35 days — a 3% lower offer ($146k) is reasonable based on typical stale-listing flexibility.
Risks & watch-outs
- Climate carrying-cost: severe wind risk, 99% chance of damaging wind over 30y; extreme-heat days projected 7→20/yr by 2055 (HVAC capex compounding) — expect insurance premiums to compound above CPI over the hold.
Questions for the listing agent
- It's been on market 35 days. Have you received any prior offers? Is the seller open to a 3% concession, seller financing, or rate buy-down credit?
- Have any recent inspections been done? Can we get a copy of the seller's disclosures and any deferred-maintenance estimates?
- Is there a deadline driving the sale (1031 exchange, divorce, estate, relocation)? That informs how much negotiation room exists.
- Schools are B-rated — typically a magnet for longer-tenancy family renters. What's the average tenant stay here, and is there a school-zone premium baked into asking?
- What's the average days-on-market for RENTAL listings here right now (not sales)? A rising rental-DOM trend means longer vacancies and softer asking-rent achievability than the comps imply.
- What's the recent tenant-quality profile in this submarket — average credit score on applications, eviction rate, late-payment / NSF rate, and stable-employment percentage? A property-management company in the area should have these aggregated.
- How much new for-sale + rental construction is in the pipeline within 1–3 miles? Heavy new supply typically softens prices + rents 12–24 months out; constrained supply supports both.
Investment metrics
- 1% rule
- 0.97% ✗
- Cap rate
- 7.24%
- Cash-on-cash
- 3.37%
- DSCR
- 1.15
- GRM
- 8.6
CMA / ARV
- ARV (on-the-fly)
- $242,550
- Comps found
- 9
Show comp detail 9 sales within ~0.75 mi
| Address | Dist | Beds/Ba | Sqft | Sold | Price | $/sf | Match |
|---|---|---|---|---|---|---|---|
| 510 Marvin St | 0.06mi | 3/1.0 (+1) | 1,064 (+1%) | 9mo | $99,000 | $93 | 82 |
| 914 Delores Dr | 0.33mi | 2/1.0 | 922 (-12%) | 12mo | $218,000 | $236 | 55 |
| 207 Grace St | 0.46mi | 3/1.0 (+1) | 1,087 (+4%) | 19mo | $259,000 | $238 | 52 |
| 1117 S Magnolia Dr | 0.74mi | 2/2.0 | 1,042 (-1%) | 14mo | $260,000 | $250 | 48 |
| 809 E Call St | 0.51mi | 3/2.0 (+1) | 1,103 (+5%) | 13mo | $236,000 | $214 | 48 |
| 632 E Call St | 0.53mi | 3/1.0 (+1) | 1,112 (+6%) | 19mo | $257,000 | $231 | 45 |
| 406 Talaflo St | 0.67mi | 2/1.0 | 1,168 (+11%) | 15mo | $232,000 | $199 | 38 |
| 913 E Call St | 0.66mi | 3/1.0 (+1) | 988 (-6%) | 21mo | $209,000 | $212 | 37 |
| 848 E Park Ave | 0.51mi | 2/1.5 | 1,170 (+11%) | 22mo | $275,000 | $235 | 36 |
Match score weights: distance 35% · size 25% · config 20% · recency 20%. Top-matched comps best support the ARV.
Projected returns pro-forma
-3.0% appreciation · 4.16% rent growth · sell at horizon
- IRR
- -9.7%
- Equity multiple
- 0.64×
- Total profit
- $-15,057
- Equity at exit
- $22,365
- IRR
- 1.2%
- Equity multiple
- 1.09×
- Total profit
- $3,887
- Equity at exit
- $12,969
Cash invested: $42,000 (down + closing). Projections, not guarantees.
Landlord ↔ Tenant lean methodology
- Overall (STATE)
- 87 Strongly Landlord-Friendly
- State Florida
- 87 Strongly Landlord-Friendly · R+3
- County
- — inherits STATE
- City
- — inherits STATE
ZIP-level market 32301
- Rents YoY
- 4.2%
- Active inventory
- 121
- Price-to-rent
- 8.6×
Monthly cashflow live
- Estimated rent
- $1,461 high interval (Pro) →
- Mortgage (P&I)
- −$787
- Tax est. 1.5%
- −$188 /mo · $2,250/yr
- Insurance
- −$62
- HOA
- −$0
- Vacancy / Maint / Mgmt
- −$307
- Net cashflow
- $118
Break-even live
UW: 25.0% down · 7.5% · 30yr · 1.5% tax · 5.0% vac · 8.0% maint · 8.0% mgmt
Financing live
Cash to close
- Down payment
- $37,500
- Closing costs
- $4,500
- Reserves months
- —
- Total cash needed
- —
Loan-product check · same deal, 3 products live
Conventional
25% down · 7.5% · 30yr
- Down + closing
- —
- Monthly P&I
- —
- Monthly cashflow
- —
- DSCR
- —
- Eligible?
- —
Personal DTI + credit; lowest rate.
DSCR
20% down · 8.5% · 30yr
- Down + closing
- —
- Monthly P&I
- —
- Monthly cashflow
- —
- DSCR
- —
- Eligible?
- —
No personal income docs; deal must DSCR.
Hard money
10% down · 12.0% · 12mo
- Down + closing
- —
- Monthly P&I
- —
- Monthly cashflow
- —
- DSCR
- —
- Eligible?
- —
Short-term bridge; refi at stabilization.
Rent comps 37 comps
| Address | Beds | Baths | Sqft | Rent | $/sqft | DOM | Units | Dist |
|---|---|---|---|---|---|---|---|---|
| 705 E College Ave Tallahassee, FL | 1.0 | 1.0 | 770 | $1,000 | $1.30 | 13d | 1 | 0.30mi |
| 534 E College Ave Tallahassee, FL | 1.0 | 1.0 | 709 | $925 | $1.30 | 21d | 1 | 0.38mi |
| 850 S Gadsden St Tallahassee, FL | 2.0 | 1.0–2.0 | 828 | $3,549 | $4.29 | 13d | 34 | 0.39mi |
| 648 E Park Ave Unit 24 Tallahassee, FL | 1.0 | 1.0 | 850 | $1,095 | $1.29 | 21d | 1 | 0.42mi |
| 100 Cadiz St Tallahassee, FL | 1.0 | 1.0 | 700 | $1,112 | $1.59 | 21d | 1 | 0.43mi |
| 631 E Call St Tallahassee, FL | 2.0 | 1.0 | 598 | $1,399 | $2.34 | 21d | 16 | 0.47mi |
| 1211 E Lafayette St Tallahassee, FL | 1.0–2.0 | 1.0–2.0 | 833 | $1,115 | $1.34 | 21d | 4 | 0.50mi |
| 420 E Park Ave Unit 50 Tallahassee, FL | 2.0 | 1.0 | 770 | $1,050 | $1.36 | 13d | 1 | 0.52mi |
| 723 E Tennessee St Tallahassee, FL | 2.0 | 2.0 | 1000 | $1,750 | $1.75 | 21d | 1 | 0.58mi |
| 300 S Duval St #804 Tallahassee, FL | 1.0 | 1.0 | 703 | $2,000 | $2.84 | 13d | 1 | 0.70mi |
| 215 W College Ave #302 Tallahassee, FL | 1.0 | 1.0 | 726 | $1,800 | $2.48 | 21d | 1 | 0.73mi |
| 215 W College Ave Unit 706B Tallahassee, FL | 2.0 | 1.0 | 823 | $2,600 | $3.16 | 21d | 1 | 0.73mi |
| 1504 S Adams St #1 Tallahassee, FL | 2.0 | 2.0 | 1088 | $1,300 | $1.19 | 13d | 1 | 0.77mi |
| 415 N Gadsden St Tallahassee, FL | 1.0–2.0 | 1.0–1.5 | 990 | $1,575 | $1.59 | 21d | 6 | 0.77mi |
| 403 E Carolina St #118 Tallahassee, FL | 1.0 | 1.0 | 700 | $1,250 | $1.79 | 21d | 1 | 0.80mi |
| 440 N Monroe St Tallahassee, FL | 3.0 | 1.0–3.0 | 1311 | $3,121 | $2.38 | 13d | 15 | 0.88mi |
| 1533 S Bronough St Tallahassee, FL | 2.0 | 1.0 | 750 | $1,150 | $1.53 | 13d | 1 | 0.89mi |
| 717 Edgewood St Tallahassee, FL | 2.0 | 1.0 | 717 | $1,325 | $1.85 | 21d | 1 | 0.97mi |
| 510 All Saints St Unit 203 Tallahassee, FL | 1.0 | 1.0 | 720 | $1,600 | $2.22 | 13d | 1 | 0.97mi |
| 510 All Saints St Unit 101 Tallahassee, FL | 1.0 | 1.0 | 720 | $1,900 | $2.64 | 13d | 1 | 0.97mi |
| 1737 S M L King Jr Blvd Tallahassee, FL | 3.0 | 1.0 | 701 | $1,450 | $2.07 | 21d | 1 | 1.06mi |
| 2218 Magnolia Cir Tallahassee, FL | 1.0–2.0 | 1.0–2.0 | 700 | $1,200 | $1.71 | 21d | 7 | 1.16mi |
| 2205 Magnolia Cir Tallahassee, FL | 1.0–2.0 | 1.0–2.0 | 750 | $1,225 | $1.63 | 13d | 9 | 1.16mi |
| 2205 Magnolia Cir Tallahassee, FL | 1.0–2.0 | 1.0–2.0 | 750 | $1,225 | $1.63 | 21d | 1 | 1.16mi |
| 718 N Bronough St Tallahassee, FL | 2.0 | 1.0 | 798 | $1,100 | $1.38 | 21d | 1 | 1.17mi |
| 1101 Washington Ct #1 Tallahassee, FL | 2.0 | 1.0 | 950 | $1,050 | $1.11 | 13d | 1 | 1.18mi |
| 412 W Brevard St Unit 412 Tallahassee, FL | 3.0 | 2.0 | 900 | $800 | $0.89 | 21d | 1 | 1.19mi |
| 828 N Duval St Tallahassee, FL | 3.0 | 2.5 | 1498 | $2,600 | $1.74 | 21d | 1 | 1.21mi |
| 1315 Pinellas St Tallahassee, FL | 3.0 | 3.0 | 1197 | $1,450 | $1.21 | 21d | 1 | 1.31mi |
| 735 Putnam Dr #2 Tallahassee, FL | 3.0 | 2.5 | 1396 | $1,650 | $1.18 | 13d | 1 | 1.36mi |
| 808 Saint Augustine St Tallahassee, FL | 2.0 | 2.5 | 1500 | $2,095 | $1.40 | 21d | 1 | 1.42mi |
| 401 Putnam Dr Tallahassee, FL | 1.0–2.0 | 1.0–2.0 | 766 | $1,250 | $1.63 | 21d | 1 | 1.43mi |
| 1309 Thomasville Rd Tallahassee, FL | 1.0 | 1.0 | 800 | $2,350 | $2.94 | 13d | 2 | 1.44mi |
| 833 W Gaines St Tallahassee, FL | 2.0 | 2.0 | 1080 | $2,350 | $2.18 | 13d | 2 | 1.48mi |
| 1330 Cherry St Tallahassee, FL | 2.0 | 1.0 | 859 | $1,600 | $1.86 | 13d | 5 | 1.48mi |
| 1332 Cherry St Tallahassee, FL | 2.0 | 1.0 | 859 | $1,550 | $1.80 | 21d | 1 | 1.48mi |
| 424 E 7th Ave Unit 15 Tallahassee, FL | 2.0 | 1.0 | 859 | $1,550 | $1.80 | 13d | 1 | 1.49mi |
Listing history 16 events
-
2026-06-18days on market $150,000 Active 35 DOM
-
2026-06-17days on market $150,000 Active 34 DOM
-
2026-06-16days on market $150,000 Active 33 DOM
-
2026-06-15days on market $150,000 Active 32 DOM
-
2026-06-14days on market $150,000 Active 30 DOM
-
2026-06-10days on market $150,000 Active 27 DOM
-
2026-06-09days on market $150,000 Active 26 DOM
-
2026-06-08days on market $150,000 Active 25 DOM
-
2026-06-07days on market $150,000 Active 24 DOM
-
2026-06-05days on market $150,000 Active 21 DOM
-
2026-06-03days on market $150,000 Active 20 DOM
-
2026-06-02days on market $150,000 Active 19 DOM
-
2026-06-01days on market $150,000 Active 18 DOM
-
2026-05-31days on market $150,000 Active 17 DOM
-
2026-05-30days on market $150,000 Active 16 DOM
-
2026-05-14$150,000 Active
ⓘ Source: listings_history table (triggers on properties + properties_extension) + one-shot
backfill from property_details.listing_events for pre-trigger history.
Climate risk First Street
- Flood 1/10 Low FEMA zone X (unshaded) · 0% chance over 30 yrs
- Wildfire 3/10 Moderate
- Heat 8/10 Severe 7 d/yr ≥108°F today · 20 d/yr by 30 yrs out
- Wind 9/10 Extreme 99% chance of damaging wind over 30 yrs
- Air quality 4/10 Moderate 5 unhealthy d/yr today · 6 by 30 yrs out
Nearby sold comps map
Loading sold comps map…
Walkable amenities ~0.75 mi
Loading nearby amenities…
Taxation est. · year 1
- Rental income
- $17,535
- − Mortgage interest
- −$8,402
- − Property taxes
- −$2,250
- − Insurance
- −$750
- − Repairs & maintenance
- −$1,403
- − Management
- −$1,403
- − Depreciation
- −$4,364
- Taxable loss
- −$1,036
- Est. tax savings @ 24.0%
- +$249
- After-tax cash flow
- $1,662/yr
For passive investors: Depreciation is non-cash, so a rental often shows a tax loss while cash-flowing — sheltering income. Rental losses are passive: they offset passive income freely, and up to $25,000/yr can offset ordinary (W-2) income if you actively participate and your MAGI is under $100k (phasing out to $0 by $150k); unused losses carry forward. On sale, claimed depreciation is recaptured at up to 25%, and gains may owe capital-gains tax (a 1031 exchange can defer both). Figures are a year-1 estimate at your 24.0% rate — not tax advice; consult a CPA.
Condition & rehab AI · 12 photos
This home requires moderate repairs to its exterior and interior paint, but presents a good opportunity for a fresh coat of paint to boost its curb appeal and value.
Repairs flagged
- Moderate exterior siding — Weathered and needs repainting
- Minor interior paint — Faded and could be refreshed
Value-add opportunities
- Both paint exterior — Enhances curb appeal and resale value
- Both paint interior — Refreshes the home's appearance and enhances rental appeal
Renovation cost estimate screening
| Repair item | Severity | Est. cost |
|---|---|---|
| exterior siding · Weathered and needs repainting | Moderate | $3,000–15,000 |
| interior paint · Faded and could be refreshed | Minor | $500–3,000 |
| Total estimated repair cost · 2 items | $3,500–18,000 |
Value-add ROI direction
- Both paint exterior — Enhances curb appeal and resale value ↑
- Both paint interior — Refreshes the home's appearance and enhances rental appeal ↑
ⓘ Cost ranges are severity-bucket heuristics (US national rule-of-thumb). Get contractor quotes + a written scope before underwriting a rehab budget.
Schools (NCES district)
- District
- Leon
- NCES district ID
- 1201110
- Math proficiency
- 48% ▼ -13.00%
- Reading proficiency
- 53% ▼ -5.00%
- Median HH income
- $46,339
- Composite
- 42.84/100
- National rank
- #3131
- State rank
- #33 of 73 in FL
Livability — Tallahassee
- Score
- 86/100
- State rank
- #19
- US rank
- #429
Category grades
Schools grade is shown separately in the Schools card above.
Census & demographics
- Census place
- Tallahassee, FL
- County
- Leon County · 294,472 people
- City population
- 294,472
- Metro
- Tallahassee, FL
- Population (ZIP)
- 32,017
- Household income
- $50,942
- Rent vs Own
- Severe rent burden
- 2625.0
Population outlook (Leon County) Hauer SSP2
- Today (2025)
- 315,507 people
- By 2030
- 330,677 · +4.8%
- By 2040
- 358,465 · +13.6%
- By 2050
- 386,804 · +22.6%
- By 2075
- 465,480 · +47.5%
- By 2100
- 519,959 · +64.8%
Race, ethnicity, and origin ACS 2023
- Neighborhood character
- Diverse neighborhood (Simpson 0.61)
- Race & ethnicity
- Black 49% White 38% Hispanic / Latino 6% Two or more races 6% Asian 3%
- Hispanic origin (detail)
- Puerto Rican 1% Cuban 1%
- Common ancestry
- Slovak 2% Romanian 1% Lithuanian 1%
- Foreign-born
- 7% · Canada, China, Vietnam
- Languages at home
- 91% English-only · Spanish 4% Other Indo-European 1% French/Haitian/Cajun 1%
Political lean MEDSL · Leon
- 2024 margin
- Strong D (+21.8) · D 60.3% · R 38.5% · Other 1.2%
- 2008→2024 swing
- -2.5pp toward R · 2008: 24.3pp · 2024: 21.8pp
- All cycles
- 2024: D+21.8 2020: D+28.3 2016: D+25.1 2012: D+23.6 2008: D+24.3
Not yet ingested
- Civics
- —
Market trends
- HPI YoY
- ▼ -231.50%
- Current HPI
- 231.103
- Rent YoY
- ▲ 4.16%
- Metro
- Tallahassee, FL
- State GDP YoY
- ▲ 3.28%
- F500 in state
- 36
Industry mix (Fortune 500 HQ in FL)
| Industry | F500 HQs | Revenue |
|---|---|---|
| Industrial Technology | 2 | $29B |
|
||
| Insurance | 2 | $17B |
|
||
| Retail | 1 | $60B |
|
||
| Technology Distribution | 1 | $58B |
|
||
| Homebuilding | 1 | $35B |
|
||
| Technology Manufacturing | 1 | $35B |
|
||
Price history
1 event — show timeline
- 2026-05-14 Listed $150,000 CATRS
Cash-flow waterfall
monthlySold comps — $/sqft
last 12 mo · ≤1 miLoading sold comps…