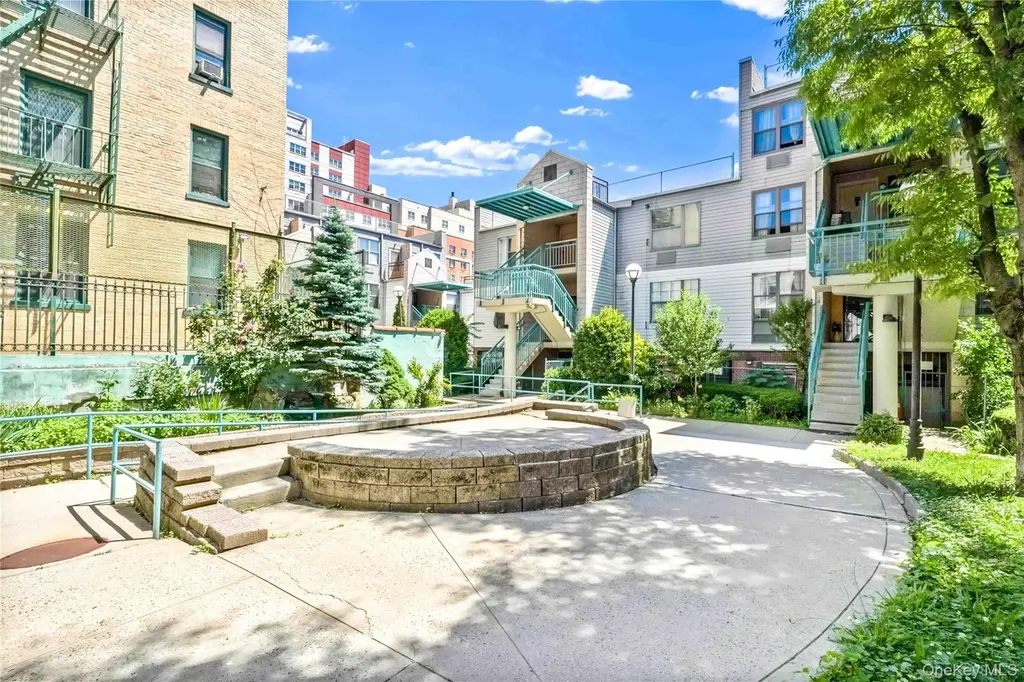
524 E 159th St Unit 2C · New York, NY
Flood risk 9/10 · Severe
- FEMA flood zone
- X (unshaded)
- Chance of flooding over 30 yrs
- 0.99%
- Est. flood insurance / yr
- $507 – $1,088
Fire risk 1/10 · Minimal
- Est. fire insurance / yr
- $691 – $1,283
Heat risk 6/10 · Moderate
- Hot days now (above 99°F)
- 7 days/yr
- Hot days in 30 yrs
- 15 days/yr
Wind risk 6/10 · Moderate
- Chance of severe wind over 30 yrs
- 27.0%
Air-quality risk 4/10 · Minor
- Unhealthy air days now
- 5 days/yr
- Unhealthy air days in 30 yrs
- 6 days/yr
Risk factors via First Street. Map © Google.
Why this score? — see what drove the C- grade
The composite is a weighted blend of 9 inputs, each scored 0–100. Each bar is that input's sub-score; the figure is the points it added to the 100-point composite (weight × sub-score).
- Cash flow +14.1/30.0
- ARV discount +7.5/15.0
- Appreciation +5.3/10.0
- Schools +5.0/10.0
- 1% rule +4.7/10.0
- DSCR +4.3/10.0
- Livability +3.8/5.0
- Rent growth +3.1/5.0
- Condition / age +2.5/5.0
$385,000
🖨 Deal sheet 📄 Offer letter ✓ Due diligence
Listing remarks
If you're searching for a 2-bedroom condominium with a guaranteed parking space and low HOA fees, this is one you won't want to miss. Beautifully updated this home features a renovated kitchen and bathroom, along with the convenience of an in-unit washer and dryer. Ideally located near the 2 and 5 trains at 3rd Avenue and 149th Street, the property offers easy access to both the East and West Sides of Manhattan, as well as nearby shopping, dining, and other local amenities.
Key facts
- Renovated bathroom
- Renovated kitchen
- Nearby dining
Tags
Property features AI
Finance
- HOA & community: Condominium association; Monthly association fee of $596 (includes trash)
Exterior
- Parking: Garage (1 space); Total parking for 1 vehicle
- Utilities: Con Edison electric service; Public sewer; Cable available; Electricity connected; Natural gas available
- Home design: Condominium; 2 stories
- Construction: Other construction; Other foundation
- Exterior features: Other construction materials; Other foundation details; Not waterfront
Interior
- Kitchen: Gas range
- Bedrooms: Entry level is 2; Pets allowed
- Flooring: Wood flooring
- Bathrooms: 1 full bathroom
- Heating & cooling: Natural gas heating; Other heating; Wall/window air conditioning unit(s)
- Interior features: Chef's kitchen; Eat-in kitchen; Other interior features
- Laundry & utility: In-unit laundry
Neighborhood map
What this means for you Summary
Snapshot
- This is a 2-bed/1.0-bath condo listed at $385k.
Deal economics
- At list price, monthly cash flow is $-9 ($-113/yr) — negative.
- To cash-flow at today's rent, offer at most $383k (0.4% below list).
- To meet the 1% rule (rent ≥ 1% of price), the offer needs to be $372k (3.4% below list).
- Recommended offer: $372k (3.4% below list) — sets the bar for 1% rule.
- Cap rate 6.5% vs local median 2.6% in New York — top-decile yield for the area; either an underpriced asset or a hidden risk that comps aren't pricing in. Stress-test before assuming the spread holds.
Location & tenants
- Location reads 75/100 on livability (#268 in NY, #4,188 nationally) — a middle-class / working-renter tenant base. Strengths: amenities A+, commute A+, health & safety A; Watch: crime F, cost of living F.
- Market conditions: Rents rising (+2.6%/yr); 69 active listings in the ZIP; 2 comparable units currently listed for rent nearby; lower-income renter base — watch delinquency; 6,929 units permitted in Bronx County in 2024 (6,829 in 5+ unit buildings).
- At $3,720/mo this rent would consume 115% of the median local household income ($39k/yr) (locally 6917% of renters already pay >50% of income on rent) — very limited rent-growth headroom before tenants either downsize or default.
Forward outlook
- In year one you build about $5k of equity ($3k loan paydown + $3k appreciation (0.7% local appreciation)).
- Bronx County population projected at +21% by 2050 — long-run rental-demand tailwind backs the buy-and-hold thesis.
- By year 6, paydown + projected appreciation supports a ~$31k cash-out refi (75% LTV) — recoverable capital for the next deal without selling this one.
Negotiation context
- Only 6 days on market — expect competitive offers; lowballing is unlikely to land.
- Current owner paid $98k; list at $385k implies a 293% gain — meaningful room to come down on a strong offer.
Risks & watch-outs
- Watch-outs: flood insurance adds $66/mo.
- Climate carrying-cost: severe flood risk; major wind risk, 27% chance of damaging wind over 30y; extreme-heat days projected 7→15/yr by 2055 (HVAC capex compounding) — expect insurance premiums to compound above CPI over the hold.
Questions for the listing agent
- What do current leases actually rent for vs. the listed asking? Can we see a recent rent roll and the last 12 months of T-12 income?
- What's the actual annual flood-insurance premium (NFIP or private), and is the property in a SFHA with mandatory coverage?
- What does the HOA fee cover, when was the last increase, and are there any pending special assessments or reserve-fund shortfalls?
- Any open or pending special assessments — roof, HVAC, plumbing, elevator, façade? What's the per-unit balance and payoff schedule, and is the seller paying it off at close or rolling it to the buyer?
- Is there a deadline driving the sale (1031 exchange, divorce, estate, relocation)? That informs how much negotiation room exists.
- Schools are B-rated — typically a magnet for longer-tenancy family renters. What's the average tenant stay here, and is there a school-zone premium baked into asking?
- Crime grade is F in this area — have there been break-ins, vandalism, or insurance claims at this property in the last 3 years? What carrier currently insures it and at what premium?
- What's the average days-on-market for RENTAL listings here right now (not sales)? A rising rental-DOM trend means longer vacancies and softer asking-rent achievability than the comps imply.
- What's the recent tenant-quality profile in this submarket — average credit score on applications, eviction rate, late-payment / NSF rate, and stable-employment percentage? A property-management company in the area should have these aggregated.
- How much new apartment / multifamily construction is in the pipeline within 1–3 miles? Heavy new supply (>2% of stock underway) typically softens rents 12–24 months out; light construction supports rent growth.
Investment metrics
- 1% rule
- 0.97% ✗
- Cap rate
- 6.47%
- Cash-on-cash
- 0.63%
- DSCR
- 1.03
- GRM
- 8.6
CMA / ARV
No comps found within radius.
Projected returns pro-forma
0.67% appreciation · 2.57% rent growth · sell at horizon
- IRR
- -0.2%
- Equity multiple
- 0.99×
- Total profit
- $-1,005
- Equity at exit
- $124,802
- IRR
- 4.6%
- Equity multiple
- 1.53×
- Total profit
- $57,507
- Equity at exit
- $160,840
Cash invested: $107,800 (down + closing). Projections, not guarantees.
Landlord ↔ Tenant lean methodology
- Overall (CITY)
- 0 Strongly Tenant-Friendly
- State New York
- 15 Strongly Tenant-Friendly · D+10
- County
- — inherits STATE
- City New York
- 0 Strongly Tenant-Friendly · D+34
ZIP-level market 10451
- Home prices YoY
- 0.7%
- Rents YoY
- 2.6%
- Active inventory
- 69
- Price-to-rent
- 8.6×
Monthly cashflow live
- Estimated rent
- $3,720 medium interval (Pro) →
- Mortgage (P&I)
- −$2,019
- Tax from tax record
- −$106 /mo · $1,277/yr
- Insurance
- −$160
- Flood insurance flood zone
- −$66 /mo · $798/yr
- HOA
- −$596
- Vacancy / Maint / Mgmt
- −$781
- Net cashflow
- $-9
Break-even live
UW: 25.0% down · 7.5% · 30yr · 1.5% tax · 5.0% vac · 8.0% maint · 8.0% mgmt
Financing live
Cash to close
- Down payment
- $96,250
- Closing costs
- $11,550
- Reserves months
- —
- Total cash needed
- —
Loan-product check · same deal, 3 products live
Conventional
25% down · 7.5% · 30yr
- Down + closing
- —
- Monthly P&I
- —
- Monthly cashflow
- —
- DSCR
- —
- Eligible?
- —
Personal DTI + credit; lowest rate.
DSCR
20% down · 8.5% · 30yr
- Down + closing
- —
- Monthly P&I
- —
- Monthly cashflow
- —
- DSCR
- —
- Eligible?
- —
No personal income docs; deal must DSCR.
Hard money
10% down · 12.0% · 12mo
- Down + closing
- —
- Monthly P&I
- —
- Monthly cashflow
- —
- DSCR
- —
- Eligible?
- —
Short-term bridge; refi at stabilization.
Rent comps 2 comps
| Address | Beds | Baths | Sqft | Rent | $/sqft | DOM | Units | Dist |
|---|---|---|---|---|---|---|---|---|
| 2413 3rd Ave Bronx, NY | 1.0–3.0 | 1.0–2.0 | 857 | $3,948 | $4.60 | 11d | 23 | 1.37mi |
| 5 Lincoln Ave Bronx, NY | 1.0–3.0 | 1.0–2.5 | 1011 | $5,134 | $5.08 | 1d | 183 | 1.39mi |
HOA detail condo
- Monthly dues
- $596 · $7,152/yr
- Assessments
- None detected in remarks — confirm with the listing agent.
Listing history 6 events
-
2026-06-18days on market $385,000 Active 6 DOM
-
2026-06-17days on market $385,000 Active 5 DOM
-
2026-06-16days on market $385,000 Active 4 DOM
-
2026-06-15days on market $385,000 Active 3 DOM
-
2026-06-13remarks 479-char remark
-
2026-06-13$385,000 Active 1 DOM
ⓘ Source: listings_history table (triggers on properties + properties_extension) + one-shot
backfill from property_details.listing_events for pre-trigger history.
Tax reassessment forecast NY · Partial reset (capped growth)
- Current annual tax
- $1,277 · $106/mo
- Projected year-2 tax
- $3,892 · $324/mo
- Expected delta
- +$2,615/yr (+$218/mo · 204.8%)
ⓘ Screening estimate from a state-policy table — verify with the county assessor before closing.
Climate risk First Street
- Flood 9/10 Extreme FEMA zone X (unshaded) · 99% chance over 30 yrs
- Wildfire 1/10 Low
- Heat 6/10 Major 7 d/yr ≥99°F today · 15 d/yr by 30 yrs out
- Wind 6/10 Major 27% chance of damaging wind over 30 yrs
- Air quality 4/10 Moderate 5 unhealthy d/yr today · 6 by 30 yrs out
Nearby sold comps map
Loading sold comps map…
Walkable amenities ~0.75 mi
Loading nearby amenities…
Taxation est. · year 1
- Rental income
- $44,640
- − Mortgage interest
- −$21,566
- − Property taxes
- −$1,277
- − Insurance
- −$2,722
- − Repairs & maintenance
- −$3,571
- − Management
- −$3,571
- − HOA
- −$7,152
- − Depreciation
- −$11,200
- Taxable loss
- −$6,420
- Est. tax savings @ 24.0%
- +$1,541
- After-tax cash flow
- $1,427/yr
For passive investors: Depreciation is non-cash, so a rental often shows a tax loss while cash-flowing — sheltering income. Rental losses are passive: they offset passive income freely, and up to $25,000/yr can offset ordinary (W-2) income if you actively participate and your MAGI is under $100k (phasing out to $0 by $150k); unused losses carry forward. On sale, claimed depreciation is recaptured at up to 25%, and gains may owe capital-gains tax (a 1031 exchange can defer both). Figures are a year-1 estimate at your 24.0% rate — not tax advice; consult a CPA.
Schools (NCES district)
No district data.
Livability — New York
- Score
- 75/100
- State rank
- #268
- US rank
- #4188
Category grades
Schools grade is shown separately in the Schools card above.
Census & demographics
- Census place
- New York, NY
- County
- Bronx County · 1,197,324 people
- City population
- 7,731,280
- Metro
- New York-Newark-Jersey City, NY-NJ-PA
- Population (ZIP)
- 50,942
- Household income
- $38,770
- Rent vs Own
- Severe rent burden
- 6917.0
Population outlook (Bronx County) Hauer SSP2
- Today (2025)
- 1,607,353 people
- By 2030
- 1,681,852 · +4.6%
- By 2040
- 1,824,421 · +13.5%
- By 2050
- 1,945,470 · +21.0%
- By 2075
- 2,187,887 · +36.1%
- By 2100
- 2,244,136 · +39.6%
Race, ethnicity, and origin ACS 2023
- Neighborhood character
- Diverse neighborhood (Simpson 0.58)
- Race & ethnicity
- Hispanic / Latino 51% Black 40% Two or more races 12% White 6% Asian 1%
- Hispanic origin (detail)
- Mexican 3% Puerto Rican 14% Dominican 24%
- Common ancestry
- Scotch-Irish 1%
- Foreign-born
- 29% · Canada, United Kingdom, China
- Languages at home
- 46% English-only · Spanish 42% French/Haitian/Cajun 3% Arabic 1%
Political lean MEDSL · Bronx
- 2024 margin
- Solid D (+45.4) · D 72.7% · R 27.3%
- 2008→2024 swing
- -32.3pp toward R · 2008: 77.8pp · 2024: 45.4pp
- All cycles
- 2024: D+45.4 2020: D+67.6 2016: D+79.1 2012: D+82.9 2008: D+77.8
Not yet ingested
- Civics
- —
Market trends
- HPI YoY
- ▲ 0.67%
- Current HPI
- 102.1498
- Rent YoY
- ▲ 2.57%
- Metro
- New York-Newark-Jersey City, NY-NJ-PA
- State GDP YoY
- ▲ 2.60%
- F500 in state
- 92
Industry mix (Fortune 500 HQ in NY)
| Industry | F500 HQs | Revenue |
|---|---|---|
| Financial Services | 10 | $950B |
|
||
| Consumer Goods | 9 | $162B |
|
||
| Insurance | 4 | $225B |
|
||
| Telecommunications | 2 | $144B |
|
||
| Pharmaceuticals | 2 | $112B |
|
||
| Media / Entertainment | 2 | $69B |
|
||
Price history
+292.9% since first listed3 events — show timeline
- 2026-06-12 Listed $385,000 OneKey® MLS as Distributed by MLS Grid
- 1994-03-29 Sold (Public Records) $98,000 Public Records
- 1994-03-29 Sold (Public Records) $98,000 Public Records
Property tax history
+20.7%/yrLatest (2025): $1,277 · +0.0% YoY. Source: county tax records.
Cash-flow waterfall
monthlySold comps — $/sqft
last 12 mo · ≤1 miLoading sold comps…