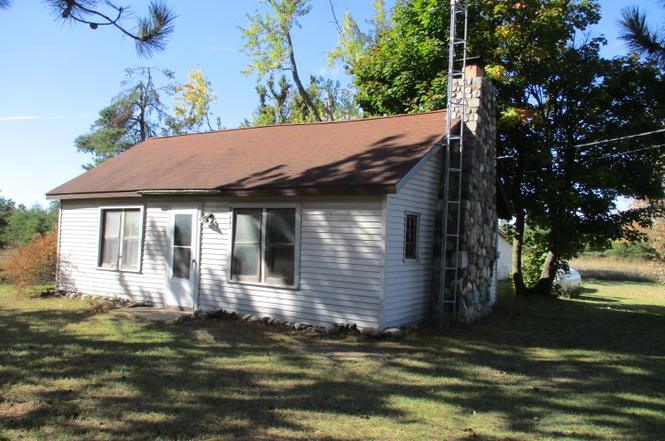
1940 Townline Rd · Albert, MI
Flood risk 1/10 · Minimal
- FEMA flood zone
- —
- Chance of flooding over 30 yrs
- 0.0%
- Est. flood insurance / yr
- —
Fire risk 5/10 · Moderate
- Est. fire insurance / yr
- $784 – $1,456
Heat risk 1/10 · Minimal
- Hot days now (above 93°F)
- 7 days/yr
- Hot days in 30 yrs
- 13 days/yr
Wind risk 1/10 · Minimal
- Chance of severe wind over 30 yrs
- —
Air-quality risk 1/10 · Minimal
- Unhealthy air days now
- 0 days/yr
- Unhealthy air days in 30 yrs
- 0 days/yr
Risk factors via First Street. Map © Google.
Why this score? — see what drove the D grade
The composite is a weighted blend of 9 inputs, each scored 0–100. Each bar is that input's sub-score; the figure is the points it added to the 100-point composite (weight × sub-score).
- Cash flow +19.4/30.0
- DSCR +6.1/10.0
- 1% rule +3.9/10.0
- Schools +3.1/10.0
- Rent growth +2.5/5.0
- Livability +2.5/5.0
- Condition / age +2.5/5.0
- ARV discount +1.0/15.0
- Appreciation +0.0/10.0
$119,000
🖨 Deal sheet (PDF) 📄 Offer letter ✓ Due diligence
Listing remarks
Take a look at this charming home that dates back to the early 1900s. This property, which requires some renovation, is located on a generous 10 acres right near state land, making it perfect for anyone who loves outdoor activities. Inside, you will find beautiful original hardwood floors and a cozy field stone fireplace, creating a warm and inviting atmosphere. The home includes 2 bedrooms and 1 bathroom. For heating, there is a wood stove along with a propane wall furnace. The outside of the home features durable vinyl siding. In addition, there is an 18 by 20 metal garage available for your storage needs. The current owner will also transfer mineral rights to the new buyer, adding extra
Key facts
- Mineral rights
- Wood stove
- Propane wall furnace
Tags
Property features AI
Finance
- Other: Located at corner of Big Wolf Lake Rd. & Townline Rd. (directions provided)
Exterior
- Parking: Attached or detached garage with 1.5 car capacity
- Utilities: Well water; Septic tank
- Home design: Single-family residential property; Residential acreage (10 acres); Hunting currently permitted/used
- Construction: Slab foundation
- Exterior features: Paved road access; Natural vegetation
Interior
- Kitchen: Refrigerator; Oven; Range
- Flooring: Hardwood floors
- Bathrooms: 1 full bathroom
- Heating & cooling: Propane heating; Wall furnace; Wood stove heating
- Interior features: Wood burning stove fireplace; Refrigerator, Oven, Range
- Laundry & utility: No laundry hookups inside (none listed)
Neighborhood map
What this means for you Summary
Snapshot
- This is a 2-bed/1.0-bath single-family listed at $119k.
Deal economics
- At list price, monthly cash flow is $134 ($2k/yr) — positive.
- The deal already cash-flows at list — no discount required.
- To meet the 1% rule (rent ≥ 1% of price), the offer needs to be $106k (11.1% below list).
- Recommended offer: $105k (12.0% below list) — sets the bar for market timing.
Location & tenants
- Location reads: area grade D — affects rentability + tenant quality, not the cash-flow math above.
- Johannesburg-Lewiston Area Schools (rural): math 33% / reading 42% proficiency, ranked #257 of 540 in MI (top 48%) — families likely to look elsewhere, expect single-tenant / working-renter base with shorter leases.
- Zoned schools: Lewiston Elementary School (math 15% / reading 24%, grade F, #1,091 of 1,397 statewide, top 79%, 153 students, 76% FRL); Johannesburglewiston High School (math 34% / reading 54%, grade F, #214 of 713 statewide, top 36%, 218 students, 59% FRL) — zoned schools average 68% FRL vs 46% district-wide (21 pts higher); higher-poverty schools than district average — tighter screening recommended.
- Market conditions: 101 active listings in the ZIP.
Forward outlook
- Local home prices are declining (-3.0%/yr); year-one equity from $823 of loan paydown is wiped out by about $4k of value loss. Plan a longer hold.
- Montmorency County population projected at -38% by 2050 — secular population decline; favor cash flow + early exit over multi-decade hold.
Negotiation context
- It's been on market 248 days — a 12% lower offer ($105k) is reasonable based on typical stale-listing flexibility.
Risks & watch-outs
- Watch-outs: built in 1950 — expect roof / HVAC / electrical / plumbing capex.
- Climate carrying-cost: moderate wildfire risk — expect insurance premiums to compound above CPI over the hold.
Questions for the listing agent
- It's been on market 248 days. Have you received any prior offers? Is the seller open to a 12% concession, seller financing, or rate buy-down credit?
- Built in 1950 — when were the roof, HVAC, electrical panel, plumbing, and water heater last replaced?
- Why hasn't it sold? Are there any deal-killer items the seller is aware of (foundation, flood, title, zoning, code violations)?
- Is there a deadline driving the sale (1031 exchange, divorce, estate, relocation)? That informs how much negotiation room exists.
- The area grade is low — what's the realistic commute time and amenity access for the typical tenant pool here? Any planned neighborhood developments (good or bad) we should know about?
- What's the average days-on-market for RENTAL listings here right now (not sales)? A rising rental-DOM trend means longer vacancies and softer asking-rent achievability than the comps imply.
- What's the recent tenant-quality profile in this submarket — average credit score on applications, eviction rate, late-payment / NSF rate, and stable-employment percentage? A property-management company in the area should have these aggregated.
- How much new for-sale + rental construction is in the pipeline within 1–3 miles? Heavy new supply typically softens prices + rents 12–24 months out; constrained supply supports both.
Investment metrics
- 1% rule
- 0.89% ✗
- Cap rate
- 7.64%
- Cash-on-cash
- 4.82%
- DSCR
- 1.21
- GRM
- 9.4
CMA / ARV
- ARV (on-the-fly)
- $104,004
- Comps found
- 1
Show comp detail 1 sale within ~0.75 mi
| Address | Dist | Beds/Ba | Sqft | Sold | Price | $/sf | Match |
|---|---|---|---|---|---|---|---|
| 1459 Townline Rd | 0.54mi | 3/1.0 (+1) | 1,296 (+1%) | 22mo | $105,000 | $81 | 50 |
Match score weights: distance 35% · size 25% · config 20% · recency 20%. Top-matched comps best support the ARV.
Projected returns pro-forma
-3.0% appreciation · 3.0% rent growth · sell at horizon
- IRR
- -8.8%
- Equity multiple
- 0.68×
- Total profit
- $-10,811
- Equity at exit
- $17,743
- IRR
- 0.6%
- Equity multiple
- 1.04×
- Total profit
- $1,333
- Equity at exit
- $10,289
Cash invested: $33,320 (down + closing). Projections, not guarantees.
Landlord ↔ Tenant lean methodology
- Overall (STATE)
- 62 Landlord-Friendly
- State Michigan
- 62 Landlord-Friendly · EVEN
- County
- — inherits STATE
- City
- — inherits STATE
ZIP-level market 49756
- Active inventory
- 101
- Price-to-rent
- 9.4×
Monthly cashflow live
- Estimated rent
- $1,057 medium interval (Pro) →
- Mortgage (P&I)
- −$624
- Tax from tax record
- −$28 /mo · $333/yr
- Insurance
- −$50
- HOA
- −$0
- Vacancy / Maint / Mgmt
- −$222
- Net cashflow
- $134
Break-even live
Sensitivity live
| Price | -10% $201 | -5% $168 | +0% $134 | +5% $100 | +10% $67 |
|---|---|---|---|---|---|
| Rent | -10% $50 | -5% $92 | +0% $134 | +5% $176 | +10% $217 |
| Rate | -1.0pp $194 | -0.5pp $164 | base $134 | +0.5pp $103 | +1.0pp $72 |
UW: 25.0% down · 7.5% · 30yr · 1.5% tax · 5.0% vac · 8.0% maint · 8.0% mgmt
Financing live
Cash to close
- Down payment
- $29,750
- Closing costs
- $3,570
- Reserves months
- —
- Total cash needed
- —
Loan-product check · same deal, 3 products live
Conventional
25% down · 7.5% · 30yr
- Down + closing
- —
- Monthly P&I
- —
- Monthly cashflow
- —
- DSCR
- —
- Eligible?
- —
Personal DTI + credit; lowest rate.
DSCR
20% down · 8.5% · 30yr
- Down + closing
- —
- Monthly P&I
- —
- Monthly cashflow
- —
- DSCR
- —
- Eligible?
- —
No personal income docs; deal must DSCR.
Hard money
10% down · 12.0% · 12mo
- Down + closing
- —
- Monthly P&I
- —
- Monthly cashflow
- —
- DSCR
- —
- Eligible?
- —
Short-term bridge; refi at stabilization.
Listing history 17 events
-
2026-06-21days on market $119,000 Active 248 DOM
-
2026-06-18days on market $119,000 Active 246 DOM
-
2026-06-17days on market $119,000 Active 245 DOM
-
2026-06-16days on market $119,000 Active 244 DOM
-
2026-06-15days on market $119,000 Active 243 DOM
-
2026-06-13days on market $119,000 Active 241 DOM
-
2026-06-12days on market $119,000 Active 240 DOM
-
2026-06-09days on market $119,000 Active 237 DOM
-
2026-06-08days on market $119,000 Active 236 DOM
-
2026-06-07days on market $119,000 Active 235 DOM
-
2026-06-07days on market $119,000 Active 234 DOM
-
2026-06-04days on market $119,000 Active 231 DOM
-
2026-06-02days on market $119,000 Active 230 DOM
-
2026-06-01days on market $119,000 Active 229 DOM
-
2026-05-31days on market $119,000 Active 228 DOM
-
2026-05-31days on market $119,000 Active 227 DOM
-
2025-10-14$119,000 Active
ⓘ Source: listings_history table (triggers on properties + properties_extension) + one-shot
backfill from property_details.listing_events for pre-trigger history.
Tax reassessment forecast MI · Partial reset (capped growth)
- Current annual tax
- $333 · $28/mo
- Projected year-2 tax
- $1,083 · $90/mo
- Expected delta
- +$750/yr (+$62/mo · 225.3%)
ⓘ Screening estimate from a state-policy table — verify with the county assessor before closing.
Climate risk First Street
- Flood 1/10 Low 0% chance over 30 yrs
- Wildfire 5/10 Major
- Heat 1/10 Low 7 d/yr ≥93°F today · 13 d/yr by 30 yrs out
- Wind 1/10 Low
- Air quality 1/10 Low 0 unhealthy d/yr today · 0 by 30 yrs out
Nearby sold comps map
Loading sold comps map…
Walkable amenities ~0.75 mi
Loading nearby amenities…
Taxation est. · year 1
- Rental income
- $12,688
- − Mortgage interest
- −$6,666
- − Property taxes
- −$333
- − Insurance
- −$595
- − Repairs & maintenance
- −$1,015
- − Management
- −$1,015
- − Depreciation
- −$3,462
- Taxable loss
- −$397
- Est. tax savings @ 24.0%
- +$95
- After-tax cash flow
- $1,703/yr
For passive investors: Depreciation is non-cash, so a rental often shows a tax loss while cash-flowing — sheltering income. Rental losses are passive: they offset passive income freely, and up to $25,000/yr can offset ordinary (W-2) income if you actively participate and your MAGI is under $100k (phasing out to $0 by $150k); unused losses carry forward. On sale, claimed depreciation is recaptured at up to 25%, and gains may owe capital-gains tax (a 1031 exchange can defer both). Figures are a year-1 estimate at your 24.0% rate — not tax advice; consult a CPA.
Schools (NCES district)
- District
- Johannesburg-Lewiston Area Schools
- NCES district ID
- 2619890
- Math proficiency
- 33% ▼ -6.00%
- Reading proficiency
- 42% ▼ -10.00%
- Median HH income
- $39,218
- Composite
- 31.36/100
- National rank
- #5995
- State rank
- #257 of 540 in MI
Livability — Albert
No livability data for this city. (Only ~50 U.S. cities are tracked.)
Census & demographics
- Population (ZIP)
- 3,965
Population outlook (Montmorency County) Hauer SSP2
- Today (2025)
- 8,233 people
- By 2030
- 7,575 · -8.0%
- By 2040
- 6,202 · -24.7%
- By 2050
- 5,081 · -38.3%
- By 2075
- 3,119 · -62.1%
- By 2100
- 1,923 · -76.6%
Race, ethnicity, and origin ACS 2023
- Neighborhood character
- Predominantly White (93%)
- Race & ethnicity
- White 93% Two or more races 6%
- Common ancestry
- Romanian 14% Lithuanian 8% Iranian 2%
- Foreign-born
- 1% · Canada, China
- Languages at home
- 98% English-only · Spanish 1% French/Haitian/Cajun 1%
Political lean MEDSL · Montmorency
- 2024 margin
- Solid R (+45.3) · D 26.6% · R 72.0% · Other 1.4%
- 2008→2024 swing
- -37.2pp toward R · 2008: -8.2pp · 2024: -45.3pp
- All cycles
- 2024: R+45.3 2020: R+43.4 2016: R+44.2 2012: R+17.4 2008: R+8.2
Not yet ingested
- Civics
- —
Market trends
- HPI YoY
- ▼ -111.19%
- Current HPI
- 134.8693
- Rent YoY
- —
- Metro
- —
- State GDP YoY
- ▲ 1.37%
- F500 in state
- 28
Industry mix (Fortune 500 HQ in MI)
| Industry | F500 HQs | Revenue |
|---|---|---|
| Automotive Parts | 3 | $48B |
|
||
| Automotive | 2 | $372B |
|
||
| Chemicals | 1 | $45B |
|
||
| Automotive Retail | 1 | $29B |
|
||
| Healthcare / Medical Devices | 1 | $23B |
|
||
| Automotive Technology | 1 | $20B |
|
||
Price history
1 event — show timeline
- 2025-10-14 Listed $119,000 WWMLS
Property tax history
+3.4%/yrLatest (2024): $333 · -46.0% YoY. Source: county tax records.
Cash-flow waterfall
monthlySold comps — $/sqft
last 12 mo · ≤1 miLoading sold comps…