 🌊 Lakefront
3125 Birkdale Dr · Elfers, FL
Flood risk 5/10 · Moderate
- FEMA flood zone
- X (shaded)
- Chance of flooding over 30 yrs
- 0.26%
- Est. flood insurance / yr
- $507 – $1,088
Fire risk 3/10 · Minor
- Est. fire insurance / yr
- $947 – $1,759
Heat risk 10/10 · Severe
- Hot days now (above 109°F)
- 6 days/yr
- Hot days in 30 yrs
- 21 days/yr
Wind risk 10/10 · Severe
- Chance of severe wind over 30 yrs
- 99.0%
Air-quality risk 2/10 · Minimal
- Unhealthy air days now
- 1 days/yr
- Unhealthy air days in 30 yrs
- 1 days/yr
Risk factors via First Street. Map © Google.
Why this score? — see what drove the D+ grade
The composite is a weighted blend of 9 inputs, each scored 0–100. Each bar is that input's sub-score; the figure is the points it added to the 100-point composite (weight × sub-score).
- ARV discount +15.0/15.0
- Cash flow +11.6/30.0
- 1% rule +4.3/10.0
- Schools +4.3/10.0
- Livability +3.9/5.0
- DSCR +3.4/10.0
- Condition / age +2.5/5.0
- Rent growth +1.9/5.0
- Appreciation +0.0/10.0
$135,000
🖨 Deal sheet (PDF) 📄 Offer letter ✓ Due diligence
Listing remarks
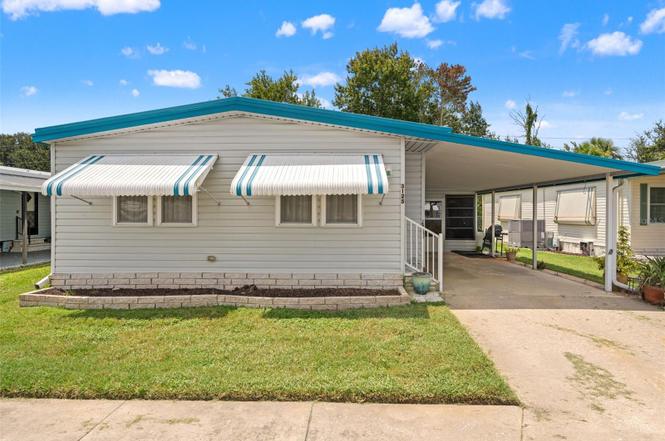
Stunning lakefront views at an attractive price! Welcome to 3125 Birkdale Drive, a perfectly cozy home for living the retirement or snow bird lifestyle! This home features 2 bedrooms and 2 bathrooms, with plenty of living space! As you pull up you'll be greeted by a large carport, with plenty of room to park your cars! Not only that, walk through your screened in lanai that can be used as a mud room, into a large storage shed with plenty of shelving! Let's step inside, your living room is nice and open with vaulted ceilings and enough natural light and windows that you'll never want to keep your lights on during the day! Towards the kitchen you'll notice a comfortable dining room area right
Key facts
- Community amenities
- Vaulted ceilings
- Lakefront views
Tags
Neighborhood map
What this means for you Summary
Snapshot
- This is a 2-bed/2.0-bath manufactured listed at $135k.
Deal economics
- At list price, monthly cash flow is $-43 ($-516/yr) — negative.
- To cash-flow at today's rent, offer at most $127k (5.6% below list).
- To meet the 1% rule (rent ≥ 1% of price), the offer needs to be $126k (6.9% below list).
- Recommended offer: $119k (12.0% below list) — sets the bar for market timing.
- Cap rate 5.9% vs local median 4.6% in Elfers — meaningfully above typical; check what's discounted (condition, days-on-market, listing class) to confirm the premium yield is real.
Location & tenants
- Location reads 78/100 on livability (#167 in FL, #2,486 nationally) — a middle-class / working-renter tenant base. Strengths: cost of living A+, housing A+, health & safety A+; Watch: crime C-, employment D+, amenities D-.
- Pasco (suburban): math 50% / reading 52% proficiency, ranked #32 of 73 in FL (top 44%) — acceptable for families but not a draw, mixed tenant base, ~2y average lease.
- Zoned schools: Anclote Elementary School (math 37% / reading 37%, grade F, #1,609 of 2,144 statewide, top 77%, 420 students, 81% FRL); Paul R. Smith Middle School (math 32% / reading 38%, grade F, #416 of 571 statewide, top 74%, 994 students, 82% FRL); Anclote High School (math 28% / reading 38%, grade F, #406 of 667 statewide, top 61%, 1,205 students, 77% FRL) — zoned schools average 80% FRL vs 48% district-wide (32 pts higher); higher-poverty schools than district average — tighter screening recommended.
- Zoned-school proficiency averages 35% at this address vs 51% district-wide (-16 pts) — the specific schools serving this property underperform the Pasco average; the district grade overstates school quality for this exact location.
- Market conditions: Rents soft (-2.5%/yr); 134 active listings in the ZIP; 40 comparable units currently listed for rent nearby; rentals at typical pace (median 17d on market — plan ~3-4 weeks tenant-placement turnaround); 6,765 units permitted in Pasco County in 2024 (1,250 in 5+ unit buildings).
- This rent runs 31% of the median local income ($49k/yr) — at the standard rent-burdened threshold; future hikes will face affordability resistance.
Forward outlook
- Local home prices are declining (-3.0%/yr); year-one equity from $933 of loan paydown is wiped out by about $4k of value loss. Plan a longer hold.
- Pasco County population projected at +29% by 2050 — long-run rental-demand tailwind backs the buy-and-hold thesis.
Negotiation context
- It's been on market 164 days — a 12% lower offer ($119k) is reasonable based on typical stale-listing flexibility.
- 3 sale attempts; this cycle's ask has dropped $14k (10%) from the opening price — seller is motivated, your offer sets the floor, not the list.
- Current owner paid $61k; list at $135k implies a 122% gain — meaningful room to come down on a strong offer.
Risks & watch-outs
- Climate carrying-cost: moderate flood risk; severe wind risk, 99% chance of damaging wind over 30y; extreme-heat days projected 6→21/yr by 2055 (HVAC capex compounding) — expect insurance premiums to compound above CPI over the hold.
Questions for the listing agent
- What do current leases actually rent for vs. the listed asking? Can we see a recent rent roll and the last 12 months of T-12 income?
- It's been on market 164 days. Have you received any prior offers? Is the seller open to a 12% concession, seller financing, or rate buy-down credit?
- What does the HOA fee cover, when was the last increase, and are there any pending special assessments or reserve-fund shortfalls?
- Why hasn't it sold? Are there any deal-killer items the seller is aware of (foundation, flood, title, zoning, code violations)?
- Is there a deadline driving the sale (1031 exchange, divorce, estate, relocation)? That informs how much negotiation room exists.
- The area grade is low — what's the realistic commute time and amenity access for the typical tenant pool here? Any planned neighborhood developments (good or bad) we should know about?
- This sits on a lake — are riparian / water-frontage rights deeded with the parcel? Any dock permits, shoreline easements, or HOA water-use restrictions?
- What's the documented flood / surge / shoreline-erosion history here (FEMA AND non-FEMA — e.g., storm surge, creek backup, septic-field saturation)?
- Any water-quality or seasonal algae-bloom issues that affect tenant satisfaction or short-term-rental demand?
- What's the average days-on-market for RENTAL listings here right now (not sales)? A rising rental-DOM trend means longer vacancies and softer asking-rent achievability than the comps imply.
- What's the recent tenant-quality profile in this submarket — average credit score on applications, eviction rate, late-payment / NSF rate, and stable-employment percentage? A property-management company in the area should have these aggregated.
- How much new for-sale + rental construction is in the pipeline within 1–3 miles? Heavy new supply typically softens prices + rents 12–24 months out; constrained supply supports both.
Investment metrics
- 1% rule
- 0.93% ✗
- Cap rate
- 5.91%
- Cash-on-cash
- -1.37%
- DSCR
- 0.94
- GRM
- 8.9
CMA / ARV
- ARV (on-the-fly)
- $206,561
- Comps found
- 10
Show comp detail 10 sales within ~0.75 mi
| Address | Dist | Beds/Ba | Sqft | Sold | Price | $/sf | Match |
|---|---|---|---|---|---|---|---|
| 4720 Burney Dr | 0.11mi | 3/2.0 (+1) | 1,065 (+2%) | 1mo | $135,000 | $127 | 87 |
| 3115 Bixler Ct | 0.14mi | 2/2.0 | 960 (-8%) | 2mo | $87,000 | $91 | 77 |
| 3217 Brewster Dr | 0.16mi | 2/2.0 | 1,152 (+10%) | 2mo | $96,500 | $84 | 75 |
| 3126 Birkdale Dr | 0.02mi | 2/2.0 | 936 (-11%) | 10mo | $152,400 | $163 | 73 |
| 3301 Chatford Dr | 0.24mi | 2/2.0 | 960 (-8%) | 2mo | $145,000 | $151 | 73 |
| 3035 Buckner Ct | 0.22mi | 2/2.0 | 1,056 (+1%) | 18mo | $193,000 | $183 | 73 |
| 3414 Chatford Dr | 0.35mi | 2/2.0 | 1,056 (+1%) | 12mo | $85,000 | $80 | 72 |
| 3131 Bixler Ct | 0.14mi | 2/2.0 | 1,180 (+13%) | 3mo | $143,000 | $121 | 70 |
| 3200 Birkdale Dr | 0.06mi | 2/2.0 | 960 (-8%) | 17mo | $140,000 | $146 | 69 |
| 4735 Burney Dr | 0.14mi | 2/2.0 | 896 (-14%) | 13mo | $135,000 | $151 | 59 |
Match score weights: distance 35% · size 25% · config 20% · recency 20%. Top-matched comps best support the ARV.
Projected returns pro-forma
-3.0% appreciation · 0.0% rent growth · sell at horizon
- IRR
- -22.3%
- Equity multiple
- 0.25×
- Total profit
- $-28,218
- Equity at exit
- $20,129
- IRR
- -28.0%
- Equity multiple
- -0.11×
- Total profit
- $-42,005
- Equity at exit
- $11,672
Cash invested: $37,800 (down + closing). Projections, not guarantees.
Landlord ↔ Tenant lean methodology
- Overall (STATE)
- 87 Strongly Landlord-Friendly
- State Florida
- 87 Strongly Landlord-Friendly · R+3
- County
- — inherits STATE
- City
- — inherits STATE
ZIP-level market 34690
- Home prices YoY
- -22.4%
- Rents YoY
- -2.5%
- Active inventory
- 134
- Price-to-rent
- 8.9×
Monthly cashflow live
- Estimated rent
- $1,257 high interval (Pro) →
- Mortgage (P&I)
- −$708
- Tax from tax record
- −$129 /mo · $1,549/yr
- Insurance
- −$56
- HOA
- −$143
- Lot rent leased land?
- −$0
- Vacancy / Maint / Mgmt
- −$264
- Net cashflow
- $-43
Break-even live
Sensitivity live
| Price | -10% $33 | -5% $-5 | +0% $-43 | +5% $-81 | +10% $-119 |
|---|---|---|---|---|---|
| Rent | -10% $-142 | -5% $-93 | +0% $-43 | +5% $7 | +10% $56 |
| Rate | -1.0pp $25 | -0.5pp $-9 | base $-43 | +0.5pp $-78 | +1.0pp $-114 |
UW: 25.0% down · 7.5% · 30yr · 1.5% tax · 5.0% vac · 8.0% maint · 8.0% mgmt
Financing live
Cash to close
- Down payment
- $33,750
- Closing costs
- $4,050
- Reserves months
- —
- Total cash needed
- —
Loan-product check · same deal, 3 products live
Conventional
25% down · 7.5% · 30yr
- Down + closing
- —
- Monthly P&I
- —
- Monthly cashflow
- —
- DSCR
- —
- Eligible?
- —
Personal DTI + credit; lowest rate.
DSCR
20% down · 8.5% · 30yr
- Down + closing
- —
- Monthly P&I
- —
- Monthly cashflow
- —
- DSCR
- —
- Eligible?
- —
No personal income docs; deal must DSCR.
Hard money
10% down · 12.0% · 12mo
- Down + closing
- —
- Monthly P&I
- —
- Monthly cashflow
- —
- DSCR
- —
- Eligible?
- —
Short-term bridge; refi at stabilization.
Rent comps 40 comps
| Address | Beds | Baths | Sqft | Rent | $/sqft | DOM | Units | Dist |
|---|---|---|---|---|---|---|---|---|
| 3433 Monticello St Holiday, FL | 3.0 | 1.5 | 960 | $1,650 | $1.72 | 26d | 1 | 0.31mi |
| 3421 Tricon Ln #12 Holiday, FL | 2.0 | 1.0 | 870 | $1,095 | $1.26 | 1d | 1 | 0.36mi |
| 3511 Cambridge St New Port Richey, FL | 2.0 | 2.0 | 936 | $2,100 | $2.24 | 7d | 1 | 0.43mi |
| 4348 Plaza Dr Holiday, FL | 1.0–2.0 | 1.0–2.0 | 860 | $1,499 | $1.74 | 1d | 7 | 0.48mi |
| 3301 Rosefield Dr Holiday, FL | 3.0 | 2.0 | 1340 | $2,100 | $1.57 | 20d | 1 | 0.48mi |
| 3252 Peterborough St Holiday, FL | 3.0 | 2.0 | 1290 | $1,631 | $1.26 | 7d | 1 | 0.49mi |
| 4723 Aegean Ave Holiday, FL | 2.0 | 1.0 | 1000 | $1,636 | $1.64 | 7d | 1 | 0.50mi |
| 4205 Jordana Way Holiday, FL | 1.0–3.0 | 1.0–2.0 | 1027 | $1,404 | $1.37 | 5d | 13 | 0.56mi |
| 4620 Tropical Ln Holiday, FL | 2.0 | 1.0 | 1276 | $1,650 | $1.29 | 4d | 1 | 0.56mi |
| 2610 Templewood Dr Holiday, FL | 3.0 | 1.0 | 1056 | $1,800 | $1.70 | 7d | 1 | 0.56mi |
| 5232 Sparrow Dr Holiday, FL | 2.0 | 1.0 | 976 | $1,975 | $2.02 | 26d | 1 | 0.59mi |
| 2552 Chancery Dr Holiday, FL | 2.0 | 1.0 | 816 | $1,595 | $1.95 | 26d | 1 | 0.61mi |
| 4834 Salem Dr New Port Richey, FL | 2.0 | 1.0 | 864 | $1,400 | $1.62 | 1d | 1 | 0.62mi |
| 3439 Clydesdale Dr Holiday, FL | 2.0 | 1.0 | 968 | $1,395 | $1.44 | 7d | 1 | 0.62mi |
| 2509 Sweetwood Dr Holiday, FL | 2.0 | 1.0 | 988 | $1,650 | $1.67 | 20d | 1 | 0.68mi |
| 4835 Blossom Dr Holiday, FL | 2.0 | 2.0 | 1174 | $1,700 | $1.45 | 26d | 1 | 0.72mi |
| 3847 Lighthouse Way New Port Richey, FL | 2.0 | 2.0 | 1144 | $1,595 | $1.39 | 24d | 1 | 0.77mi |
| 4365 Tahitian Gardens Cir Unit C Holiday, FL | 2.0 | 1.0 | 825 | $1,300 | $1.58 | 1d | 1 | 0.81mi |
| 4356 Tahitian Gardens Cir Unit C Holiday, FL | 2.0 | 1.0 | 825 | $1,350 | $1.64 | 26d | 1 | 0.81mi |
| 2412 Arcadia Rd Holiday, FL | 3.0 | 1.0 | 1360 | $1,603 | $1.18 | 26d | 1 | 0.82mi |
| 4354 Tahitian Gardens Cir Unit F Holiday, FL | 2.0 | 1.0 | 825 | $1,500 | $1.82 | 26d | 1 | 0.84mi |
| 4823 Longwood Ave Holiday, FL | 3.0 | 1.0 | 1122 | $1,800 | $1.60 | 7d | 1 | 0.86mi |
| 4301 Straits Ln New Port Richey, FL | 3.0 | 1.5 | 1284 | $1,790 | $1.39 | 26d | 1 | 0.86mi |
| 3029 Corona Dr Holiday, FL | 3.0 | 2.0 | 894 | $1,950 | $2.18 | 7d | 1 | 0.88mi |
| 4351 Tahitian Gardens Cir Holiday, FL | 2.0 | 1.0 | 825 | $1,150 | $1.39 | 26d | 1 | 0.88mi |
| 4313 Tahitian Gardens Cir Unit C Holiday, FL | 2.0 | 1.5 | 825 | $1,300 | $1.58 | 17d | 1 | 0.90mi |
| 4022 Davit Dr New Port Richey, FL | 2.0 | 2.0 | 1144 | $1,600 | $1.40 | 20d | 1 | 0.90mi |
| 4133 Grayton Dr New Port Richey, FL | 2.0 | 1.5 | 1068 | $1,727 | $1.62 | 7d | 1 | 0.90mi |
| 4031 Davit Dr New Port Richey, FL | 2.0 | 2.0 | 1144 | $1,600 | $1.40 | 20d | 1 | 0.91mi |
| 5606 Mirada Dr Holiday, FL | 2.0 | 1.0 | 864 | $1,550 | $1.79 | 17d | 1 | 0.94mi |
| 4326 Tahitian Gardens Cir Unit 14E Holiday, FL | 2.0 | 1.5 | 768 | $2,000 | $2.60 | 26d | 1 | 0.96mi |
| 3516 Sheryl Hill Dr Holiday, FL | 2.0 | 2.0 | 848 | $1,595 | $1.88 | 26d | 1 | 0.96mi |
| 4337 Tahitian Gardens Cir Unit F Holiday, FL | 2.0 | 1.0 | 768 | $1,500 | $1.95 | 26d | 1 | 0.99mi |
| 4124 Flamingo Dr New Port Richey, FL | 3.0 | 1.0 | 744 | $1,500 | $2.02 | 17d | 1 | 0.99mi |
| 4124 Flamingo Dr New Port Richey, FL | 3.0 | 1.0 | 744 | $1,500 | $2.02 | 6d | 1 | 0.99mi |
| 4334 Tahitian Gardens Cir Unit C Holiday, FL | 2.0 | 1.0 | 768 | $1,450 | $1.89 | 26d | 1 | 1.04mi |
| 2117 Calusa Trl Unit B Holiday, FL | 1.0 | 1.0 | 708 | $1,195 | $1.69 | 1d | 1 | 1.05mi |
| 2117 Calusa Trl Holiday, FL | 2.0 | 1.0 | 1205 | $1,595 | $1.32 | 1d | 1 | 1.05mi |
| 5020 Vickers Dr New Port Richey, FL | 2.0 | 1.0 | 863 | $1,495 | $1.73 | 1d | 1 | 1.07mi |
| 3445 Wiltshire Dr Holiday, FL | 2.0 | 1.5 | 992 | $1,450 | $1.46 | 24d | 1 | 1.09mi |
HOA detail
- Monthly dues
- $143 · $1,716/yr
Listing history 11 events
-
2026-02-20status Pending
-
2026-02-09price $135,000
-
2026-01-29status Active
-
2026-01-09status Pending
-
2025-10-16price $145,000
-
2025-08-20$149,500 Active
-
2025-07-19status Pending
-
2025-07-19historical
-
2025-01-23$149,500 Active
-
2005-02-23soldstatus $60,900
-
2001-05-21soldstatus $43,000
ⓘ Source: listings_history table (triggers on properties + properties_extension) + one-shot
backfill from property_details.listing_events for pre-trigger history.
Tax reassessment forecast FL · Resets to sale price
- Current annual tax
- $1,549 · $129/mo
- Projected year-2 tax
- $1,549 · $129/mo
- Expected delta
- $0/yr ($0/mo · 0.0%)
ⓘ Screening estimate from a state-policy table — verify with the county assessor before closing.
Climate risk First Street
- Flood 5/10 Major FEMA zone X (shaded) · 26% chance over 30 yrs
- Wildfire 3/10 Moderate
- Heat 10/10 Extreme 6 d/yr ≥109°F today · 21 d/yr by 30 yrs out
- Wind 10/10 Extreme 99% chance of damaging wind over 30 yrs
- Air quality 2/10 Low 1 unhealthy d/yr today · 1 by 30 yrs out
Nearby sold comps map
Loading sold comps map…
Walkable amenities ~0.75 mi
Loading nearby amenities…
Taxation est. · year 1
- Rental income
- $15,087
- − Mortgage interest
- −$7,562
- − Property taxes
- −$1,549
- − Insurance
- −$675
- − Repairs & maintenance
- −$1,207
- − Management
- −$1,207
- − HOA
- −$1,716
- − Depreciation
- −$3,927
- Taxable loss
- −$2,756
- Est. tax savings @ 24.0%
- +$661
- After-tax cash flow
- $145/yr
For passive investors: Depreciation is non-cash, so a rental often shows a tax loss while cash-flowing — sheltering income. Rental losses are passive: they offset passive income freely, and up to $25,000/yr can offset ordinary (W-2) income if you actively participate and your MAGI is under $100k (phasing out to $0 by $150k); unused losses carry forward. On sale, claimed depreciation is recaptured at up to 25%, and gains may owe capital-gains tax (a 1031 exchange can defer both). Figures are a year-1 estimate at your 24.0% rate — not tax advice; consult a CPA.
Schools (NCES district)
- District
- Pasco
- NCES district ID
- 1201530
- Math proficiency
- 50% ▼ -10.00%
- Reading proficiency
- 52% ▼ -5.00%
- Median HH income
- $45,039
- Composite
- 43.14/100
- National rank
- #3074
- State rank
- #32 of 73 in FL
Livability — Elfers
- Score
- 78/100
- State rank
- #167
- US rank
- #2486
Category grades
Schools grade is shown separately in the Schools card above.
Census & demographics
- Census place
- Elfers, FL
- County
- Pasco County · 524,098 people
- Metro
- Tampa-St. Petersburg-Clearwater, FL
- Population (ZIP)
- 12,498
- Household income
- $49,401
- Rent vs Own
- Severe rent burden
- 625.0
Population outlook (Pasco County) Hauer SSP2
- Today (2025)
- 570,045 people
- By 2030
- 605,844 · +6.3%
- By 2040
- 674,806 · +18.4%
- By 2050
- 736,022 · +29.1%
- By 2075
- 862,900 · +51.4%
- By 2100
- 906,364 · +59.0%
Race, ethnicity, and origin ACS 2023
- Neighborhood character
- Predominantly White (70%)
- Race & ethnicity
- White 70% Hispanic / Latino 21% Two or more races 11% Black 5% Native American 2% Asian 1%
- Hispanic origin (detail)
- Mexican 4% Puerto Rican 7% Cuban 3% Dominican 2%
- Common ancestry
- Lithuanian 3% Romanian 2% Slovak 1%
- Foreign-born
- 12% · Canada, Jamaica, Vietnam
- Languages at home
- 78% English-only · Spanish 16% Arabic 2% Other Indo-European 2%
Political lean MEDSL · Pasco
- 2024 margin
- Strong R (+25.2) · D 36.9% · R 62.1% · Other 1.0%
- 2008→2024 swing
- -21.6pp toward R · 2008: -3.6pp · 2024: -25.2pp
- All cycles
- 2024: R+25.2 2020: R+20.1 2016: R+21.6 2012: R+6.7 2008: R+3.6
Not yet ingested
- Civics
- —
Market trends
- HPI YoY
- ▼ -91.40%
- Current HPI
- 316.5846
- Rent YoY
- ▼ -2.49%
- Metro
- Tampa-St. Petersburg-Clearwater, FL
- State GDP YoY
- ▲ 3.28%
- F500 in state
- 36
Industry mix (Fortune 500 HQ in FL)
| Industry | F500 HQs | Revenue |
|---|---|---|
| Industrial Technology | 2 | $29B |
|
||
| Insurance | 2 | $17B |
|
||
| Retail | 1 | $60B |
|
||
| Technology Distribution | 1 | $58B |
|
||
| Homebuilding | 1 | $35B |
|
||
| Technology Manufacturing | 1 | $35B |
|
||
Price history
+214.0% since first listed11 events — show timeline
- 2026-02-20 Pending — Stellar MLS as Distributed by MLS Grid
- 2026-02-09 Price Changed $135,000 Stellar MLS as Distributed by MLS Grid
- 2026-01-29 Relisted — Stellar MLS as Distributed by MLS Grid
- 2026-01-09 Pending — Stellar MLS as Distributed by MLS Grid
- 2025-10-16 Price Changed $145,000 Stellar MLS as Distributed by MLS Grid
- 2025-08-20 Listed $149,500 Stellar MLS as Distributed by MLS Grid
- 2025-07-19 Pending — Stellar MLS as Distributed by MLS Grid
- 2025-07-19 Listing Removed — Stellar MLS as Distributed by MLS Grid
- 2025-01-23 Listed $149,500 Stellar MLS as Distributed by MLS Grid
- 2005-02-23 Sold (Public Records) $60,900 Public Records
- 2001-05-21 Sold (Public Records) $43,000 Public Records
Property tax history
+22.6%/yrLatest (2025): $1,549 · +666.8% YoY. Source: county tax records.
Cash-flow waterfall
monthlySold comps — $/sqft
last 12 mo · ≤1 miLoading sold comps…