15806 Appleton Ter · Bowie, MD
Flood risk 1/10 · Minimal
- FEMA flood zone
- X (unshaded)
- Chance of flooding over 30 yrs
- 0.0%
- Est. flood insurance / yr
- $473 – $860
Fire risk 3/10 · Minor
- Est. fire insurance / yr
- $755 – $1,403
Heat risk 8/10 · Major
- Hot days now (above 102°F)
- 7 days/yr
- Hot days in 30 yrs
- 16 days/yr
Wind risk 5/10 · Moderate
- Chance of severe wind over 30 yrs
- 23.0%
Air-quality risk 4/10 · Minor
- Unhealthy air days now
- 4 days/yr
- Unhealthy air days in 30 yrs
- 6 days/yr
Risk factors via First Street. Map © Google.
Why this score? — see what drove the D+ grade
The composite is a weighted blend of 9 inputs, each scored 0–100. Each bar is that input's sub-score; the figure is the points it added to the 100-point composite (weight × sub-score).
- ARV discount +15.0/15.0
- Cash flow +14.1/30.0
- 1% rule +4.4/10.0
- DSCR +4.3/10.0
- Rent growth +3.7/5.0
- Livability +3.6/5.0
- Condition / age +2.5/5.0
- Schools +1.7/10.0
- Appreciation +0.0/10.0
$375,000
🖨 Deal sheet (PDF) 📄 Offer letter ✓ Due diligence
Listing remarks MLS
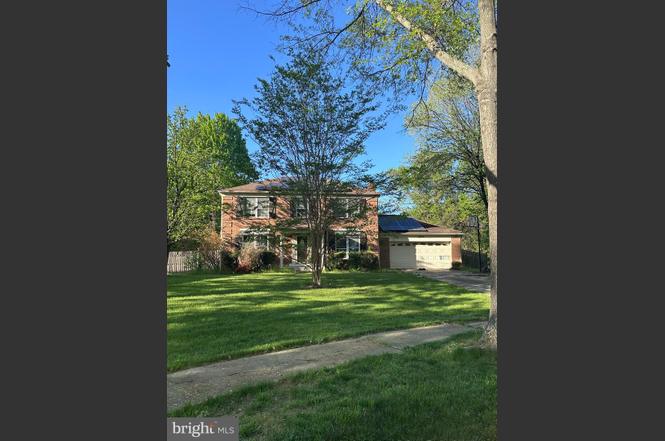
Spectacular four bedroom colonial on a quiet cul-de-sac in Mitchellville East. New granite countertops, updated flooring and appliances in Expanded Kitchen. New carpet and window treatments, freshly painted throughout. Ceiling fans and large closets in all bedrooms. Large tree-filled lot featuring a spacious deck, gazebo and fenced back yard. NO HOA. Street is a snow emergency route.
Key facts
- Cul-de-sac location
- Fenced yard
- Ideal floor plan
Tags
Neighborhood map
What this means for you Summary
Snapshot
- This is a 4-bed/2.5-bath single-family listed at $375k.
Deal economics
- At list price, monthly cash flow is $58 ($692/yr) — positive.
- The deal already cash-flows at list — no discount required.
- To meet the 1% rule (rent ≥ 1% of price), the offer needs to be $353k (6.0% below list).
- Recommended offer: $353k (6.0% below list) — sets the bar for 1% rule.
- Cap rate 6.5% vs local median 4.0% in Bowie — top-decile yield for the area; either an underpriced asset or a hidden risk that comps aren't pricing in. Stress-test before assuming the spread holds.
Location & tenants
- Location reads 71/100 on livability (#159 in MD) — a middle-class / working-renter tenant base. Strengths: employment A+, housing A+; Watch: health & safety C-, amenities F, commute F.
- Prince George'S County Public Schools (suburban): math 8% / reading 24% proficiency, ranked #21 of 24 in MD (top 88%) — low school quality limits family demand, transient renter base, plan for 1-2y turnover.
- Zoned schools: Northview Elementary (math 7% / reading 14%, grade F, #590 of 860 statewide, top 70%, 567 students, 62% FRL); Benjamin Tasker Middle School (math 11% / reading 41%, grade F, #91 of 225 statewide, top 42%, 1,044 students, 52% FRL); Bowie High (math 31% / reading 73%, grade D+, #100 of 222 statewide, top 47%, 2,460 students, 48% FRL) — zoned schools at 54% FRL track the district average.
- Zoned-school proficiency averages 30% at this address vs 16% district-wide (+14 pts) — the actual schools serving this property are materially stronger than the Prince George'S County Public Schools average implies; a family-tenant draw the district grade alone would hide.
- Market conditions: Rents rising fast (+4.6%/yr); 172 active listings in the ZIP; 12 comparable units currently listed for rent nearby; rentals lingering (median 46d on market — plan ~5-8 weeks vacancy on turnover, expect pricing pressure); 67% of comp listings sitting > 30 days — soft ceiling on asking rent; high-income renter base; 1,481 units permitted in Prince George's County in 2024 (0 in 5+ unit buildings).
- This rent runs 34% of the median local income ($125k/yr) — at the standard rent-burdened threshold; future hikes will face affordability resistance.
Forward outlook
- Local home prices are declining (-3.0%/yr); year-one equity from $3k of loan paydown is wiped out by about $11k of value loss. Plan a longer hold.
- Prince George's County population projected at +18% by 2050 — long-run rental-demand tailwind backs the buy-and-hold thesis.
Negotiation context
- Only 3 days on market — expect competitive offers; lowballing is unlikely to land.
- 4 sale attempts since 14y ago with the ask held roughly flat each time — persistent listings suggest the price (not the market) is what's stuck; bring a comps-based counter.
Risks & watch-outs
- Climate carrying-cost: moderate wind risk, 23% chance of damaging wind over 30y; extreme-heat days projected 7→16/yr by 2055 (HVAC capex compounding) — expect insurance premiums to compound above CPI over the hold.
Questions for the listing agent
- Is there a deadline driving the sale (1031 exchange, divorce, estate, relocation)? That informs how much negotiation room exists.
- The area grade is low — what's the realistic commute time and amenity access for the typical tenant pool here? Any planned neighborhood developments (good or bad) we should know about?
- What's the average days-on-market for RENTAL listings here right now (not sales)? A rising rental-DOM trend means longer vacancies and softer asking-rent achievability than the comps imply.
- What's the recent tenant-quality profile in this submarket — average credit score on applications, eviction rate, late-payment / NSF rate, and stable-employment percentage? A property-management company in the area should have these aggregated.
- How much new for-sale + rental construction is in the pipeline within 1–3 miles? Heavy new supply typically softens prices + rents 12–24 months out; constrained supply supports both.
Investment metrics
- 1% rule
- 0.94% ✗
- Cap rate
- 6.48%
- Cash-on-cash
- 0.66%
- DSCR
- 1.03
- GRM
- 8.9
CMA / ARV
- ARV (on-the-fly)
- $536,256
- Comps found
- 12
Show comp detail 12 sales within ~0.75 mi
| Address | Dist | Beds/Ba | Sqft | Sold | Price | $/sf | Match |
|---|---|---|---|---|---|---|---|
| 15702 Appleton Ct | 0.12mi | 4/3.0 | 2,016 (0%) | 1mo | $620,000 | $308 | 92 |
| 2210 Penfield Ln | 0.59mi | 4/2.5 | 2,018 (+0%) | 12mo | $515,000 | $255 | 63 |
| 2543 Ann Arbor Ln | 0.15mi | 3/2.5 (-1) | 1,728 (-14%) | 9mo | $503,000 | $291 | 57 |
| 2205 Pecan Ln | 0.53mi | 4/2.5 | 1,872 (-7%) | 11mo | $440,000 | $235 | 54 |
| 2000 Arbor Hill Ln | 0.70mi | 4/2.5 | 2,103 (+4%) | 10mo | $545,000 | $259 | 52 |
| 15591 Peach Walker Dr | 0.65mi | 3/2.5 (-1) | 1,872 (-7%) | 1mo | $520,600 | $278 | 51 |
| 16404 Edgepark Ct | 0.68mi | 4/2.5 | 2,170 (+8%) | 12mo | $575,000 | $265 | 45 |
| 2412 Panther Ln | 0.42mi | 3/2.0 (-1) | 1,730 (-14%) | 9mo | $460,000 | $266 | 42 |
| 15215 Noblewood Ln | 0.67mi | 4/3.0 | 2,254 (+12%) | 9mo | $535,000 | $237 | 40 |
| 15210 Noblewood Ln | 0.62mi | 3/1.5 (-1) | 1,780 (-12%) | 9mo | $505,000 | $284 | 35 |
| 16308 Eddinger Rd | 0.69mi | 5/3.5 (+1) | 2,208 (+10%) | 10mo | $650,000 | $294 | 35 |
| 15211 Noblewood Ln | 0.65mi | 3/1.5 (-1) | 1,786 (-11%) | 11mo | $465,000 | $260 | 33 |
Match score weights: distance 35% · size 25% · config 20% · recency 20%. Top-matched comps best support the ARV.
Projected returns pro-forma
-3.0% appreciation · 4.61% rent growth · sell at horizon
- IRR
- -13.3%
- Equity multiple
- 0.51×
- Total profit
- $-51,155
- Equity at exit
- $55,914
- IRR
- -1.9%
- Equity multiple
- 0.86×
- Total profit
- $-14,654
- Equity at exit
- $32,423
Cash invested: $105,000 (down + closing). Projections, not guarantees.
Landlord ↔ Tenant lean methodology
- Overall (STATE)
- 27 Tenant-Leaning
- State Maryland
- 27 Tenant-Leaning · D+14
- County
- — inherits STATE
- City
- — inherits STATE
ZIP-level market 20716
- Rents YoY
- 4.6%
- Active inventory
- 172
- Price-to-rent
- 8.9×
Monthly cashflow live
- Estimated rent
- $3,526 high interval (Pro) →
- Mortgage (P&I)
- −$1,967
- Tax from tax record
- −$605 /mo · $7,258/yr
- Insurance
- −$156
- HOA
- −$0
- Vacancy / Maint / Mgmt
- −$740
- Net cashflow
- $58
Break-even live
Sensitivity live
| Price | -10% $270 | -5% $164 | +0% $58 | +5% $-48 | +10% $-155 |
|---|---|---|---|---|---|
| Rent | -10% $-221 | -5% $-82 | +0% $58 | +5% $197 | +10% $336 |
| Rate | -1.0pp $246 | -0.5pp $153 | base $58 | +0.5pp $-40 | +1.0pp $-138 |
UW: 25.0% down · 7.5% · 30yr · 1.5% tax · 5.0% vac · 8.0% maint · 8.0% mgmt
Financing live
Cash to close
- Down payment
- $93,750
- Closing costs
- $11,250
- Reserves months
- —
- Total cash needed
- —
Loan-product check · same deal, 3 products live
Conventional
25% down · 7.5% · 30yr
- Down + closing
- —
- Monthly P&I
- —
- Monthly cashflow
- —
- DSCR
- —
- Eligible?
- —
Personal DTI + credit; lowest rate.
DSCR
20% down · 8.5% · 30yr
- Down + closing
- —
- Monthly P&I
- —
- Monthly cashflow
- —
- DSCR
- —
- Eligible?
- —
No personal income docs; deal must DSCR.
Hard money
10% down · 12.0% · 12mo
- Down + closing
- —
- Monthly P&I
- —
- Monthly cashflow
- —
- DSCR
- —
- Eligible?
- —
Short-term bridge; refi at stabilization.
Rent comps 12 comps
| Address | Beds | Baths | Sqft | Rent | $/sqft | DOM | Units | Dist |
|---|---|---|---|---|---|---|---|---|
| 108 Lawndale Dr Unit 1001 Bowie, MD | 3.0 | 3.0 | 1606 | $3,100 | $1.93 | 24d | 1 | 0.51mi |
| 16103 Eastlawn Ct Bowie, MD | 5.0 | 3.5 | 2208 | $5,000 | $2.26 | 20d | 1 | 0.80mi |
| 15604 Everglade Ln Bowie, MD | 3.0 | 3.0 | 1462 | $3,000 | $2.05 | 46d | 1 | 0.99mi |
| 4013 Estevez Ct Bowie, MD | 3.0 | 3.0 | 1765 | $3,000 | $1.70 | 46d | 1 | 1.15mi |
| 16913 Saint Marion Way Bowie, MD | 3.0 | 3.5 | 2597 | $3,200 | $1.23 | 46d | 1 | 1.19mi |
| 1550 Adamson Way Bowie, MD | 3.0 | 2.5 | 1680 | $3,700 | $2.20 | 46d | 1 | 1.19mi |
| 16912 Saint William Way Bowie, MD | 4.0 | 3.5 | 2219 | $4,000 | $1.80 | 46d | 1 | 1.19mi |
| 16312 Elkhorn Ln Bowie, MD | 3.0 | 2.0 | 1620 | $3,470 | $2.14 | 26d | 1 | 1.19mi |
| 3511 Saint Robin Ln Bowie, MD | 3.0 | 3.5 | 1792 | $3,650 | $2.04 | 46d | 1 | 1.19mi |
| 1303 Port Echo Ln Bowie, MD | 4.0 | 2.0 | 2052 | $3,295 | $1.61 | 26d | 1 | 1.31mi |
| 1303 Port Echo Ln Bowie, MD | 4.0 | 2.0 | 2052 | $3,495 | $1.70 | 46d | 1 | 1.31mi |
| 15758 Pointer Ridge Dr Bowie, MD | 4.0 | 2.0 | 1566 | $2,900 | $1.85 | 46d | 1 | 1.32mi |
Listing history 15 events
-
2025-06-30soldstatus $460,000
-
2025-05-02status Pending
-
2025-04-29$375,000 Active
-
2024-07-17historical
-
2024-07-16$430,000 Active
-
2012-07-26soldstatus $330,000
-
2012-07-03soldstatus $330,000 386-char remark
Show marketing remark (386 chars)
Spectacular four bedroom colonial on a quiet cul-de-sac in Mitchellville East. New granite countertops, updated flooring and appliances in Expanded Kitchen. New carpet and window treatments, freshly painted throughout. Ceiling fans and large closets in all bedrooms. Large tree-filled lot featuring a spacious deck, gazebo and fenced back yard. NO HOA. Street is a snow emergency route.
-
2012-07-03price $330,000 Sold
Show marketing remark (386 chars)
Spectacular four bedroom colonial on a quiet cul-de-sac in Mitchellville East. New granite countertops, updated flooring and appliances in Expanded Kitchen. New carpet and window treatments, freshly painted throughout. Ceiling fans and large closets in all bedrooms. Large tree-filled lot featuring a spacious deck, gazebo and fenced back yard. NO HOA. Street is a snow emergency route.
-
2012-07-03soldstatus $330,000 Sold
Show marketing remark (386 chars)
Spectacular four bedroom colonial on a quiet cul-de-sac in Mitchellville East. New granite countertops, updated flooring and appliances in Expanded Kitchen. New carpet and window treatments, freshly painted throughout. Ceiling fans and large closets in all bedrooms. Large tree-filled lot featuring a spacious deck, gazebo and fenced back yard. NO HOA. Street is a snow emergency route.
-
2012-04-26status Contract
-
2012-04-24historical 386-char remark
Show marketing remark (386 chars)
Spectacular four bedroom colonial on a quiet cul-de-sac in Mitchellville East. New granite countertops, updated flooring and appliances in Expanded Kitchen. New carpet and window treatments, freshly painted throughout. Ceiling fans and large closets in all bedrooms. Large tree-filled lot featuring a spacious deck, gazebo and fenced back yard. NO HOA. Street is a snow emergency route.
-
2012-04-19$349,999 Active
Show marketing remark (386 chars)
Spectacular four bedroom colonial on a quiet cul-de-sac in Mitchellville East. New granite countertops, updated flooring and appliances in Expanded Kitchen. New carpet and window treatments, freshly painted throughout. Ceiling fans and large closets in all bedrooms. Large tree-filled lot featuring a spacious deck, gazebo and fenced back yard. NO HOA. Street is a snow emergency route.
-
2012-04-19$330,000 386-char remark
Show marketing remark (386 chars)
Spectacular four bedroom colonial on a quiet cul-de-sac in Mitchellville East. New granite countertops, updated flooring and appliances in Expanded Kitchen. New carpet and window treatments, freshly painted throughout. Ceiling fans and large closets in all bedrooms. Large tree-filled lot featuring a spacious deck, gazebo and fenced back yard. NO HOA. Street is a snow emergency route.
-
1990-03-14soldstatus $200,000
-
1985-12-31soldstatus $129,240
ⓘ Source: listings_history table (triggers on properties + properties_extension) + one-shot
backfill from property_details.listing_events for pre-trigger history.
Tax reassessment forecast MD · Partial reset (capped growth)
- Current annual tax
- $7,258 · $605/mo
- Projected year-2 tax
- $7,258 · $605/mo
- Expected delta
- $0/yr ($0/mo · 0.0%)
ⓘ Screening estimate from a state-policy table — verify with the county assessor before closing.
Climate risk First Street
- Flood 1/10 Low FEMA zone X (unshaded) · 0% chance over 30 yrs
- Wildfire 3/10 Moderate
- Heat 8/10 Severe 7 d/yr ≥102°F today · 16 d/yr by 30 yrs out
- Wind 5/10 Major 23% chance of damaging wind over 30 yrs
- Air quality 4/10 Moderate 4 unhealthy d/yr today · 6 by 30 yrs out
Nearby sold comps map
Loading sold comps map…
Walkable amenities ~0.75 mi
Loading nearby amenities…
Taxation est. · year 1
- Rental income
- $42,308
- − Mortgage interest
- −$21,006
- − Property taxes
- −$7,258
- − Insurance
- −$1,875
- − Repairs & maintenance
- −$3,385
- − Management
- −$3,385
- − Depreciation
- −$10,909
- Taxable loss
- −$5,509
- Est. tax savings @ 24.0%
- +$1,322
- After-tax cash flow
- $2,014/yr
For passive investors: Depreciation is non-cash, so a rental often shows a tax loss while cash-flowing — sheltering income. Rental losses are passive: they offset passive income freely, and up to $25,000/yr can offset ordinary (W-2) income if you actively participate and your MAGI is under $100k (phasing out to $0 by $150k); unused losses carry forward. On sale, claimed depreciation is recaptured at up to 25%, and gains may owe capital-gains tax (a 1031 exchange can defer both). Figures are a year-1 estimate at your 24.0% rate — not tax advice; consult a CPA.
Schools (NCES district)
- District
- Prince George'S County Public Schools
- NCES district ID
- 2400510
- Math proficiency
- 8% ▼ -11.00%
- Reading proficiency
- 24% ▼ -9.00%
- Median HH income
- $73,967
- Composite
- 16.82/100
- National rank
- #9151
- State rank
- #21 of 24 in MD
Livability — Bowie
- Score
- 71/100
- State rank
- #159
- US rank
- #7194
Category grades
Schools grade is shown separately in the Schools card above.
Census & demographics
- Census place
- Bowie, MD
- County
- Prince Georges County · 919,866 people
- City population
- 105,324
- Metro
- Washington-Arlington-Alexandria, DC-VA-MD-WV
- Population (ZIP)
- 22,362
- Household income
- $125,034
- Rent vs Own
- Severe rent burden
- 913.0
Population outlook (Prince George's County) Hauer SSP2
- Today (2025)
- 1,005,426 people
- By 2030
- 1,048,416 · +4.3%
- By 2040
- 1,123,425 · +11.7%
- By 2050
- 1,183,220 · +17.7%
- By 2075
- 1,306,202 · +29.9%
- By 2100
- 1,408,179 · +40.1%
Race, ethnicity, and origin ACS 2023
- Neighborhood character
- Predominantly Black (67%)
- Race & ethnicity
- Black 67% White 17% Hispanic / Latino 9% Two or more races 6% Asian 3%
- Hispanic origin (detail)
- Mexican 2% Puerto Rican 2% Dominican 2%
- Common ancestry
- Swiss 1% Slovak 1% Romanian 1%
- Foreign-born
- 17% · Canada
- Languages at home
- 81% English-only · Spanish 7% French/Haitian/Cajun 3% Other Indo-European 1%
Political lean MEDSL · Prince George's
- 2024 margin
- Solid D (+75.2) · D 86.3% · R 11.2% · Other 2.5%
- 2008→2024 swing
- -3.3pp toward R · 2008: 78.5pp · 2024: 75.2pp
- All cycles
- 2024: D+75.2 2020: D+80.5 2016: D+81.0 2012: D+80.9 2008: D+78.5
Not yet ingested
- Civics
- —
Market trends
- HPI YoY
- ▼ -302.27%
- Current HPI
- 285.1976
- Rent YoY
- ▲ 4.61%
- Metro
- Washington-Arlington-Alexandria, DC-VA-MD-WV
- State GDP YoY
- ▲ 2.97%
- F500 in state
- 12
Industry mix (Fortune 500 HQ in MD)
| Industry | F500 HQs | Revenue |
|---|---|---|
| Aerospace / Defense | 1 | $71B |
|
||
| Utilities | 1 | $25B |
|
||
| Hotels | 1 | $24B |
|
||
| Consumer Goods | 1 | $7B |
|
||
| Real Estate | 1 | $6B |
|
||
| Chemicals | 1 | $2B |
|
||
Price history
+255.9% since first listed15 events — show timeline
- 2025-06-30 Sold (Public Records) $460,000 Public Records
- 2025-05-02 Pending — BRIGHT MLS
- 2025-04-29 Listed $375,000 BRIGHT MLS
- 2024-07-17 Listing Removed — BRIGHT MLS
- 2024-07-16 Listed $430,000 BRIGHT MLS
- 2012-07-26 Sold (Public Records) $330,000 Public Records
- 2012-07-03 Sold (MLS) $330,000 MRIS
- 2012-07-03 Price Changed $330,000 MRIS
- 2012-07-03 Sold (MLS) $330,000 BRIGHT MLS
- 2012-04-26 Pending — MRIS
- 2012-04-24 Listing Removed — BRIGHT MLS
- 2012-04-19 Listed $349,999 MRIS
- 2012-04-19 Listed $330,000 BRIGHT MLS
- 1990-03-14 Sold (Public Records) $200,000 Public Records
- 1985-12-31 Sold (Public Records) $129,240 Public Records
Property tax history
+5.0%/yrLatest (2025): $7,258 · +5.1% YoY. Source: county tax records.
Cash-flow waterfall
monthlySold comps — $/sqft
last 12 mo · ≤1 miLoading sold comps…