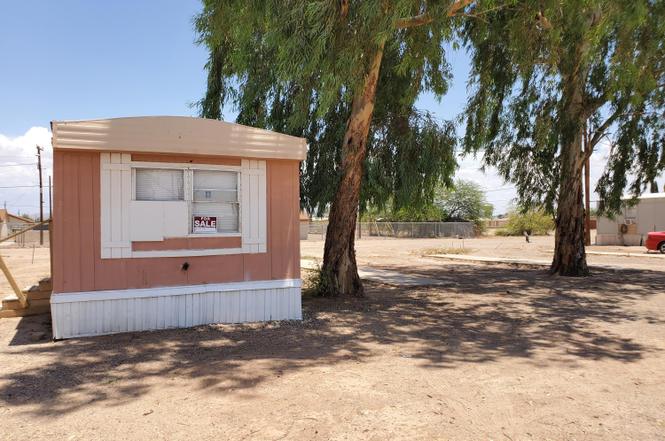
799 W Battaglia Rd #43 · Eloy, AZ
Flood risk 1/10 · Minimal
- FEMA flood zone
- X (unshaded)
- Chance of flooding over 30 yrs
- 0.0%
- Est. flood insurance / yr
- $507 – $1,088
Fire risk 5/10 · Moderate
- Est. fire insurance / yr
- $610 – $1,132
Heat risk 9/10 · Severe
- Hot days now (above 112°F)
- 7 days/yr
- Hot days in 30 yrs
- 20 days/yr
Wind risk 1/10 · Minimal
- Chance of severe wind over 30 yrs
- —
Air-quality risk 1/10 · Minimal
- Unhealthy air days now
- 0 days/yr
- Unhealthy air days in 30 yrs
- 0 days/yr
Risk factors via First Street. Map © Google.
Why this score? — see what drove the C- grade
The composite is a weighted blend of 9 inputs, each scored 0–100. Each bar is that input's sub-score; the figure is the points it added to the 100-point composite (weight × sub-score).
- Cash flow +15.0/30.0
- ARV discount +15.0/15.0
- 1% rule +5.0/10.0
- DSCR +5.0/10.0
- Livability +3.2/5.0
- Rent growth +2.5/5.0
- Condition / age +2.5/5.0
- Schools +1.9/10.0
- Appreciation +0.0/10.0
$13,500
🖨 Deal sheet 📄 Offer letter ✓ Due diligence
Listing remarks
Seller will may carry the Note . No Age Restrictions!!! 3 bedroom 1bath. Lot rent for the home is only $480.00 . .Owner must apply with park
Key facts
- Built 1983
- Listed 341 days
Property features AI
Finance
- Financial info: Annual tax amount: $300 (2024)
- HOA & community: Land lease of $480 monthly; No association fees included
Exterior
- Utilities: City water; Public sewer
- Home design: Manufactured/mobile home; Leasehold ownership
- Construction: Steel frame construction; Painted exterior; Metal roof; Building area source: owner
- Exterior features: No fencing; Lot features: none
Interior
- Kitchen: Electric range/oven
- Bedrooms: Possible 2 bedrooms
- Bathrooms: 1 full bathroom
- Heating & cooling: Electric heating; Window/wall cooling unit
- Interior features: Full bathroom connected to the master bedroom
- Laundry & utility: Washer/dryer hookup only
Neighborhood map
What this means for you Summary
Snapshot
- This is a 2-bed/1.0-bath manufactured listed at $14k.
Deal economics
- At list price, monthly cash flow is $796 ($10k/yr) — positive.
- The deal already cash-flows at list — no discount required.
- Meets the 1% rule at list price ($1k rent vs $14k).
- Recommended offer: $12k (12.0% below list) — sets the bar for market timing.
- Cap rate 77.1% vs local median 1.3% in Eloy — top-decile yield for the area; either an underpriced asset or a hidden risk that comps aren't pricing in. Stress-test before assuming the spread holds.
Location & tenants
- Location reads 65/100 on livability (#78 in AZ) — a middle-class / working-renter tenant base. Strengths: cost of living A+, housing A+; Watch: crime D+, amenities D-, commute F.
- Santa Cruz Valley Union High School District (4454) (town): math 11% / reading 30% proficiency, ranked #382 of 501 in AZ (top 76%) — low school quality limits family demand, transient renter base, plan for 1-2y turnover.
- Zoned schools: Santa Cruz Valley Union High School (math 15% / reading 24%, grade F, #230 of 381 statewide, top 61%, 340 students, 78% FRL).
- Market conditions: 440 active listings in the ZIP; 5 comparable units currently listed for rent nearby; rentals leasing fast (median 1d on market — plan ~1-2 weeks tenant-placement turnaround); 9,504 units permitted in Pinal County in 2024 (776 in 5+ unit buildings).
Forward outlook
- Local home prices are declining (-3.0%/yr); year-one equity from $93 of loan paydown is wiped out by about $405 of value loss. Plan a longer hold.
- At projected returns (-3.0% appreciation + 3.0% rent growth), your $4k cash investment doubles in ~1 year — after that, you're playing with house money.
Negotiation context
- It's been on market 341 days — a 12% lower offer ($12k) is reasonable based on typical stale-listing flexibility.
Risks & watch-outs
- Climate carrying-cost: moderate wildfire risk; extreme-heat days projected 7→20/yr by 2055 (HVAC capex compounding) — expect insurance premiums to compound above CPI over the hold.
Questions for the listing agent
- It's been on market 341 days. Have you received any prior offers? Is the seller open to a 12% concession, seller financing, or rate buy-down credit?
- Why hasn't it sold? Are there any deal-killer items the seller is aware of (foundation, flood, title, zoning, code violations)?
- Is there a deadline driving the sale (1031 exchange, divorce, estate, relocation)? That informs how much negotiation room exists.
- Schools are F-rated, which usually means shorter tenancies and higher turnover. Who's the typical renter profile here, and what's been the actual vacancy rate?
- Crime grade is D in this area — have there been break-ins, vandalism, or insurance claims at this property in the last 3 years? What carrier currently insures it and at what premium?
- What's the average days-on-market for RENTAL listings here right now (not sales)? A rising rental-DOM trend means longer vacancies and softer asking-rent achievability than the comps imply.
- What's the recent tenant-quality profile in this submarket — average credit score on applications, eviction rate, late-payment / NSF rate, and stable-employment percentage? A property-management company in the area should have these aggregated.
- How much new for-sale + rental construction is in the pipeline within 1–3 miles? Heavy new supply typically softens prices + rents 12–24 months out; constrained supply supports both.
Investment metrics
- 1% rule
- 8.34% ✓
- Cap rate
- 77.06%
- Cash-on-cash
- 252.74%
- DSCR
- 12.25
- GRM
- 1.0
CMA / ARV
- ARV (on-the-fly)
- $22,400
- Comps found
- 2
Show comp detail 2 sales within ~0.75 mi
| Address | Dist | Beds/Ba | Sqft | Sold | Price | $/sf | Match |
|---|---|---|---|---|---|---|---|
| 799 W Battaglia Rd #18 | 0.04mi | 3/1.0 (+1) | 800 (0%) | 2mo | $22,000 | $28 | 92 |
| 799 W Battaglia Rd #23 | 0.06mi | 2/1.5 | 900 (+12%) | 14mo | $13,000 | $14 | 63 |
Match score weights: distance 35% · size 25% · config 20% · recency 20%. Top-matched comps best support the ARV.
Projected returns pro-forma
-3.0% appreciation · 3.0% rent growth · sell at horizon
- IRR
- —
- Equity multiple
- 13.84×
- Total profit
- $48,536
- Equity at exit
- $2,013
- IRR
- —
- Equity multiple
- 29.47×
- Total profit
- $107,626
- Equity at exit
- $1,167
Cash invested: $3,780 (down + closing). Projections, not guarantees.
Landlord ↔ Tenant lean methodology
- Overall (STATE)
- 87 Strongly Landlord-Friendly
- State Arizona
- 87 Strongly Landlord-Friendly · R+3
- County
- — inherits STATE
- City
- — inherits STATE
ZIP-level market 85131
- Home prices YoY
- -25.9%
- Active inventory
- 440
- Price-to-rent
- 1.0×
Monthly cashflow live
- Estimated rent
- $1,126 high interval (Pro) →
- Mortgage (P&I)
- −$71
- Tax est. 1.5%
- −$17 /mo · $202/yr
- Insurance
- −$6
- HOA
- −$0
- Vacancy / Maint / Mgmt
- −$236
- Net cashflow
- $796
Break-even live
UW: 25.0% down · 7.5% · 30yr · 1.5% tax · 5.0% vac · 8.0% maint · 8.0% mgmt
Financing live
Cash to close
- Down payment
- $3,375
- Closing costs
- $405
- Reserves months
- —
- Total cash needed
- —
Loan-product check · same deal, 3 products live
Conventional
25% down · 7.5% · 30yr
- Down + closing
- —
- Monthly P&I
- —
- Monthly cashflow
- —
- DSCR
- —
- Eligible?
- —
Personal DTI + credit; lowest rate.
DSCR
20% down · 8.5% · 30yr
- Down + closing
- —
- Monthly P&I
- —
- Monthly cashflow
- —
- DSCR
- —
- Eligible?
- —
No personal income docs; deal must DSCR.
Hard money
10% down · 12.0% · 12mo
- Down + closing
- —
- Monthly P&I
- —
- Monthly cashflow
- —
- DSCR
- —
- Eligible?
- —
Short-term bridge; refi at stabilization.
Rent comps 5 comps
| Address | Beds | Baths | Sqft | Rent | $/sqft | DOM | Units | Dist |
|---|---|---|---|---|---|---|---|---|
| 810 N Curiel St Unit A Eloy, AZ | 2.0 | 1.0 | 600 | $1,050 | $1.75 | 1d | 1 | 0.52mi |
| 507 W Alsdorf Rd Eloy, AZ | 1.0 | 1.0 | 675 | $995 | $1.47 | 1d | 1 | 0.98mi |
| 401 N D St Eloy, AZ | 2.0–3.0 | 1.0 | 875 | $850 | $0.97 | 1d | 4 | 1.06mi |
| 403 N Sunshine Blvd Unit A Eloy, AZ | 2.0 | 1.0 | 805 | $1,095 | $1.36 | 1d | 1 | 1.15mi |
| 403 N Sunshine Blvd Unit C Eloy, AZ | 2.0 | 1.0 | 805 | $1,145 | $1.42 | 1d | 1 | 1.15mi |
Listing history 19 events
-
2026-06-18days on market $13,500 Active 341 DOM
-
2026-06-17days on market $13,500 Active 340 DOM
-
2026-06-16days on market $13,500 Active 339 DOM
-
2026-06-15days on market $13,500 Active 338 DOM
-
2026-06-13days on market $13,500 Active 336 DOM
-
2026-06-13days on market $13,500 Active 335 DOM
-
2026-06-09days on market $13,500 Active 332 DOM
-
2026-06-08days on market $13,500 Active 331 DOM
-
2026-06-07days on market $13,500 Active 330 DOM
-
2026-06-04days on market $13,500 Active 327 DOM
-
2026-06-03days on market $13,500 Active 326 DOM
-
2026-06-02days on market $13,500 Active 325 DOM
-
2026-06-01days on market $13,500 Active 324 DOM
-
2026-05-31days on market $13,500 Active 323 DOM
-
2026-02-27price $13,500
-
2026-01-27price $15,500
-
2025-10-31price $16,500
-
2025-09-13price $24,500
-
2025-07-07$25,000 Active
ⓘ Source: listings_history table (triggers on properties + properties_extension) + one-shot
backfill from property_details.listing_events for pre-trigger history.
Climate risk First Street
- Flood 1/10 Low FEMA zone X (unshaded) · 0% chance over 30 yrs
- Wildfire 5/10 Major
- Heat 9/10 Extreme 7 d/yr ≥112°F today · 20 d/yr by 30 yrs out
- Wind 1/10 Low
- Air quality 1/10 Low 0 unhealthy d/yr today · 0 by 30 yrs out
Nearby sold comps map
Loading sold comps map…
Walkable amenities ~0.75 mi
Loading nearby amenities…
Taxation est. · year 1
- Rental income
- $13,510
- − Mortgage interest
- −$756
- − Property taxes
- −$202
- − Insurance
- −$68
- − Repairs & maintenance
- −$1,081
- − Management
- −$1,081
- − Depreciation
- −$393
- Taxable income
- $9,930
- Est. tax owed @ 24.0%
- −$2,383
- After-tax cash flow
- $7,171/yr
For passive investors: Depreciation is non-cash, so a rental often shows a tax loss while cash-flowing — sheltering income. Rental losses are passive: they offset passive income freely, and up to $25,000/yr can offset ordinary (W-2) income if you actively participate and your MAGI is under $100k (phasing out to $0 by $150k); unused losses carry forward. On sale, claimed depreciation is recaptured at up to 25%, and gains may owe capital-gains tax (a 1031 exchange can defer both). Figures are a year-1 estimate at your 24.0% rate — not tax advice; consult a CPA.
Schools (NCES district)
- District
- Santa Cruz Valley Union High School District (4454)
- NCES district ID
- 0407530
- Math proficiency
- 11% ▲ 1.00%
- Reading proficiency
- 30% ▲ 15.00%
- Median HH income
- $24,927
- Composite
- 19.12/100
- National rank
- #13971
- State rank
- #382 of 501 in AZ
Livability — Eloy
- Score
- 65/100
- State rank
- #78
- US rank
- #12496
Category grades
Schools grade is shown separately in the Schools card above.
Census & demographics
- Census place
- Eloy, AZ
- County
- Pinal County · 399,947 people
- City population
- 18,794
- Metro
- Phoenix-Mesa-Chandler, AZ
- Population (ZIP)
- 18,794
- Household income
- $56,576
- Rent vs Own
- Severe rent burden
- 301.0
Population outlook (Pinal County) Hauer SSP2
- Today (2025)
- 437,574 people
- By 2030
- 446,903 · +2.1%
- By 2040
- 452,589 · +3.4%
- By 2050
- 444,126 · +1.5%
- By 2075
- 430,300 · -1.7%
- By 2100
- 393,536 · -10.1%
Race, ethnicity, and origin ACS 2023
- Neighborhood character
- Diverse neighborhood (Simpson 0.65)
- Race & ethnicity
- Hispanic / Latino 47% White 36% Two or more races 16% Black 8% Native American 5% Pacific Islander 1%
- Hispanic origin (detail)
- Mexican 43%
- Common ancestry
- Italian 4% Slovak 1% Lithuanian 1%
- Foreign-born
- 16% · Canada
- Languages at home
- 65% English-only · Spanish 32% Other Asian/Pacific 1% Russian/Polish/Slavic 1%
Political lean MEDSL · Pinal
- 2024 margin
- Strong R (+22.1) · D 38.5% · R 60.6%
- 2008→2024 swing
- -7.6pp toward R · 2008: -14.5pp · 2024: -22.1pp
- All cycles
- 2024: R+22.1 2020: R+17.3 2016: R+19.3 2012: R+17.1 2008: R+14.5
Not yet ingested
- Civics
- —
Market trends
- HPI YoY
- ▼ -60.00%
- Current HPI
- 171.3217
- Rent YoY
- —
- Metro
- Phoenix-Mesa-Chandler, AZ
- State GDP YoY
- ▲ 4.54%
- F500 in state
- 20
Industry mix (Fortune 500 HQ in AZ)
| Industry | F500 HQs | Revenue |
|---|---|---|
| Technology | 2 | $13B |
|
||
| Mining / Metals | 1 | $23B |
|
||
| Environmental Services | 1 | $16B |
|
||
| Metals / Steel | 1 | $14B |
|
||
| Technology Distribution | 1 | $9B |
|
||
| Homebuilding | 1 | $8B |
|
||
Price history
-46.0% since first listed5 events — show timeline
- 2026-02-27 Price Changed $13,500 ARMLS
- 2026-01-27 Price Changed $15,500 ARMLS
- 2025-10-31 Price Changed $16,500 ARMLS
- 2025-09-13 Price Changed $24,500 ARMLS
- 2025-07-07 Listed $25,000 ARMLS
Cash-flow waterfall
monthlySold comps — $/sqft
last 12 mo · ≤1 miLoading sold comps…