 🌊 Lakefront
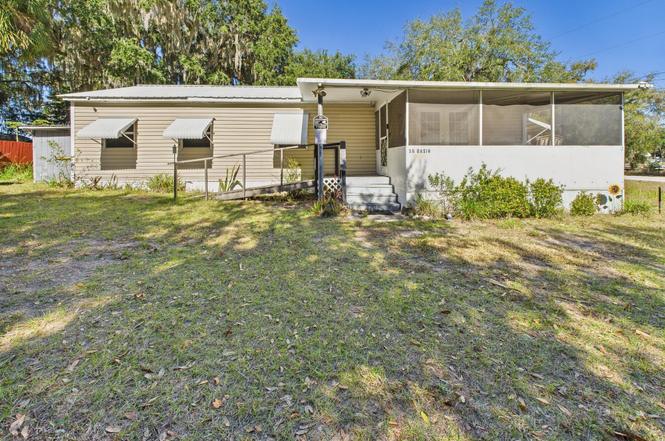
56 Basin St · Lorida, FL
Flood risk 1/10 · Minimal
- FEMA flood zone
- X (unshaded)
- Chance of flooding over 30 yrs
- 0.0%
- Est. flood insurance / yr
- $507 – $1,088
Fire risk 4/10 · Minor
- Est. fire insurance / yr
- $947 – $1,759
Heat risk 9/10 · Severe
- Hot days now (above 107°F)
- 7 days/yr
- Hot days in 30 yrs
- 24 days/yr
Wind risk 9/10 · Severe
- Chance of severe wind over 30 yrs
- 99.0%
Air-quality risk 2/10 · Minimal
- Unhealthy air days now
- 0 days/yr
- Unhealthy air days in 30 yrs
- 2 days/yr
Risk factors via First Street. Map © Google.
Why this score? — see what drove the C- grade
The composite is a weighted blend of 9 inputs, each scored 0–100. Each bar is that input's sub-score; the figure is the points it added to the 100-point composite (weight × sub-score).
- Cash flow +17.4/30.0
- ARV discount +7.5/15.0
- DSCR +5.4/10.0
- Appreciation +5.4/10.0
- 1% rule +4.1/10.0
- Schools +3.6/10.0
- Rent growth +2.5/5.0
- Livability +2.5/5.0
- Condition / age +2.5/5.0
$129,500
🖨 Deal sheet (PDF) 📄 Offer letter ✓ Due diligence
Listing remarks
Set in a quiet basin along the Kissimmee River, this inviting property offers direct water access and its own boat slip, perfect for relaxed waterfront living. The residence features four bedrooms and two bathrooms, plus an attached workshop and a separate storage shed for added convenience. Thoughtfully updated throughout, the home blends comfort and functionality and is ready for its next owners to enjoy. Offered at a competitive price, this is a wonderful opportunity to secure a serene riverfront retreat
Key facts
- Attached workshop
- Waterfront living
- Boat slip
Tags
Property features AI
Finance
- Other: Pets allowed with no restrictions
- HOA & community: No association amenities
Exterior
- Utilities: No utilities listed
- Home design: Mobile home; Single-story; Faces southwest; Resale condition
- Construction: Vinyl siding; Modular construction; Built as a single-story unit
- Exterior features: Waterfront property with a basin
Interior
- Kitchen: Refrigerator
- Bedrooms: 1 bedroom on the main level
- Flooring: Carpet; Vinyl
- Bathrooms: 2 full bathrooms
- Heating & cooling: Central heating; Central air conditioning; Ceiling fans
- Interior features: Cathedral ceilings; Vaulted ceilings; Kitchen island; French doors
- Laundry & utility: Washer hookup; Dryer hookup
Neighborhood map
What this means for you Summary
Snapshot
- This is a 4-bed/1.0-bath manufactured listed at $130k.
Deal economics
- At list price, monthly cash flow is $97 ($1k/yr) — positive.
- The deal already cash-flows at list — no discount required.
- To meet the 1% rule (rent ≥ 1% of price), the offer needs to be $118k (9.2% below list).
- Recommended offer: $114k (12.0% below list) — sets the bar for market timing.
Location & tenants
- Location reads: area grade C — affects rentability + tenant quality, not the cash-flow math above.
- Highlands (other): math 45% / reading 43% proficiency, ranked #54 of 73 in FL (top 74%) — families likely to look elsewhere, expect single-tenant / working-renter base with shorter leases; 68% free/reduced lunch — lower-income household profile, screen leases tightly.
- Market conditions: 58 active listings in the ZIP; 980 units permitted in Highlands County in 2024 (80 in 5+ unit buildings).
Forward outlook
- In year one you build about $2k of equity ($895 loan paydown + $1k appreciation (0.8% local appreciation)).
- At projected returns (0.8% appreciation + 3.0% rent growth), your $36k cash investment doubles in ~9 years — after that, you're playing with house money.
Negotiation context
- It's been on market 172 days — a 12% lower offer ($114k) is reasonable based on typical stale-listing flexibility.
Risks & watch-outs
- Climate carrying-cost: severe wind risk, 99% chance of damaging wind over 30y; extreme-heat days projected 7→24/yr by 2055 (HVAC capex compounding) — expect insurance premiums to compound above CPI over the hold.
Questions for the listing agent
- It's been on market 172 days. Have you received any prior offers? Is the seller open to a 12% concession, seller financing, or rate buy-down credit?
- Built in 1972 — when were the roof, HVAC, electrical panel, plumbing, and water heater last replaced?
- Why hasn't it sold? Are there any deal-killer items the seller is aware of (foundation, flood, title, zoning, code violations)?
- Is there a deadline driving the sale (1031 exchange, divorce, estate, relocation)? That informs how much negotiation room exists.
- This sits on a lake — are riparian / water-frontage rights deeded with the parcel? Any dock permits, shoreline easements, or HOA water-use restrictions?
- What's the documented flood / surge / shoreline-erosion history here (FEMA AND non-FEMA — e.g., storm surge, creek backup, septic-field saturation)?
- Any water-quality or seasonal algae-bloom issues that affect tenant satisfaction or short-term-rental demand?
- What's the average days-on-market for RENTAL listings here right now (not sales)? A rising rental-DOM trend means longer vacancies and softer asking-rent achievability than the comps imply.
- What's the recent tenant-quality profile in this submarket — average credit score on applications, eviction rate, late-payment / NSF rate, and stable-employment percentage? A property-management company in the area should have these aggregated.
- How much new for-sale + rental construction is in the pipeline within 1–3 miles? Heavy new supply typically softens prices + rents 12–24 months out; constrained supply supports both.
Investment metrics
- 1% rule
- 0.91% ✗
- Cap rate
- 7.20%
- Cash-on-cash
- 3.23%
- DSCR
- 1.14
- GRM
- 9.2
CMA / ARV
No comps found within radius.
Projected returns pro-forma
0.82% appreciation · 3.0% rent growth · sell at horizon
- IRR
- 4.1%
- Equity multiple
- 1.21×
- Total profit
- $7,492
- Equity at exit
- $43,020
- IRR
- 8.6%
- Equity multiple
- 2.03×
- Total profit
- $37,384
- Equity at exit
- $56,260
Cash invested: $36,260 (down + closing). Projections, not guarantees.
Landlord ↔ Tenant lean methodology
- Overall (STATE)
- 87 Strongly Landlord-Friendly
- State Florida
- 87 Strongly Landlord-Friendly · R+3
- County
- — inherits STATE
- City
- — inherits STATE
ZIP-level market 33857
- Home prices YoY
- 0.3%
- Active inventory
- 58
- Price-to-rent
- 9.2×
Monthly cashflow live
- Estimated rent
- $1,175 medium interval (Pro) →
- Mortgage (P&I)
- −$679
- Tax from tax record
- −$98 /mo · $1,176/yr
- Insurance
- −$54
- HOA
- −$0
- Vacancy / Maint / Mgmt
- −$247
- Net cashflow
- $97
Break-even live
Sensitivity live
| Price | -10% $171 | -5% $134 | +0% $97 | +5% $61 | +10% $24 |
|---|---|---|---|---|---|
| Rent | -10% $5 | -5% $51 | +0% $97 | +5% $144 | +10% $190 |
| Rate | -1.0pp $163 | -0.5pp $130 | base $97 | +0.5pp $64 | +1.0pp $30 |
UW: 25.0% down · 7.5% · 30yr · 1.5% tax · 5.0% vac · 8.0% maint · 8.0% mgmt
Financing live
Cash to close
- Down payment
- $32,375
- Closing costs
- $3,885
- Reserves months
- —
- Total cash needed
- —
Loan-product check · same deal, 3 products live
Conventional
25% down · 7.5% · 30yr
- Down + closing
- —
- Monthly P&I
- —
- Monthly cashflow
- —
- DSCR
- —
- Eligible?
- —
Personal DTI + credit; lowest rate.
DSCR
20% down · 8.5% · 30yr
- Down + closing
- —
- Monthly P&I
- —
- Monthly cashflow
- —
- DSCR
- —
- Eligible?
- —
No personal income docs; deal must DSCR.
Hard money
10% down · 12.0% · 12mo
- Down + closing
- —
- Monthly P&I
- —
- Monthly cashflow
- —
- DSCR
- —
- Eligible?
- —
Short-term bridge; refi at stabilization.
Listing history 19 events
-
2026-06-19days on market $129,500 Active 172 DOM
-
2026-06-18days on market $129,500 Active 171 DOM
-
2026-06-17days on market $129,500 Active 170 DOM
-
2026-06-16days on market $129,500 Active 169 DOM
-
2026-06-15days on market $129,500 Active 168 DOM
-
2026-06-14days on market $129,500 Active 166 DOM
-
2026-06-10days on market $129,500 Active 163 DOM
-
2026-06-09days on market $129,500 Active 162 DOM
-
2026-06-08days on market $129,500 Active 161 DOM
-
2026-06-07days on market $129,500 Active 160 DOM
-
2026-06-02days on market $129,500 Active 155 DOM
-
2026-06-01days on market $129,500 Active 154 DOM
-
2026-05-31days on market $129,500 Active 153 DOM
-
2026-05-30days on market $129,500 Active 152 DOM
-
2026-04-26price $129,500
-
2026-03-30price $139,999
-
2026-01-30price $144,999
-
2025-12-29$145,000 Active
-
2024-06-14soldstatus $120,000
ⓘ Source: listings_history table (triggers on properties + properties_extension) + one-shot
backfill from property_details.listing_events for pre-trigger history.
Tax reassessment forecast FL · Resets to sale price
- Current annual tax
- $1,176 · $98/mo
- Projected year-2 tax
- $1,176 · $98/mo
- Expected delta
- $0/yr ($0/mo · 0.0%)
ⓘ Screening estimate from a state-policy table — verify with the county assessor before closing.
Climate risk First Street
- Flood 1/10 Low FEMA zone X (unshaded) · 0% chance over 30 yrs
- Wildfire 4/10 Moderate
- Heat 9/10 Extreme 7 d/yr ≥107°F today · 24 d/yr by 30 yrs out
- Wind 9/10 Extreme 99% chance of damaging wind over 30 yrs
- Air quality 2/10 Low 0 unhealthy d/yr today · 2 by 30 yrs out
Nearby sold comps map
Loading sold comps map…
Walkable amenities ~0.75 mi
Loading nearby amenities…
Taxation est. · year 1
- Rental income
- $14,105
- − Mortgage interest
- −$7,254
- − Property taxes
- −$1,176
- − Insurance
- −$648
- − Repairs & maintenance
- −$1,128
- − Management
- −$1,128
- − Depreciation
- −$3,767
- Taxable loss
- −$997
- Est. tax savings @ 24.0%
- +$239
- After-tax cash flow
- $1,409/yr
For passive investors: Depreciation is non-cash, so a rental often shows a tax loss while cash-flowing — sheltering income. Rental losses are passive: they offset passive income freely, and up to $25,000/yr can offset ordinary (W-2) income if you actively participate and your MAGI is under $100k (phasing out to $0 by $150k); unused losses carry forward. On sale, claimed depreciation is recaptured at up to 25%, and gains may owe capital-gains tax (a 1031 exchange can defer both). Figures are a year-1 estimate at your 24.0% rate — not tax advice; consult a CPA.
Schools (NCES district)
- District
- Highlands
- NCES district ID
- 1200840
- Math proficiency
- 45% ▼ -7.00%
- Reading proficiency
- 43% ▼ -3.00%
- Median HH income
- $35,276
- Composite
- 36.42/100
- National rank
- #4672
- State rank
- #54 of 73 in FL
Livability — Lorida
No livability data for this city. (Only ~50 U.S. cities are tracked.)
Census & demographics
- Population (ZIP)
- 935
Population outlook (Highlands County) Hauer SSP2
- Today (2025)
- 99,674 people
- By 2030
- 99,615 · -0.1%
- By 2040
- 99,342 · -0.3%
- By 2050
- 98,242 · -1.4%
- By 2075
- 93,291 · -6.4%
- By 2100
- 79,894 · -19.8%
Race, ethnicity, and origin ACS 2023
- Neighborhood character
- Predominantly White (97%)
- Race & ethnicity
- White 97% Two or more races 3% Hispanic / Latino 1%
- Common ancestry
- Lithuanian 6% Slovak 5% Iranian 2%
- Foreign-born
- 8% · Canada
- Languages at home
- 99% English-only · Spanish 1%
Political lean MEDSL · Highlands
- 2024 margin
- Solid R (+40.8) · D 29.3% · R 70.1%
- 2008→2024 swing
- -22.7pp toward R · 2008: -18.1pp · 2024: -40.8pp
- All cycles
- 2024: R+40.8 2020: R+34.4 2016: R+32.0 2012: R+23.0 2008: R+18.1
Not yet ingested
- Civics
- —
Market trends
- HPI YoY
- ▲ 0.82%
- Current HPI
- 274.7204
- Rent YoY
- —
- Metro
- —
- State GDP YoY
- ▲ 3.28%
- F500 in state
- 36
Industry mix (Fortune 500 HQ in FL)
| Industry | F500 HQs | Revenue |
|---|---|---|
| Industrial Technology | 2 | $29B |
|
||
| Insurance | 2 | $17B |
|
||
| Retail | 1 | $60B |
|
||
| Technology Distribution | 1 | $58B |
|
||
| Homebuilding | 1 | $35B |
|
||
| Technology Manufacturing | 1 | $35B |
|
||
Price history
+7.9% since first listed5 events — show timeline
- 2026-04-26 Price Changed $129,500 Beaches MLS
- 2026-03-30 Price Changed $139,999 Beaches MLS
- 2026-01-30 Price Changed $144,999 Beaches MLS
- 2025-12-29 Listed $145,000 Beaches MLS
- 2024-06-14 Sold (Public Records) $120,000 Public Records
Property tax history
+5.2%/yrLatest (2025): $1,176 · +20.4% YoY. Source: county tax records.
Cash-flow waterfall
monthlySold comps — $/sqft
last 12 mo · ≤1 miLoading sold comps…