5701 Live Oak #15 · Kelseyville, CA
Flood risk 8/10 · Major
- FEMA flood zone
- X (unshaded)
- Chance of flooding over 30 yrs
- 0.99%
- Est. flood insurance / yr
- $507 – $1,088
Fire risk 10/10 · Severe
- Est. fire insurance / yr
- $659 – $1,223
Heat risk 5/10 · Moderate
- Hot days now (above 99°F)
- 7 days/yr
- Hot days in 30 yrs
- 14 days/yr
Wind risk 1/10 · Minimal
- Chance of severe wind over 30 yrs
- —
Air-quality risk 10/10 · Severe
- Unhealthy air days now
- 32 days/yr
- Unhealthy air days in 30 yrs
- 32 days/yr
Risk factors via First Street. Map © Google.
Why this score? — see what drove the B- grade
The composite is a weighted blend of 9 inputs, each scored 0–100. Each bar is that input's sub-score; the figure is the points it added to the 100-point composite (weight × sub-score).
- Cash flow +30.0/30.0
- 1% rule +10.0/10.0
- DSCR +10.0/10.0
- ARV discount +7.5/15.0
- Livability +2.6/5.0
- Rent growth +2.5/5.0
- Schools +2.5/10.0
- Condition / age +2.5/5.0
- Appreciation +0.0/10.0
$61,000
🖨 Deal sheet 📄 Offer letter ✓ Due diligence
Listing remarks MLS
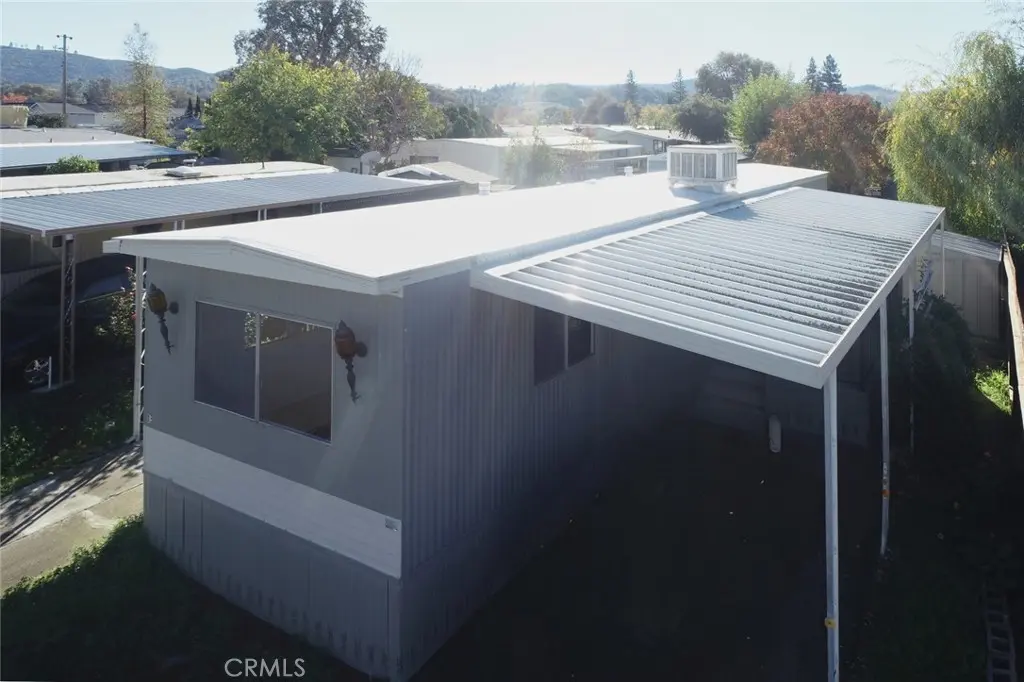
Remodeled 2-bedroom, 1 bath in a well maintained senior mobile home park. Close to downtown Kelseyville, shopping, and public transportation. Parking, front and back porch. Nice size back yard for your gardening, plants or just entertaining friends and family.
Key facts
- Remodeled
- Back yard
- Front and back porch
Tags
Neighborhood map
What this means for you Summary
Snapshot
- This is a 2-bed/1.0-bath land listed at $61k.
Deal economics
- At list price, monthly cash flow is $865 ($10k/yr) — positive.
- The deal already cash-flows at list — no discount required.
- Meets the 1% rule at list price ($2k rent vs $61k).
- Recommended offer: $54k (12.0% below list) — sets the bar for market timing.
- Cap rate 24.6% vs local median 2.2% in Kelseyville — top-decile yield for the area; either an underpriced asset or a hidden risk that comps aren't pricing in. Stress-test before assuming the spread holds.
Location & tenants
- Location reads 51/100 on livability (#1,059 in CA) — a working-class tenant base; expect higher turnover. Strengths: crime A; Watch: health & safety C-, cost of living D+, schools F.
- Kelseyville Unified (town): math 18% / reading 33% proficiency, ranked #1,150 of 1,400 in CA (top 82%) — low school quality limits family demand, transient renter base, plan for 1-2y turnover; 68% free/reduced lunch — lower-income household profile, screen leases tightly.
- Market conditions: 268 active listings in the ZIP; 107 units permitted in Lake County in 2024 (40 in 5+ unit buildings).
- This rent runs 33% of the median local income ($63k/yr) — at the standard rent-burdened threshold; future hikes will face affordability resistance.
Forward outlook
- Local home prices are declining (-3.0%/yr); year-one equity from $422 of loan paydown is wiped out by about $2k of value loss. Plan a longer hold.
- Lake County population projected at -15% by 2050 — secular population decline; favor cash flow + early exit over multi-decade hold.
- At projected returns (-3.0% appreciation + 3.0% rent growth), your $17k cash investment doubles in ~2 years — after that, you're playing with house money.
Negotiation context
- It's been on market 208 days — a 12% lower offer ($54k) is reasonable based on typical stale-listing flexibility.
Risks & watch-outs
- Watch-outs: flood insurance adds $66/mo.
- Climate carrying-cost: severe flood risk; severe wildfire risk; extreme-heat days projected 7→14/yr by 2055 (HVAC capex compounding) — expect insurance premiums to compound above CPI over the hold.
Questions for the listing agent
- It's been on market 208 days. Have you received any prior offers? Is the seller open to a 12% concession, seller financing, or rate buy-down credit?
- What's the actual annual flood-insurance premium (NFIP or private), and is the property in a SFHA with mandatory coverage?
- Why hasn't it sold? Are there any deal-killer items the seller is aware of (foundation, flood, title, zoning, code violations)?
- Is there a deadline driving the sale (1031 exchange, divorce, estate, relocation)? That informs how much negotiation room exists.
- Schools are F-rated, which usually means shorter tenancies and higher turnover. Who's the typical renter profile here, and what's been the actual vacancy rate?
- What's the average days-on-market for RENTAL listings here right now (not sales)? A rising rental-DOM trend means longer vacancies and softer asking-rent achievability than the comps imply.
- What's the recent tenant-quality profile in this submarket — average credit score on applications, eviction rate, late-payment / NSF rate, and stable-employment percentage? A property-management company in the area should have these aggregated.
- How much new for-sale + rental construction is in the pipeline within 1–3 miles? Heavy new supply typically softens prices + rents 12–24 months out; constrained supply supports both.
Investment metrics
- 1% rule
- 2.81% ✓
- Cap rate
- 24.62%
- Cash-on-cash
- 65.45%
- DSCR
- 3.91
- GRM
- 3.0
CMA / ARV
- ARV (median comp)
- $21,133
- List price
- $61,000
- Delta
- 188.65%
- Verdict
- OVERPRICED
- Comps
- 2 within 1.0 mi
Projected returns pro-forma
-3.0% appreciation · 3.0% rent growth · sell at horizon
- IRR
- 59.6%
- Equity multiple
- 3.65×
- Total profit
- $45,284
- Equity at exit
- $9,095
- IRR
- 64.4%
- Equity multiple
- 7.48×
- Total profit
- $110,655
- Equity at exit
- $5,274
Cash invested: $17,080 (down + closing). Projections, not guarantees.
Landlord ↔ Tenant lean methodology
- Overall (STATE)
- 18 Strongly Tenant-Friendly
- State California
- 18 Strongly Tenant-Friendly · D+13
- County
- — inherits STATE
- City
- — inherits STATE
ZIP-level market 95451
- Active inventory
- 268
- Price-to-rent
- 3.0×
Monthly cashflow live
- Estimated rent
- $1,713 medium interval (Pro) →
- Mortgage (P&I)
- −$320
- Tax est. 1.5%
- −$76 /mo · $915/yr
- Insurance
- −$25
- Flood insurance flood zone
- −$66 /mo · $798/yr
- HOA
- −$0
- Vacancy / Maint / Mgmt
- −$360
- Net cashflow
- $865
Break-even live
UW: 25.0% down · 7.5% · 30yr · 1.5% tax · 5.0% vac · 8.0% maint · 8.0% mgmt
Financing live
Cash to close
- Down payment
- $15,250
- Closing costs
- $1,830
- Reserves months
- —
- Total cash needed
- —
Loan-product check · same deal, 3 products live
Conventional
25% down · 7.5% · 30yr
- Down + closing
- —
- Monthly P&I
- —
- Monthly cashflow
- —
- DSCR
- —
- Eligible?
- —
Personal DTI + credit; lowest rate.
DSCR
20% down · 8.5% · 30yr
- Down + closing
- —
- Monthly P&I
- —
- Monthly cashflow
- —
- DSCR
- —
- Eligible?
- —
No personal income docs; deal must DSCR.
Hard money
10% down · 12.0% · 12mo
- Down + closing
- —
- Monthly P&I
- —
- Monthly cashflow
- —
- DSCR
- —
- Eligible?
- —
Short-term bridge; refi at stabilization.
Listing history 19 events
-
2026-06-19days on market $61,000 Active 208 DOM
-
2026-06-18days on market $61,000 Active 207 DOM
-
2026-06-17days on market $61,000 Active 206 DOM
-
2026-06-16days on market $61,000 Active 205 DOM
-
2026-06-15days on market $61,000 Active 204 DOM
-
2026-06-14days on market $61,000 Active 202 DOM
-
2026-06-12days on market $61,000 Active 201 DOM
-
2026-06-09days on market $61,000 Active 198 DOM
-
2026-06-08days on market $61,000 Active 197 DOM
-
2026-06-07days on market $61,000 Active 196 DOM
-
2026-06-07days on market $61,000 Active 195 DOM
-
2026-06-03days on market $61,000 Active 192 DOM
-
2026-06-02days on market $61,000 Active 191 DOM
-
2026-06-01days on market $61,000 Active 190 DOM
-
2026-05-31days on market $61,000 Active 189 DOM
-
2026-05-30days on market $61,000 Active 188 DOM
-
2026-05-20price $61,000 260-char remark
Show marketing remark (260 chars)
Remodeled 2-bedroom, 1 bath in a well maintained senior mobile home park. Close to downtown Kelseyville, shopping, and public transportation. Parking, front and back porch. Nice size back yard for your gardening, plants or just entertaining friends and family.
-
2026-03-11price $62,000 260-char remark
Show marketing remark (260 chars)
Remodeled 2-bedroom, 1 bath in a well maintained senior mobile home park. Close to downtown Kelseyville, shopping, and public transportation. Parking, front and back porch. Nice size back yard for your gardening, plants or just entertaining friends and family.
-
2025-11-23$63,000 Active 260-char remark
Show marketing remark (260 chars)
Remodeled 2-bedroom, 1 bath in a well maintained senior mobile home park. Close to downtown Kelseyville, shopping, and public transportation. Parking, front and back porch. Nice size back yard for your gardening, plants or just entertaining friends and family.
ⓘ Source: listings_history table (triggers on properties + properties_extension) + one-shot
backfill from property_details.listing_events for pre-trigger history.
Climate risk First Street
- Flood 8/10 Severe FEMA zone X (unshaded) · 99% chance over 30 yrs
- Wildfire 10/10 Extreme
- Heat 5/10 Major 7 d/yr ≥99°F today · 14 d/yr by 30 yrs out
- Wind 1/10 Low
- Air quality 10/10 Extreme 32 unhealthy d/yr today · 32 by 30 yrs out
Nearby sold comps map
Loading sold comps map…
Walkable amenities ~0.75 mi
Loading nearby amenities…
Taxation est. · year 1
- Rental income
- $20,554
- − Mortgage interest
- −$3,417
- − Property taxes
- −$915
- − Insurance
- −$1,102
- − Repairs & maintenance
- −$1,644
- − Management
- −$1,644
- − Depreciation
- −$1,775
- Taxable income
- $10,057
- Est. tax owed @ 24.0%
- −$2,414
- After-tax cash flow
- $7,968/yr
For passive investors: Depreciation is non-cash, so a rental often shows a tax loss while cash-flowing — sheltering income. Rental losses are passive: they offset passive income freely, and up to $25,000/yr can offset ordinary (W-2) income if you actively participate and your MAGI is under $100k (phasing out to $0 by $150k); unused losses carry forward. On sale, claimed depreciation is recaptured at up to 25%, and gains may owe capital-gains tax (a 1031 exchange can defer both). Figures are a year-1 estimate at your 24.0% rate — not tax advice; consult a CPA.
Schools (NCES district)
- District
- Kelseyville Unified
- NCES district ID
- 0619320
- Math proficiency
- 18% ▼ -1.00%
- Reading proficiency
- 33% ▲ 4.00%
- Median HH income
- $47,210
- Composite
- 25.19/100
- National rank
- #12920
- State rank
- #1150 of 1400 in CA
Livability — Kelseyville
- Score
- 51/100
- State rank
- #1059
- US rank
- #25219
Category grades
Schools grade is shown separately in the Schools card above.
Census & demographics
- Census place
- Kelseyville, CA
- County
- Lake County · 24,333 people
- City population
- 12,592
- Metro
- Clearlake, CA
- Population (ZIP)
- 12,592
- Household income
- $62,568
- Rent vs Own
- Severe rent burden
- 194.0
Population outlook (Lake County) Hauer SSP2
- Today (2025)
- 62,396 people
- By 2030
- 60,626 · -2.8%
- By 2040
- 56,453 · -9.5%
- By 2050
- 53,054 · -15.0%
- By 2075
- 47,663 · -23.6%
- By 2100
- 41,804 · -33.0%
Race, ethnicity, and origin ACS 2023
- Neighborhood character
- Majority White (57%)
- Race & ethnicity
- White 57% Hispanic / Latino 38% Two or more races 11% Black 1%
- Hispanic origin (detail)
- Mexican 35%
- Common ancestry
- Russian 3% Slovak 3% Italian 2%
- Foreign-born
- 14% · Canada
- Languages at home
- 71% English-only · Spanish 28% German/W. Germanic 1%
Political lean MEDSL · Lake
- 2024 margin
- Toss-up / Even · D 47.8% · R 49.2% · Other 3.0%
- 2008→2024 swing
- -20.6pp toward R · 2008: 19.3pp · 2024: -1.4pp
- All cycles
- 2024: R+1.4 2020: D+6.3 2016: D+3.7 2012: D+16.5 2008: D+19.3
Not yet ingested
- Civics
- —
Market trends
- HPI YoY
- ▼ -158.45%
- Current HPI
- 168.6995
- Rent YoY
- —
- Metro
- Clearlake, CA
- State GDP YoY
- ▲ 3.21%
- F500 in state
- 116
Industry mix (Fortune 500 HQ in CA)
| Industry | F500 HQs | Revenue |
|---|---|---|
| Technology | 27 | $1,492B |
|
||
| Financial Services | 3 | $174B |
|
||
| Retail | 3 | $44B |
|
||
| Insurance | 3 | $26B |
|
||
| Media / Entertainment | 2 | $115B |
|
||
| Pharmaceuticals / Biotech | 2 | $62B |
|
||
Price history
-3.2% since first listed3 events — show timeline
- 2026-05-20 Price Changed $61,000 CRMLS
- 2026-03-11 Price Changed $62,000 CRMLS
- 2025-11-23 Listed $63,000 CRMLS
Property tax history
+10.7%/yrLatest (2025): $117 · -31.8% YoY. Source: county tax records.
Cash-flow waterfall
monthlySold comps — $/sqft
last 12 mo · ≤1 miLoading sold comps…