 🔨 Auction
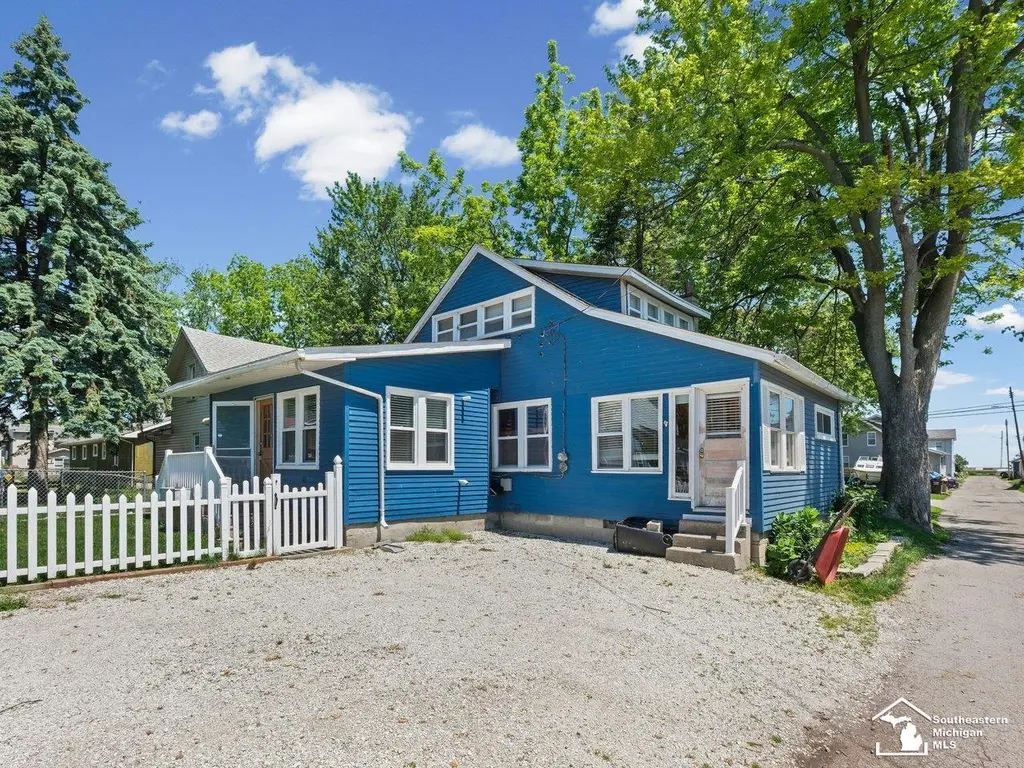
4346 4th St · Luna Pier, MI
Flood risk 3/10 · Minor
- FEMA flood zone
- AE
- Chance of flooding over 30 yrs
- 0.07%
- Est. flood insurance / yr
- $1,737 – $8,500
Fire risk 1/10 · Minimal
- Est. fire insurance / yr
- $784 – $1,456
Heat risk 3/10 · Minor
- Hot days now (above 99°F)
- 7 days/yr
- Hot days in 30 yrs
- 16 days/yr
Wind risk 2/10 · Minimal
- Chance of severe wind over 30 yrs
- —
Air-quality risk 4/10 · Minor
- Unhealthy air days now
- 5 days/yr
- Unhealthy air days in 30 yrs
- 5 days/yr
Risk factors via First Street. Map © Google.
Why this score? — see what drove the D- grade
The composite is a weighted blend of 9 inputs, each scored 0–100. Each bar is that input's sub-score; the figure is the points it added to the 100-point composite (weight × sub-score).
- Appreciation +8.0/10.0
- ARV discount +7.5/15.0
- Cash flow +7.0/30.0
- Schools +3.8/10.0
- Livability +3.7/5.0
- Rent growth +2.5/5.0
- Condition / age +2.5/5.0
- DSCR +1.2/10.0
- 1% rule +0.7/10.0
$59,000
🖨 Deal sheet 📄 Offer letter ✓ Due diligence
Listing remarks MLS
This is a $59,000 MINIMUN-BID Auction on site on Wednesday, July 1, 2026 at 4p. m. ! This property is being sold "as-is" and has amazing potential for a Lake Erie rental or Air B & B! Two blocks from Luna Pier's public beach and Lighthouse! Super cute and clean 3/4 bed home with a main-floor laundry room. Kitchen/living room/dining area open floor plan on main floor. One bedroom on main floor. Younger roof and 10 replacement windows. Vinyl plank and wood floors. Light and bright charming decor. Parking for 3-4 vehicles. Nearby parks, restaurants, boat docks/public lake access, and highway. NO SHOWINGS UNTIL THE DAY OF THE AUCTION! Preview starts at 2:30 p. m. with the auction starting at 4 p. m. Come bid your price for this awesome home!
Key facts
- Open floor plan
- Younger roof
- Vinyl plank floors
Tags
Property features AI
Finance
- Other: Subdivision: BURNS ADDITION; Cross street: Lakewood / Harold
- HOA & community: Homeowners association present
Exterior
- Utilities: Public water; Public sewer
- Home design: Single-family residence; Two levels
- Construction: Wood siding; Crawl space foundation; Built area above grade: 1,239 square feet
- Exterior features: Front porch; Shed(s); Lake privileges; Has view; City lot; Paved, publicly maintained road
Interior
- Kitchen: Dishwasher; Microwave; Oven; Refrigerator; Range; Gas water heater
- Bedrooms: Total of 8 rooms (includes bedrooms and living spaces)
- Flooring: Hardwood
- Bathrooms: 2 full bathrooms
- Heating & cooling: Forced air heating (natural gas); Central air; Ceiling fan(s)
- Interior features: High speed internet; Window treatments
- Laundry & utility: Gas water heater
Neighborhood map
What this means for you Summary
Snapshot
- This is a 3-bed/1.0-bath single-family listed at $59k.
Deal economics
- At list price, monthly cash flow is $-733 ($-9k/yr) — negative.
- The deal already cash-flows at list — no discount required.
- Meets the 1% rule at list price ($1k rent vs $59k).
- Recommended offer: $58k (1.5% below list) — sets the bar for market timing.
Location & tenants
- Location reads 73/100 on livability (#227 in MI) — a middle-class / working-renter tenant base. Strengths: crime A+, cost of living A+, housing A+; Watch: schools F, amenities F, commute F.
- Mason Consolidated Schools (Monroe) (rural): math 38% / reading 49% proficiency, ranked #155 of 540 in MI (top 29%) — families likely to look elsewhere, expect single-tenant / working-renter base with shorter leases.
- Market conditions: 8 active listings in the ZIP; 264 units permitted in Monroe County in 2024 (40 in 5+ unit buildings).
Forward outlook
- In year one you build about $14k of equity ($1k loan paydown + $13k appreciation (6.0% local appreciation)).
- Monroe County population projected at -20% by 2050 — secular population decline; favor cash flow + early exit over multi-decade hold.
- By year 3, paydown + projected appreciation supports a ~$35k cash-out refi (75% LTV) — recoverable capital for the next deal without selling this one.
Negotiation context
- It's been on market 17 days — a 2% lower offer ($58k) is reasonable based on typical stale-listing flexibility.
- 2 sale attempts with the ask held roughly flat each time — persistent listings suggest the price (not the market) is what's stuck; bring a comps-based counter.
- Current owner paid $26k; list at $59k implies a 131% gain — meaningful room to come down on a strong offer.
Risks & watch-outs
- Watch-outs: flood insurance adds $427/mo; built in 1900 — expect roof / HVAC / electrical / plumbing capex.
- Climate carrying-cost: in FEMA flood zone AE (mandatory federal flood insurance) — expect insurance premiums to compound above CPI over the hold.
Questions for the listing agent
- What do current leases actually rent for vs. the listed asking? Can we see a recent rent roll and the last 12 months of T-12 income?
- Built in 1900 — when were the roof, HVAC, electrical panel, plumbing, and water heater last replaced?
- What's the actual annual flood-insurance premium (NFIP or private), and is the property in a SFHA with mandatory coverage?
- Is there a deadline driving the sale (1031 exchange, divorce, estate, relocation)? That informs how much negotiation room exists.
- Schools are F-rated, which usually means shorter tenancies and higher turnover. Who's the typical renter profile here, and what's been the actual vacancy rate?
- The area grade is low — what's the realistic commute time and amenity access for the typical tenant pool here? Any planned neighborhood developments (good or bad) we should know about?
- What's the average days-on-market for RENTAL listings here right now (not sales)? A rising rental-DOM trend means longer vacancies and softer asking-rent achievability than the comps imply.
- What's the recent tenant-quality profile in this submarket — average credit score on applications, eviction rate, late-payment / NSF rate, and stable-employment percentage? A property-management company in the area should have these aggregated.
- How much new for-sale + rental construction is in the pipeline within 1–3 miles? Heavy new supply typically softens prices + rents 12–24 months out; constrained supply supports both.
Investment metrics
- 1% rule
- 0.57% ✗
- Cap rate
- 4.54%
- Cash-on-cash
- -6.28%
- DSCR
- 0.72
- GRM
- 14.6
CMA / ARV
- ARV (on-the-fly)
- $209,391
- Comps found
- 6
Show comp detail 6 sales within ~0.75 mi
| Address | Dist | Beds/Ba | Sqft | Sold | Price | $/sf | Match |
|---|---|---|---|---|---|---|---|
| 4427 Buckeye St | 0.18mi | 3/1.5 | 1,178 (-5%) | 6mo | $155,000 | $132 | 76 |
| 4336 2nd St | 0.06mi | 3/1.0 | 1,164 (-6%) | 20mo | $41,200 | $35 | 70 |
| 4340 S 5th St | 0.03mi | 4/1.5 (+1) | 1,320 (+6%) | 18mo | $65,000 | $49 | 66 |
| 4448 SPRING St | 0.25mi | 3/1.0 | 1,116 (-10%) | 13mo | $189,000 | $169 | 61 |
| 4448 Spring St | 0.26mi | 3/1.0 | 1,116 (-10%) | 13mo | $189,000 | $169 | 60 |
| 410 Beachwalk Trl | 0.45mi | 2/1.5 (-1) | 1,056 (-15%) | 12mo | $204,000 | $193 | 37 |
Match score weights: distance 35% · size 25% · config 20% · recency 20%. Top-matched comps best support the ARV.
Projected returns pro-forma
5.97% appreciation · 3.0% rent growth · sell at horizon
- IRR
- 3.4%
- Equity multiple
- 1.23×
- Total profit
- $13,570
- Equity at exit
- $131,263
- IRR
- 6.3%
- Equity multiple
- 2.31×
- Total profit
- $76,883
- Equity at exit
- $237,721
Cash invested: $58,629 (down + closing). Projections, not guarantees.
Landlord ↔ Tenant lean methodology
- Overall (STATE)
- 62 Landlord-Friendly
- State Michigan
- 62 Landlord-Friendly · EVEN
- County
- — inherits STATE
- City
- — inherits STATE
ZIP-level market 48157
- Home prices YoY
- 3.1%
- Active inventory
- 8
- Price-to-rent
- 4.1×
Monthly cashflow live
- Estimated rent
- $1,195 medium interval (Pro) →
- Mortgage (P&I)
- −$1,098
- Tax from tax record
- −$65 /mo · $782/yr
- Insurance
- −$87
- Flood insurance flood zone
- −$427 /mo · $5,118/yr
- HOA
- −$0
- Vacancy / Maint / Mgmt
- −$251
- Net cashflow
- $-733
Break-even live
UW: 25.0% down · 7.5% · 30yr · 1.5% tax · 5.0% vac · 8.0% maint · 8.0% mgmt
Financing live
Cash to close
- Down payment
- $52,348
- Closing costs
- $6,282
- Reserves months
- —
- Total cash needed
- —
Loan-product check · same deal, 3 products live
Conventional
25% down · 7.5% · 30yr
- Down + closing
- —
- Monthly P&I
- —
- Monthly cashflow
- —
- DSCR
- —
- Eligible?
- —
Personal DTI + credit; lowest rate.
DSCR
20% down · 8.5% · 30yr
- Down + closing
- —
- Monthly P&I
- —
- Monthly cashflow
- —
- DSCR
- —
- Eligible?
- —
No personal income docs; deal must DSCR.
Hard money
10% down · 12.0% · 12mo
- Down + closing
- —
- Monthly P&I
- —
- Monthly cashflow
- —
- DSCR
- —
- Eligible?
- —
Short-term bridge; refi at stabilization.
Listing history 12 events
-
2026-06-18days on market $59,000 Active 17 DOM
-
2026-06-17days on market $59,000 Active 16 DOM
-
2026-06-16days on market $59,000 Active 15 DOM
-
2026-06-15days on market $59,000 Active 14 DOM
-
2026-06-14days on market $59,000 Active 12 DOM
-
2026-06-10days on market $59,000 Active 9 DOM
-
2026-06-09days on market $59,000 Active 8 DOM
-
2026-06-08days on market $59,000 Active 7 DOM
-
2026-06-07days on market $59,000 Active 6 DOM
-
2026-06-03days on market $59,000 Active 2 DOM
-
2026-06-02remarks 685-char remark
-
2026-06-02$59,000 Active 1 DOM
ⓘ Source: listings_history table (triggers on properties + properties_extension) + one-shot
backfill from property_details.listing_events for pre-trigger history.
Tax reassessment forecast MI · Partial reset (capped growth)
- Current annual tax
- $782 · $65/mo
- Projected year-2 tax
- $846 · $70/mo
- Expected delta
- +$63/yr (+$5/mo · 8.1%)
ⓘ Screening estimate from a state-policy table — verify with the county assessor before closing.
Climate risk First Street
- Flood 3/10 Moderate FEMA zone AE · 7% chance over 30 yrs
- Wildfire 1/10 Low
- Heat 3/10 Moderate 7 d/yr ≥99°F today · 16 d/yr by 30 yrs out
- Wind 2/10 Low
- Air quality 4/10 Moderate 5 unhealthy d/yr today · 5 by 30 yrs out
Nearby sold comps map
Loading sold comps map…
Walkable amenities ~0.75 mi
Loading nearby amenities…
Taxation est. · year 1
- Rental income
- $14,337
- − Mortgage interest
- −$11,729
- − Property taxes
- −$782
- − Insurance
- −$6,165
- − Repairs & maintenance
- −$1,147
- − Management
- −$1,147
- − Depreciation
- −$6,091
- Taxable loss
- −$12,725
- Est. tax savings @ 24.0%
- +$3,054
- After-tax cash flow
- $-5,744/yr
For passive investors: Depreciation is non-cash, so a rental often shows a tax loss while cash-flowing — sheltering income. Rental losses are passive: they offset passive income freely, and up to $25,000/yr can offset ordinary (W-2) income if you actively participate and your MAGI is under $100k (phasing out to $0 by $150k); unused losses carry forward. On sale, claimed depreciation is recaptured at up to 25%, and gains may owe capital-gains tax (a 1031 exchange can defer both). Figures are a year-1 estimate at your 24.0% rate — not tax advice; consult a CPA.
Schools (NCES district)
- District
- Mason Consolidated Schools (Monroe)
- NCES district ID
- 2623100
- Math proficiency
- 38% ▼ -13.00%
- Reading proficiency
- 49% ▼ -8.00%
- Median HH income
- $53,798
- Composite
- 37.72/100
- National rank
- #4355
- State rank
- #155 of 540 in MI
Livability — Luna Pier
- Score
- 73/100
- State rank
- #227
- US rank
- #5696
Category grades
Schools grade is shown separately in the Schools card above.
Census & demographics
- Census place
- Luna Pier, MI
- City population
- 1,204
- Population (ZIP)
- 1,204
Population outlook (Monroe County) Hauer SSP2
- Today (2025)
- 144,439 people
- By 2030
- 140,033 · -3.1%
- By 2040
- 128,408 · -11.1%
- By 2050
- 115,024 · -20.4%
- By 2075
- 87,273 · -39.6%
- By 2100
- 63,110 · -56.3%
Race, ethnicity, and origin ACS 2023
- Neighborhood character
- Predominantly White (87%)
- Race & ethnicity
- White 87% Two or more races 9% Hispanic / Latino 4% Asian 1%
- Common ancestry
- Romanian 11% Italian 5% Lithuanian 5%
- Foreign-born
- 2%
- Languages at home
- 98% English-only · Russian/Polish/Slavic 1% Other Asian/Pacific 1%
Political lean MEDSL · Monroe
- 2024 margin
- Strong R (+27.1) · D 35.7% · R 62.9% · Other 1.4%
- 2008→2024 swing
- -31.5pp toward R · 2008: 4.3pp · 2024: -27.1pp
- All cycles
- 2024: R+27.1 2020: R+22.6 2016: R+22.1 2012: D+1.0 2008: D+4.3
Not yet ingested
- Civics
- —
Market trends
- HPI YoY
- ▲ 5.97%
- Current HPI
- 195.3386
- Rent YoY
- —
- Metro
- —
- State GDP YoY
- ▲ 1.37%
- F500 in state
- 28
Industry mix (Fortune 500 HQ in MI)
| Industry | F500 HQs | Revenue |
|---|---|---|
| Automotive Parts | 3 | $48B |
|
||
| Automotive | 2 | $372B |
|
||
| Chemicals | 1 | $45B |
|
||
| Automotive Retail | 1 | $29B |
|
||
| Healthcare / Medical Devices | 1 | $23B |
|
||
| Automotive Technology | 1 | $20B |
|
||
Price history
+131.4% since first listed3 events — show timeline
- 2026-06-01 Listed $59,000 REALCOMP
- 2026-06-01 Listed $59,000 MiRealSource-MiMLS
- 2011-08-03 Sold (Public Records) $25,500 Public Records
Property tax history
-4.7%/yrLatest (2025): $782 · -52.4% YoY. Source: county tax records.
Cash-flow waterfall
monthlySold comps — $/sqft
last 12 mo · ≤1 miLoading sold comps…