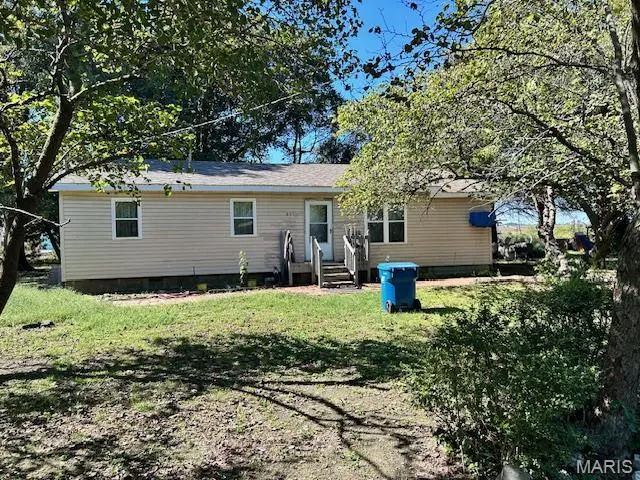
209 Kell Rd · Catron, MO
Flood risk 1/10 · Minimal
- FEMA flood zone
- —
- Chance of flooding over 30 yrs
- 0.0%
- Est. flood insurance / yr
- —
Fire risk 1/10 · Minimal
- Est. fire insurance / yr
- $1,054 – $1,958
Heat risk 5/10 · Moderate
- Hot days now (above 108°F)
- 7 days/yr
- Hot days in 30 yrs
- 21 days/yr
Wind risk 4/10 · Minor
- Chance of severe wind over 30 yrs
- 8.0%
Air-quality risk 1/10 · Minimal
- Unhealthy air days now
- 0 days/yr
- Unhealthy air days in 30 yrs
- 0 days/yr
Risk factors via First Street. Map © Google.
Why this score? — see what drove the D+ grade
The composite is a weighted blend of 9 inputs, each scored 0–100. Each bar is that input's sub-score; the figure is the points it added to the 100-point composite (weight × sub-score).
- Cash flow +15.0/30.0
- ARV discount +7.5/15.0
- 1% rule +5.0/10.0
- DSCR +5.0/10.0
- Appreciation +5.0/10.0
- Livability +2.6/5.0
- Rent growth +2.5/5.0
- Condition / age +2.5/5.0
- Schools +2.1/10.0
$20,000
🖨 Deal sheet 📄 Offer letter ✓ Due diligence
Listing remarks
Priced to sell. Schedule your viewing today. Investment property or primary home that needs some TLC.
Key facts
- 0.33 acre lot
- Built 1976
- Listed 42 days
Property features AI
Finance
- Other: Lot approximately 0.325 acre (dimensions: 80 x 120 + 50 x 70); Gravel road frontage on a city street; No pool
- Financial info: Lease not considered; No second mortgage indicated
Exterior
- Parking: Driveway
- Utilities: Community water; Septic tank sewer; Electricity available (220 volts)
- Home design: Single family residence; Residential property; Private ownership; One level; Fixer condition
- Construction: Concrete and vinyl siding construction; Asphalt shingle roof; Block foundation; Built/area information from appraiser
- Exterior features: Front porch; Back yard; Front yard; Outbuilding / shed(s)
Interior
- Kitchen: Kitchen facilities
- Bedrooms: 3 bedrooms (all on the main level)
- Flooring: Carpet; Vinyl
- Bathrooms: 1 full bathroom
- Heating & cooling: Forced air heating (natural gas); Central air; Electric cooling; Window unit(s)
- Interior features: Gas water heater
- Laundry & utility: Laundry located in the kitchen
Neighborhood map
What this means for you Summary
Snapshot
- This is a 3-bed/1.0-bath other listed at $20k.
Deal economics
- At list price, monthly cash flow is $611 ($7k/yr) — positive.
- The deal already cash-flows at list — no discount required.
- Meets the 1% rule at list price ($956 rent vs $20k).
- Recommended offer: $19k (3.0% below list) — sets the bar for market timing.
Location & tenants
- Location reads 51/100 on livability (#887 in MO) — a working-class tenant base; expect higher turnover. Strengths: cost of living A+, housing B; Watch: health & safety C-, crime F, amenities F.
- New Madrid County R-I (rural): math 20% / reading 31% proficiency, ranked #291 of 324 in MO (top 90%) — low school quality limits family demand, transient renter base, plan for 1-2y turnover; 63% free/reduced lunch — lower-income household profile, screen leases tightly.
- Zoned schools: New Madrid Elementary (math 37% / reading 32%, grade F, #676 of 1,115 statewide, top 66%, 280 students, 100% FRL); Central High School (math 2% / reading 32%, grade F, #483 of 521 statewide, top 93%, 400 students, 100% FRL) — zoned schools average 100% FRL vs 63% district-wide (37 pts higher); higher-poverty schools than district average — tighter screening recommended.
- Market conditions: 2 active listings in the ZIP; 11 units permitted in New Madrid County in 2024 (0 in 5+ unit buildings).
Forward outlook
- In year one you build about $738 of equity ($138 loan paydown + $600 appreciation (3.0% local appreciation)).
- New Madrid County population projected at -25% by 2050 — secular population decline; favor cash flow + early exit over multi-decade hold.
- At projected returns (3.0% appreciation + 3.0% rent growth), your $6k cash investment doubles in ~1 year — after that, you're playing with house money.
Negotiation context
- It's been on market 42 days — a 3% lower offer ($19k) is reasonable based on typical stale-listing flexibility.
- 2 sale attempts with the ask held roughly flat each time — persistent listings suggest the price (not the market) is what's stuck; bring a comps-based counter.
Risks & watch-outs
- Climate carrying-cost: extreme-heat days projected 7→21/yr by 2055 (HVAC capex compounding) — expect insurance premiums to compound above CPI over the hold.
Questions for the listing agent
- It's been on market 42 days. Have you received any prior offers? Is the seller open to a 3% concession, seller financing, or rate buy-down credit?
- Built in 1976 — when were the roof, HVAC, electrical panel, plumbing, and water heater last replaced?
- Is there a deadline driving the sale (1031 exchange, divorce, estate, relocation)? That informs how much negotiation room exists.
- Schools are F-rated, which usually means shorter tenancies and higher turnover. Who's the typical renter profile here, and what's been the actual vacancy rate?
- Crime grade is F in this area — have there been break-ins, vandalism, or insurance claims at this property in the last 3 years? What carrier currently insures it and at what premium?
- The area grade is low — what's the realistic commute time and amenity access for the typical tenant pool here? Any planned neighborhood developments (good or bad) we should know about?
- What's the average days-on-market for RENTAL listings here right now (not sales)? A rising rental-DOM trend means longer vacancies and softer asking-rent achievability than the comps imply.
- What's the recent tenant-quality profile in this submarket — average credit score on applications, eviction rate, late-payment / NSF rate, and stable-employment percentage? A property-management company in the area should have these aggregated.
- How much new for-sale + rental construction is in the pipeline within 1–3 miles? Heavy new supply typically softens prices + rents 12–24 months out; constrained supply supports both.
Investment metrics
- 1% rule
- 4.78% ✓
- Cap rate
- 42.95%
- Cash-on-cash
- 130.91%
- DSCR
- 6.82
- GRM
- 1.7
CMA / ARV
No comps found within radius.
Projected returns pro-forma
3.0% appreciation · 3.0% rent growth · sell at horizon
- IRR
- —
- Equity multiple
- 8.38×
- Total profit
- $41,336
- Equity at exit
- $8,993
- IRR
- —
- Equity multiple
- 17.54×
- Total profit
- $92,652
- Equity at exit
- $13,859
Cash invested: $5,600 (down + closing). Projections, not guarantees.
Landlord ↔ Tenant lean methodology
- Overall (STATE)
- 81 Strongly Landlord-Friendly
- State Missouri
- 81 Strongly Landlord-Friendly · R+10
- County
- — inherits STATE
- City
- — inherits STATE
ZIP-level market 63833
- Active inventory
- 2
- Price-to-rent
- 1.7×
Monthly cashflow live
- Estimated rent
- $956 medium interval (Pro) →
- Mortgage (P&I)
- −$105
- Tax from tax record
- −$31 /mo · $378/yr
- Insurance
- −$8
- HOA
- −$0
- Vacancy / Maint / Mgmt
- −$201
- Net cashflow
- $611
Break-even live
UW: 25.0% down · 7.5% · 30yr · 1.5% tax · 5.0% vac · 8.0% maint · 8.0% mgmt
Financing live
Cash to close
- Down payment
- $5,000
- Closing costs
- $600
- Reserves months
- —
- Total cash needed
- —
Loan-product check · same deal, 3 products live
Conventional
25% down · 7.5% · 30yr
- Down + closing
- —
- Monthly P&I
- —
- Monthly cashflow
- —
- DSCR
- —
- Eligible?
- —
Personal DTI + credit; lowest rate.
DSCR
20% down · 8.5% · 30yr
- Down + closing
- —
- Monthly P&I
- —
- Monthly cashflow
- —
- DSCR
- —
- Eligible?
- —
No personal income docs; deal must DSCR.
Hard money
10% down · 12.0% · 12mo
- Down + closing
- —
- Monthly P&I
- —
- Monthly cashflow
- —
- DSCR
- —
- Eligible?
- —
Short-term bridge; refi at stabilization.
Listing history 12 events
-
2026-06-09status $20,000 Pending 42 DOM
-
2026-06-08days on market $20,000 Active 42 DOM
-
2026-06-07days on market $20,000 Active 41 DOM
-
2026-06-07days on market $20,000 Active 40 DOM
-
2026-06-04days on market $20,000 Active 37 DOM
-
2026-06-02days on market $20,000 Active 36 DOM
-
2026-06-01days on market $20,000 Active 35 DOM
-
2026-05-31days on market $20,000 Active 34 DOM
-
2026-04-27$20,000 Active 103-char remark
-
2025-12-18price $25,000
-
2025-11-17price $29,000
-
2025-10-13$32,000 Active
ⓘ Source: listings_history table (triggers on properties + properties_extension) + one-shot
backfill from property_details.listing_events for pre-trigger history.
Tax reassessment forecast MO · Resets to sale price
- Current annual tax
- $378 · $31/mo
- Projected year-2 tax
- $378 · $31/mo
- Expected delta
- $0/yr ($0/mo · 0.0%)
ⓘ Screening estimate from a state-policy table — verify with the county assessor before closing.
Climate risk First Street
- Flood 1/10 Low 0% chance over 30 yrs
- Wildfire 1/10 Low
- Heat 5/10 Major 7 d/yr ≥108°F today · 21 d/yr by 30 yrs out
- Wind 4/10 Moderate 8% chance of damaging wind over 30 yrs
- Air quality 1/10 Low 0 unhealthy d/yr today · 0 by 30 yrs out
Nearby sold comps map
Loading sold comps map…
Walkable amenities ~0.75 mi
Loading nearby amenities…
Taxation est. · year 1
- Rental income
- $11,477
- − Mortgage interest
- −$1,120
- − Property taxes
- −$378
- − Insurance
- −$100
- − Repairs & maintenance
- −$918
- − Management
- −$918
- − Depreciation
- −$582
- Taxable income
- $7,461
- Est. tax owed @ 24.0%
- −$1,791
- After-tax cash flow
- $5,540/yr
For passive investors: Depreciation is non-cash, so a rental often shows a tax loss while cash-flowing — sheltering income. Rental losses are passive: they offset passive income freely, and up to $25,000/yr can offset ordinary (W-2) income if you actively participate and your MAGI is under $100k (phasing out to $0 by $150k); unused losses carry forward. On sale, claimed depreciation is recaptured at up to 25%, and gains may owe capital-gains tax (a 1031 exchange can defer both). Figures are a year-1 estimate at your 24.0% rate — not tax advice; consult a CPA.
Schools (NCES district)
- District
- New Madrid County R-I
- NCES district ID
- 2900004
- Math proficiency
- 20% ▼ -10.00%
- Reading proficiency
- 31% ▼ -7.00%
- Median HH income
- $31,286
- Composite
- 20.64/100
- National rank
- #8543
- State rank
- #291 of 324 in MO
Livability — Catron
- Score
- 51/100
- State rank
- #887
- US rank
- #25406
Category grades
Schools grade is shown separately in the Schools card above.
Census & demographics
- Census place
- Catron, MO
- Population (ZIP)
- 147
Population outlook (New Madrid County) Hauer SSP2
- Today (2025)
- 16,712 people
- By 2030
- 15,845 · -5.2%
- By 2040
- 14,152 · -15.3%
- By 2050
- 12,604 · -24.6%
- By 2075
- 9,478 · -43.3%
- By 2100
- 7,157 · -57.2%
Race, ethnicity, and origin ACS 2023
- Neighborhood character
- Predominantly White (99%)
- Race & ethnicity
- White 99%
- Common ancestry
- Slovak 6% Iranian 5% Italian 2%
Political lean MEDSL · New Madrid
- 2024 margin
- Solid R (+53.5) · D 22.9% · R 76.4%
- 2008→2024 swing
- -38.4pp toward R · 2008: -15.1pp · 2024: -53.5pp
- All cycles
- 2024: R+53.5 2020: R+51.0 2016: R+45.4 2012: R+20.3 2008: R+15.1
Not yet ingested
- Civics
- —
Market trends
- HPI YoY
- —
- Current HPI
- —
- Rent YoY
- —
- Metro
- —
- State GDP YoY
- ▲ 1.84%
- F500 in state
- 20
Industry mix (Fortune 500 HQ in MO)
| Industry | F500 HQs | Revenue |
|---|---|---|
| Healthcare | 1 | $163B |
|
||
| Insurance | 1 | $21B |
|
||
| Industrial Technology | 1 | $17B |
|
||
| Retail | 1 | $16B |
|
||
| Industrial Distribution | 1 | $10B |
|
||
| Utilities | 1 | $9B |
|
||
Price history
-37.5% since first listed5 events — show timeline
- 2026-06-08 Pending — MARIS as Distributed by MLS Grid
- 2026-04-27 Listed $20,000 MARIS as Distributed by MLS Grid
- 2025-12-18 Price Changed $25,000 MARIS as Distributed by MLS Grid
- 2025-11-17 Price Changed $29,000 MARIS as Distributed by MLS Grid
- 2025-10-13 Listed $32,000 MARIS as Distributed by MLS Grid
Property tax history
+3.8%/yrLatest (2025): $378 · +8.9% YoY. Source: county tax records.
Cash-flow waterfall
monthlySold comps — $/sqft
last 12 mo · ≤1 miLoading sold comps…