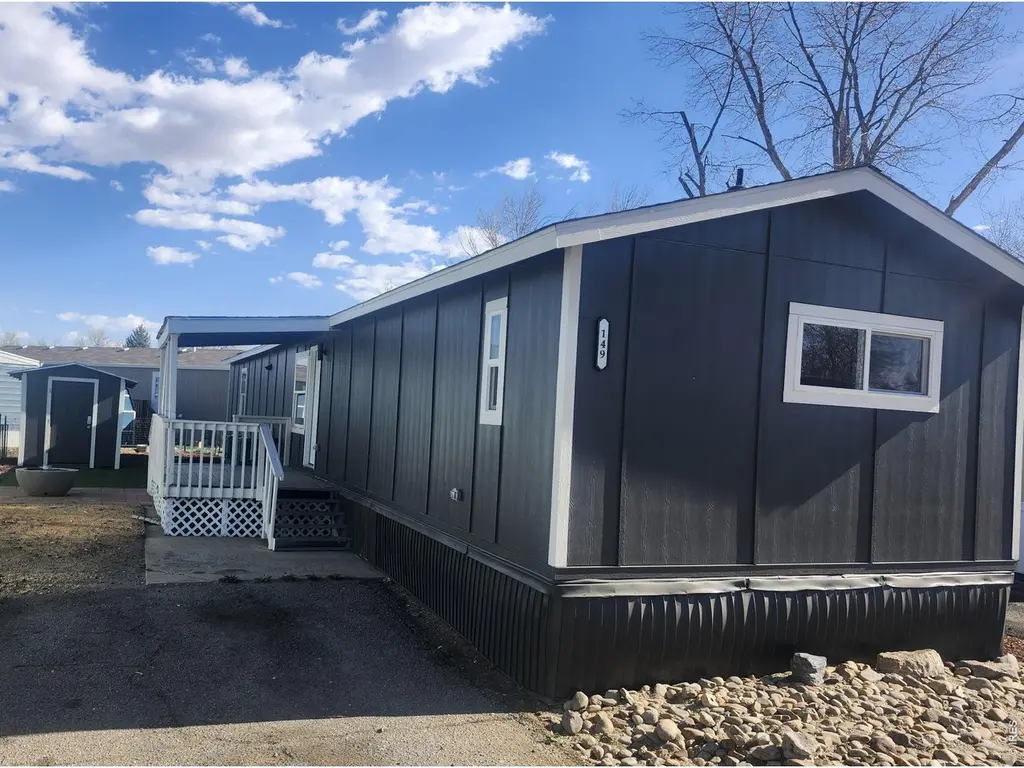
10910 Turner Blvd #149 · Frederick, CO
Flood risk 1/10 · Minimal
- FEMA flood zone
- X (unshaded)
- Chance of flooding over 30 yrs
- 0.0%
- Est. flood insurance / yr
- $507 – $1,088
Fire risk 5/10 · Moderate
- Est. fire insurance / yr
- $939 – $1,743
Heat risk 3/10 · Minor
- Hot days now (above 93°F)
- 7 days/yr
- Hot days in 30 yrs
- 18 days/yr
Wind risk 2/10 · Minimal
- Chance of severe wind over 30 yrs
- —
Air-quality risk 5/10 · Moderate
- Unhealthy air days now
- 8 days/yr
- Unhealthy air days in 30 yrs
- 8 days/yr
Risk factors via First Street. Map © Google.
Why this score? — see what drove the C+ grade
The composite is a weighted blend of 9 inputs, each scored 0–100. Each bar is that input's sub-score; the figure is the points it added to the 100-point composite (weight × sub-score).
- Cash flow +30.0/30.0
- 1% rule +10.0/10.0
- DSCR +10.0/10.0
- Schools +3.8/10.0
- Livability +3.2/5.0
- Condition / age +2.5/5.0
- Rent growth +1.9/5.0
- ARV discount +0.0/15.0
- Appreciation +0.0/10.0
$104,900
🖨 Deal sheet 📄 Offer letter ✓ Due diligence
Listing remarks
A complete top to bottom remodel! New roof, windows, siding, drywall, electric, plumbing, drywall, flooring, kitchen, baths. There is nothing in this home that has not been touched by the justs completed rebuild! This beautifully maintained 3-bedroom, 2-bath home combines comfort, space, and convenience in one perfect package. Step inside to an inviting open floor plan where the living room, dining area, and kitchen flow seamlessly together, making it ideal for entertaining or simply relaxing at the end of the day. Enjoy cooking in your gleaming brand new kitchen with quartz counters, new ugpraded cabinetry. You'll fall in love with the massive primary suite, a true retreat that easily fits
Key facts
- New plumbing
- New siding
- New flooring
Tags
Property features AI
Finance
- Other: Minimal flood or C floodplain rating
- HOA & community: No association fees or transfer fees
Exterior
- Parking: No garage; No designated parking features
- Utilities: Other water source (meter installed); Sewer: other; Natural gas available; Electricity available
- Home design: Manufactured in park (mobile home); Located on a cul-de-sac; Paved and asphalt road access; Private road to county standards
- Construction: Built with other/varied materials; Composition roof
- Exterior features: Patio; Deck; Partial fencing; Storage structure
Interior
- Kitchen: Electric range; Dishwasher; Refrigerator
- Bedrooms: 3 bedrooms
- Bathrooms: 2 full bathrooms
- Heating & cooling: Forced air heating
- Interior features: Eat-in kitchen; Separate dining room; Electric fireplace
Neighborhood map
What this means for you Summary
Snapshot
- This is a 3-bed/2.0-bath manufactured listed at $105k.
Deal economics
- At list price, monthly cash flow is $1k ($15k/yr) — positive.
- The deal already cash-flows at list — no discount required.
- Meets the 1% rule at list price ($2k rent vs $105k).
- Recommended offer: $99k (6.0% below list) — sets the bar for market timing.
- Cap rate 20.6% vs local median 3.9% in Frederick — top-decile yield for the area; either an underpriced asset or a hidden risk that comps aren't pricing in. Stress-test before assuming the spread holds.
Location & tenants
- Location reads 64/100 on livability (#175 in CO) — a middle-class / working-renter tenant base. Strengths: crime A+, employment A+, housing A+; Watch: amenities F, commute F, cost of living F.
- St. Vrain Valley School District No. Re1J (suburban): math 32% / reading 51% proficiency, ranked #23 of 86 in CO (top 27%) — families likely to look elsewhere, expect single-tenant / working-renter base with shorter leases.
- Zoned schools: Grand View Elementary (math 15% / reading 37%, grade F, #581 of 966 statewide, top 61%, 444 students, 27% FRL); Mead High School (math 34% / reading 59%, grade D-, #137 of 381 statewide, top 36%, 1,119 students, 25% FRL) — zoned schools at 26% FRL track the district average.
- Market conditions: Rents soft (-2.3%/yr); 534 active listings in the ZIP; 4 comparable units currently listed for rent nearby; rentals at typical pace (median 21d on market — plan ~3-4 weeks tenant-placement turnaround); high-income renter base; 3,170 units permitted in Weld County in 2024 (278 in 5+ unit buildings).
Forward outlook
- Local home prices are declining (-3.0%/yr); year-one equity from $725 of loan paydown is wiped out by about $3k of value loss. Plan a longer hold.
- Weld County population projected at +46% by 2050 — long-run rental-demand tailwind backs the buy-and-hold thesis.
- At projected returns (-3.0% appreciation + 0.0% rent growth), your $29k cash investment doubles in ~3 years — after that, you're playing with house money.
Negotiation context
- It's been on market 83 days — a 6% lower offer ($99k) is reasonable based on typical stale-listing flexibility.
- Current owner paid $18k; list at $105k implies a 499% gain — meaningful room to come down on a strong offer.
Risks & watch-outs
- Climate carrying-cost: moderate wildfire risk — expect insurance premiums to compound above CPI over the hold.
Questions for the listing agent
- It's been on market 83 days. Have you received any prior offers? Is the seller open to a 6% concession, seller financing, or rate buy-down credit?
- Why hasn't it sold? Are there any deal-killer items the seller is aware of (foundation, flood, title, zoning, code violations)?
- Is there a deadline driving the sale (1031 exchange, divorce, estate, relocation)? That informs how much negotiation room exists.
- What's the average days-on-market for RENTAL listings here right now (not sales)? A rising rental-DOM trend means longer vacancies and softer asking-rent achievability than the comps imply.
- What's the recent tenant-quality profile in this submarket — average credit score on applications, eviction rate, late-payment / NSF rate, and stable-employment percentage? A property-management company in the area should have these aggregated.
- How much new for-sale + rental construction is in the pipeline within 1–3 miles? Heavy new supply typically softens prices + rents 12–24 months out; constrained supply supports both.
Investment metrics
- 1% rule
- 2.26% ✓
- Cap rate
- 20.56%
- Cash-on-cash
- 50.97%
- DSCR
- 3.27
- GRM
- 3.7
CMA / ARV
- ARV (on-the-fly)
- $70,528
- Comps found
- 3
Show comp detail 3 sales within ~0.75 mi
| Address | Dist | Beds/Ba | Sqft | Sold | Price | $/sf | Match |
|---|---|---|---|---|---|---|---|
| 10910 Turner Blvd #133 | 0.04mi | 3/2.0 | 1,216 (0%) | 6mo | $70,000 | $58 | 94 |
| 10910 Turner Blvd #86 | 0.11mi | 2/2.0 (-1) | 1,280 (+5%) | 10mo | $69,000 | $54 | 73 |
| 10910 Turne Blvd | 0.10mi | 3/2.0 | 1,280 (+5%) | 24mo | $98,000 | $77 | 67 |
Match score weights: distance 35% · size 25% · config 20% · recency 20%. Top-matched comps best support the ARV.
Projected returns pro-forma
-3.0% appreciation · 0.0% rent growth · sell at horizon
- IRR
- 45.5%
- Equity multiple
- 2.89×
- Total profit
- $55,482
- Equity at exit
- $15,641
- IRR
- 50.1%
- Equity multiple
- 5.21×
- Total profit
- $123,674
- Equity at exit
- $9,070
Cash invested: $29,372 (down + closing). Projections, not guarantees.
Landlord ↔ Tenant lean methodology
- Overall (STATE)
- 38 Tenant-Leaning
- State Colorado
- 38 Tenant-Leaning · D+4
- County
- — inherits STATE
- City
- — inherits STATE
ZIP-level market 80504
- Rents YoY
- -2.3%
- Active inventory
- 534
- Price-to-rent
- 3.7×
Monthly cashflow live
- Estimated rent
- $2,370 medium interval (Pro) →
- Mortgage (P&I)
- −$550
- Tax from tax record
- −$31 /mo · $372/yr
- Insurance
- −$44
- HOA
- −$0
- Vacancy / Maint / Mgmt
- −$498
- Net cashflow
- $1,247
Break-even live
UW: 25.0% down · 7.5% · 30yr · 1.5% tax · 5.0% vac · 8.0% maint · 8.0% mgmt
Financing live
Cash to close
- Down payment
- $26,225
- Closing costs
- $3,147
- Reserves months
- —
- Total cash needed
- —
Loan-product check · same deal, 3 products live
Conventional
25% down · 7.5% · 30yr
- Down + closing
- —
- Monthly P&I
- —
- Monthly cashflow
- —
- DSCR
- —
- Eligible?
- —
Personal DTI + credit; lowest rate.
DSCR
20% down · 8.5% · 30yr
- Down + closing
- —
- Monthly P&I
- —
- Monthly cashflow
- —
- DSCR
- —
- Eligible?
- —
No personal income docs; deal must DSCR.
Hard money
10% down · 12.0% · 12mo
- Down + closing
- —
- Monthly P&I
- —
- Monthly cashflow
- —
- DSCR
- —
- Eligible?
- —
Short-term bridge; refi at stabilization.
Rent comps 4 comps
| Address | Beds | Baths | Sqft | Rent | $/sqft | DOM | Units | Dist |
|---|---|---|---|---|---|---|---|---|
| 10910 Turner Blvd #70 Longmont, CO | 3.0 | 2.0 | 1152 | $1,999 | $1.74 | 21d | 1 | 0.15mi |
| 10426 Durango Pl Longmont, CO | 3.0 | 2.0 | 1500 | $2,350 | $1.57 | 21d | 1 | 0.17mi |
| 10692 Durango Pl Longmont, CO | 3.0 | 2.0 | 1500 | $2,395 | $1.60 | 21d | 1 | 0.18mi |
| 10670 Jake Jabs Blvd Firestone, CO | 1.0–3.0 | 1.0–2.0 | 1036 | $2,595 | $2.50 | 13d | 26 | 0.68mi |
Listing history 16 events
-
2026-06-18days on market $104,900 Active 83 DOM
-
2026-06-17days on market $104,900 Active 82 DOM
-
2026-06-16days on market $104,900 Active 81 DOM
-
2026-06-15days on market $104,900 Active 80 DOM
-
2026-06-14days on market $104,900 Active 78 DOM
-
2026-06-13days on market $104,900 Active 77 DOM
-
2026-06-09days on market $104,900 Active 74 DOM
-
2026-06-09days on market $104,900 Active 73 DOM
-
2026-06-07pricedays on market $104,900 Active 72 DOM
-
2026-06-02days on market $114,900 Active 67 DOM
-
2026-06-01days on market $114,900 Active 66 DOM
-
2026-05-31days on market $114,900 Active 65 DOM
-
2026-05-30days on market $114,900 Active 64 DOM
-
2026-04-03price $114,900
-
2026-03-27$124,900 Active
-
2011-03-11soldstatus $17,500
ⓘ Source: listings_history table (triggers on properties + properties_extension) + one-shot
backfill from property_details.listing_events for pre-trigger history.
Tax reassessment forecast CO · Resets to sale price
- Current annual tax
- $372 · $31/mo
- Projected year-2 tax
- $577 · $48/mo
- Expected delta
- +$205/yr (+$17/mo · 55.3%)
ⓘ Screening estimate from a state-policy table — verify with the county assessor before closing.
Climate risk First Street
- Flood 1/10 Low FEMA zone X (unshaded) · 0% chance over 30 yrs
- Wildfire 5/10 Major
- Heat 3/10 Moderate 7 d/yr ≥93°F today · 18 d/yr by 30 yrs out
- Wind 2/10 Low
- Air quality 5/10 Major 8 unhealthy d/yr today · 8 by 30 yrs out
Nearby sold comps map
Loading sold comps map…
Walkable amenities ~0.75 mi
Loading nearby amenities…
Taxation est. · year 1
- Rental income
- $28,439
- − Mortgage interest
- −$5,876
- − Property taxes
- −$372
- − Insurance
- −$524
- − Repairs & maintenance
- −$2,275
- − Management
- −$2,275
- − Depreciation
- −$3,052
- Taxable income
- $14,065
- Est. tax owed @ 24.0%
- −$3,376
- After-tax cash flow
- $11,594/yr
For passive investors: Depreciation is non-cash, so a rental often shows a tax loss while cash-flowing — sheltering income. Rental losses are passive: they offset passive income freely, and up to $25,000/yr can offset ordinary (W-2) income if you actively participate and your MAGI is under $100k (phasing out to $0 by $150k); unused losses carry forward. On sale, claimed depreciation is recaptured at up to 25%, and gains may owe capital-gains tax (a 1031 exchange can defer both). Figures are a year-1 estimate at your 24.0% rate — not tax advice; consult a CPA.
Schools (NCES district)
- District
- St. Vrain Valley School District No. Re1J
- NCES district ID
- 0805370
- Math proficiency
- 32% ▼ -8.00%
- Reading proficiency
- 51% ▬ 0.00%
- Median HH income
- $71,571
- Composite
- 37.73/100
- National rank
- #4353
- State rank
- #23 of 86 in CO
Livability — Frederick
- Score
- 64/100
- State rank
- #175
- US rank
- #14276
Category grades
Schools grade is shown separately in the Schools card above.
Census & demographics
- County
- Weld County · 332,652 people
- City population
- 6,242
- Metro
- Greeley, CO
- Population (ZIP)
- 63,451
- Household income
- $113,643
- Rent vs Own
- Severe rent burden
- 1028.0
Population outlook (Weld County) Hauer SSP2
- Today (2025)
- 351,957 people
- By 2030
- 385,304 · +9.5%
- By 2040
- 451,818 · +28.4%
- By 2050
- 514,478 · +46.2%
- By 2075
- 648,733 · +84.3%
- By 2100
- 720,400 · +104.7%
Race, ethnicity, and origin ACS 2023
- Neighborhood character
- Predominantly White (68%)
- Race & ethnicity
- White 68% Hispanic / Latino 24% Two or more races 13% Asian 3%
- Hispanic origin (detail)
- Mexican 18%
- Common ancestry
- Lithuanian 3% Italian 2% Iranian 2%
- Foreign-born
- 8% · Canada, Vietnam
- Languages at home
- 84% English-only · Spanish 13% Other Asian/Pacific 1%
Political lean MEDSL · Weld
- 2024 margin
- Strong R (+21.0) · D 38.2% · R 59.2% · Other 2.6%
- 2008→2024 swing
- -12.2pp toward R · 2008: -8.7pp · 2024: -21.0pp
- All cycles
- 2024: R+21.0 2020: R+18.0 2016: R+22.4 2012: R+13.2 2008: R+8.7
Not yet ingested
- Civics
- —
Market trends
- HPI YoY
- ▼ -534.45%
- Current HPI
- 245.1351
- Rent YoY
- ▼ -2.34%
- Metro
- Greeley, CO
- State GDP YoY
- ▲ 1.95%
- F500 in state
- 14
Industry mix (Fortune 500 HQ in CO)
| Industry | F500 HQs | Revenue |
|---|---|---|
| Technology Distribution | 1 | $31B |
|
||
| Food / Agriculture | 1 | $18B |
|
||
| Packaging | 1 | $14B |
|
||
| Healthcare | 1 | $13B |
|
||
| Energy | 1 | $10B |
|
||
| Technology | 1 | $4B |
|
||
Price history
+556.6% since first listed3 events — show timeline
- 2026-04-03 Price Changed $114,900 IRES
- 2026-03-27 Listed $124,900 IRES
- 2011-03-11 Sold (Public Records) $17,500 Public Records
Property tax history
+9.4%/yrLatest (2025): $372 · +156.9% YoY. Source: county tax records.
Cash-flow waterfall
monthlySold comps — $/sqft
last 12 mo · ≤1 miLoading sold comps…