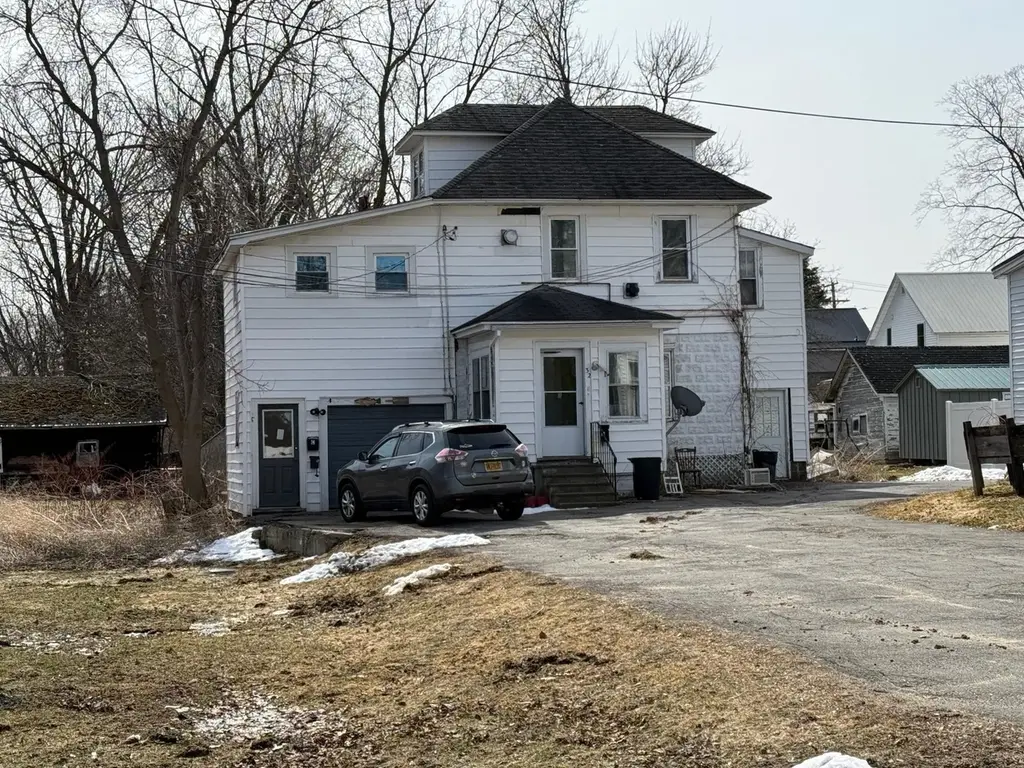
30,32 Ridgewood Ave · Massena, NY
Flood risk 1/10 · Minimal
- FEMA flood zone
- X
- Chance of flooding over 30 yrs
- 0.0%
- Est. flood insurance / yr
- $473 – $860
Fire risk 3/10 · Minor
- Est. fire insurance / yr
- $691 – $1,283
Heat risk 2/10 · Minimal
- Hot days now (above 93°F)
- 7 days/yr
- Hot days in 30 yrs
- 15 days/yr
Wind risk 1/10 · Minimal
- Chance of severe wind over 30 yrs
- —
Air-quality risk 2/10 · Minimal
- Unhealthy air days now
- 1 days/yr
- Unhealthy air days in 30 yrs
- 1 days/yr
Risk factors via First Street. Map © Google.
Why this score? — see what drove the D- grade
The composite is a weighted blend of 9 inputs, each scored 0–100. Each bar is that input's sub-score; the figure is the points it added to the 100-point composite (weight × sub-score).
- Cash flow +12.1/30.0
- ARV discount +6.1/15.0
- Schools +3.9/10.0
- Livability +3.7/5.0
- DSCR +3.6/10.0
- 1% rule +3.2/10.0
- Rent growth +2.5/5.0
- Condition / age +2.5/5.0
- Appreciation +0.0/10.0
$119,900
🖨 Deal sheet 📄 Offer letter ✓ Due diligence
Listing remarks MLS
Multi-family compound. .. This rental opportunity is a great investment. There are two buildings included with this package deal. Two parcels, one in front of the other. One 3-unit building and one single family home. Combined they make an excellent money maker.
Key facts
- 3-unit building
- Two parcels
- Two buildings
Tags
Neighborhood map
What this means for you Summary
Snapshot
- This is a 2-bed/2.0-bath single-family listed at $120k.
Deal economics
- At list price, monthly cash flow is $-25 ($-305/yr) — negative.
- To cash-flow at today's rent, offer at most $115k (3.7% below list).
- To meet the 1% rule (rent ≥ 1% of price), the offer needs to be $99k (17.7% below list).
- Recommended offer: $99k (17.7% below list) — sets the bar for 1% rule.
Location & tenants
- Location reads 73/100 on livability (#330 in NY) — a middle-class / working-renter tenant base. Strengths: cost of living A+, housing A+, health & safety A+; Watch: amenities D, crime D-, commute F.
- Massena Central School District (town): math 43% / reading 49% proficiency, ranked #456 of 590 in NY (top 77%) — families likely to look elsewhere, expect single-tenant / working-renter base with shorter leases.
- Market conditions: 171 active listings in the ZIP; 215 units permitted in St. Lawrence County in 2024 (0 in 5+ unit buildings).
Forward outlook
- Local home prices are declining (-3.0%/yr); year-one equity from $829 of loan paydown is wiped out by about $4k of value loss. Plan a longer hold.
- St. Lawrence County population projected at -14% by 2050 — secular population decline; favor cash flow + early exit over multi-decade hold.
Negotiation context
- It's been on market 417 days — a 12% lower offer ($106k) is reasonable based on typical stale-listing flexibility.
- 2 sale attempts; this cycle's ask has dropped $30k (20%) from the opening price — seller is motivated, your offer sets the floor, not the list.
Risks & watch-outs
- Watch-outs: built in 1945 — expect roof / HVAC / electrical / plumbing capex.
Questions for the listing agent
- What do current leases actually rent for vs. the listed asking? Can we see a recent rent roll and the last 12 months of T-12 income?
- It's been on market 417 days. Have you received any prior offers? Is the seller open to a 18% concession, seller financing, or rate buy-down credit?
- Built in 1945 — when were the roof, HVAC, electrical panel, plumbing, and water heater last replaced?
- Why hasn't it sold? Are there any deal-killer items the seller is aware of (foundation, flood, title, zoning, code violations)?
- Is there a deadline driving the sale (1031 exchange, divorce, estate, relocation)? That informs how much negotiation room exists.
- Crime grade is D in this area — have there been break-ins, vandalism, or insurance claims at this property in the last 3 years? What carrier currently insures it and at what premium?
- The area grade is low — what's the realistic commute time and amenity access for the typical tenant pool here? Any planned neighborhood developments (good or bad) we should know about?
- What's the average days-on-market for RENTAL listings here right now (not sales)? A rising rental-DOM trend means longer vacancies and softer asking-rent achievability than the comps imply.
- What's the recent tenant-quality profile in this submarket — average credit score on applications, eviction rate, late-payment / NSF rate, and stable-employment percentage? A property-management company in the area should have these aggregated.
- How much new for-sale + rental construction is in the pipeline within 1–3 miles? Heavy new supply typically softens prices + rents 12–24 months out; constrained supply supports both.
Investment metrics
- 1% rule
- 0.82% ✗
- Cap rate
- 6.04%
- Cash-on-cash
- -0.91%
- DSCR
- 0.96
- GRM
- 10.1
CMA / ARV
- ARV (median comp)
- $116,170
- List price
- $119,900
- Delta
- 3.21%
- Verdict
- FAIR
- Comps
- 20 within 1.0 mi
Show comp detail 12 sales within ~0.75 mi
| Address | Dist | Beds/Ba | Sqft | Sold | Price | $/sf | Match |
|---|---|---|---|---|---|---|---|
| 7 Douglas Rd | 0.10mi | 2/1.0 | 1,006 (+5%) | 6mo | $82,500 | $82 | 78 |
| 13 Douglas Rd | 0.08mi | 2/1.0 | 1,001 (+4%) | 15mo | $82,500 | $82 | 73 |
| 21 Talcott St | 0.33mi | 2/1.0 | 909 (-5%) | 8mo | $97,850 | $108 | 65 |
| 14 Talcott St | 0.31mi | 2/1.0 | 993 (+3%) | 14mo | $33,000 | $33 | 64 |
| 14 Howard St | 0.25mi | 3/1.0 (+1) | 1,050 (+9%) | 3mo | $46,000 | $44 | 61 |
| 10 Tracy St | 0.53mi | 2/1.0 | 910 (-5%) | 2mo | $64,900 | $71 | 61 |
| 5 Mccluskey Ave | 0.57mi | 2/2.0 | 960 (0%) | 19mo | $88,510 | $92 | 58 |
| 75 Grove St | 0.21mi | 3/1.0 (+1) | 1,000 (+4%) | 21mo | $80,000 | $80 | 57 |
| 57 Clarkson Ave | 0.74mi | 2/1.5 | 1,000 (+4%) | 9mo | $90,000 | $90 | 50 |
| 89 Nightengale Ave | 0.68mi | 3/1.0 (+1) | 950 (-1%) | 10mo | $72,500 | $76 | 49 |
| 7 Alden St | 0.57mi | 3/1.0 (+1) | 1,100 (+15%) | 2mo | $54,000 | $49 | 38 |
| 39 Amherst Rd | 0.72mi | 3/1.0 (+1) | 862 (-10%) | 4mo | $80,000 | $93 | 37 |
Match score weights: distance 35% · size 25% · config 20% · recency 20%. Top-matched comps best support the ARV.
Projected returns pro-forma
-3.0% appreciation · 3.0% rent growth · sell at horizon
- IRR
- -17.8%
- Equity multiple
- 0.37×
- Total profit
- $-21,049
- Equity at exit
- $17,877
- IRR
- -9.9%
- Equity multiple
- 0.39×
- Total profit
- $-20,415
- Equity at exit
- $10,367
Cash invested: $33,572 (down + closing). Projections, not guarantees.
Landlord ↔ Tenant lean methodology
- Overall (STATE)
- 15 Strongly Tenant-Friendly
- State New York
- 15 Strongly Tenant-Friendly · D+10
- County
- — inherits STATE
- City
- — inherits STATE
ZIP-level market 13662
- Home prices YoY
- -6.4%
- Active inventory
- 171
- Price-to-rent
- 10.1×
Monthly cashflow live
- Estimated rent
- $986 medium interval (Pro) →
- Mortgage (P&I)
- −$629
- Tax from tax record
- −$126 /mo · $1,510/yr
- Insurance
- −$50
- HOA
- −$0
- Vacancy / Maint / Mgmt
- −$207
- Net cashflow
- $-25
Break-even live
UW: 25.0% down · 7.5% · 30yr · 1.5% tax · 5.0% vac · 8.0% maint · 8.0% mgmt
Financing live
Cash to close
- Down payment
- $29,975
- Closing costs
- $3,597
- Reserves months
- —
- Total cash needed
- —
Loan-product check · same deal, 3 products live
Conventional
25% down · 7.5% · 30yr
- Down + closing
- —
- Monthly P&I
- —
- Monthly cashflow
- —
- DSCR
- —
- Eligible?
- —
Personal DTI + credit; lowest rate.
DSCR
20% down · 8.5% · 30yr
- Down + closing
- —
- Monthly P&I
- —
- Monthly cashflow
- —
- DSCR
- —
- Eligible?
- —
No personal income docs; deal must DSCR.
Hard money
10% down · 12.0% · 12mo
- Down + closing
- —
- Monthly P&I
- —
- Monthly cashflow
- —
- DSCR
- —
- Eligible?
- —
Short-term bridge; refi at stabilization.
Listing history 17 events
-
2026-06-18days on market $119,900 Active 417 DOM
-
2026-06-17days on market $119,900 Active 416 DOM
-
2026-06-16days on market $119,900 Active 415 DOM
-
2026-06-15days on market $119,900 Active 414 DOM
-
2026-06-13days on market $119,900 Active 412 DOM
-
2026-06-12days on market $119,900 Active 411 DOM
-
2026-06-09days on market $119,900 Active 408 DOM
-
2026-06-08days on market $119,900 Active 407 DOM
-
2026-06-07days on market $119,900 Active 406 DOM
-
2026-06-04days on market $119,900 Active 402 DOM
-
2026-06-02days on market $119,900 Active 401 DOM
-
2026-06-01days on market $119,900 Active 400 DOM
-
2026-05-31days on market $119,900 Active 399 DOM
-
2026-04-27price $119,900 262-char remark
Show marketing remark (262 chars)
Multi-family compound. .. This rental opportunity is a great investment. There are two buildings included with this package deal. Two parcels, one in front of the other. One 3-unit building and one single family home. Combined they make an excellent money maker.
-
2026-04-27status Active 262-char remark
Show marketing remark (262 chars)
Multi-family compound. .. This rental opportunity is a great investment. There are two buildings included with this package deal. Two parcels, one in front of the other. One 3-unit building and one single family home. Combined they make an excellent money maker.
-
2025-06-05price $139,900 262-char remark
Show marketing remark (262 chars)
Multi-family compound. .. This rental opportunity is a great investment. There are two buildings included with this package deal. Two parcels, one in front of the other. One 3-unit building and one single family home. Combined they make an excellent money maker.
-
2025-04-01$149,900 Active 262-char remark
Show marketing remark (262 chars)
Multi-family compound. .. This rental opportunity is a great investment. There are two buildings included with this package deal. Two parcels, one in front of the other. One 3-unit building and one single family home. Combined they make an excellent money maker.
ⓘ Source: listings_history table (triggers on properties + properties_extension) + one-shot
backfill from property_details.listing_events for pre-trigger history.
Tax reassessment forecast NY · Partial reset (capped growth)
- Current annual tax
- $1,510 · $126/mo
- Projected year-2 tax
- $1,768 · $147/mo
- Expected delta
- +$258/yr (+$22/mo · 17.1%)
ⓘ Screening estimate from a state-policy table — verify with the county assessor before closing.
Climate risk First Street
- Flood 1/10 Low FEMA zone X · 0% chance over 30 yrs
- Wildfire 3/10 Moderate
- Heat 2/10 Low 7 d/yr ≥93°F today · 15 d/yr by 30 yrs out
- Wind 1/10 Low
- Air quality 2/10 Low 1 unhealthy d/yr today · 1 by 30 yrs out
Nearby sold comps map
Loading sold comps map…
Walkable amenities ~0.75 mi
Loading nearby amenities…
Taxation est. · year 1
- Rental income
- $11,835
- − Mortgage interest
- −$6,716
- − Property taxes
- −$1,510
- − Insurance
- −$600
- − Repairs & maintenance
- −$947
- − Management
- −$947
- − Depreciation
- −$3,488
- Taxable loss
- −$2,373
- Est. tax savings @ 24.0%
- +$569
- After-tax cash flow
- $264/yr
For passive investors: Depreciation is non-cash, so a rental often shows a tax loss while cash-flowing — sheltering income. Rental losses are passive: they offset passive income freely, and up to $25,000/yr can offset ordinary (W-2) income if you actively participate and your MAGI is under $100k (phasing out to $0 by $150k); unused losses carry forward. On sale, claimed depreciation is recaptured at up to 25%, and gains may owe capital-gains tax (a 1031 exchange can defer both). Figures are a year-1 estimate at your 24.0% rate — not tax advice; consult a CPA.
Schools (NCES district)
- District
- Massena Central School District
- NCES district ID
- 3618660
- Math proficiency
- 43% ▼ -10.00%
- Reading proficiency
- 49% ▲ 1.00%
- Median HH income
- $42,610
- Composite
- 38.75/100
- National rank
- #4123
- State rank
- #456 of 590 in NY
Livability — Massena
- Score
- 73/100
- State rank
- #330
- US rank
- #5449
Category grades
Schools grade is shown separately in the Schools card above.
Census & demographics
- Census place
- Massena, NY
- City population
- 15,737
- Population (ZIP)
- 15,737
Population outlook (St. Lawrence County) Hauer SSP2
- Today (2025)
- 110,027 people
- By 2030
- 107,455 · -2.3%
- By 2040
- 100,492 · -8.7%
- By 2050
- 94,254 · -14.3%
- By 2075
- 80,175 · -27.1%
- By 2100
- 63,140 · -42.6%
Race, ethnicity, and origin ACS 2023
- Neighborhood character
- Predominantly White (93%)
- Race & ethnicity
- White 93% Two or more races 4% Hispanic / Latino 2%
- Common ancestry
- Lithuanian 12% Slovak 2% Romanian 2%
- Foreign-born
- 4% · Canada
- Languages at home
- 96% English-only · French/Haitian/Cajun 1% Spanish 1% Russian/Polish/Slavic 1%
Political lean MEDSL · St. Lawrence
- 2024 margin
- R (+18.0) · D 41.0% · R 59.0%
- 2008→2024 swing
- -34.3pp toward R · 2008: 16.3pp · 2024: -18.0pp
- All cycles
- 2024: R+18.0 2020: R+11.7 2016: R+10.8 2012: D+16.6 2008: D+16.3
Not yet ingested
- Civics
- —
Market trends
- HPI YoY
- ▼ -16.77%
- Current HPI
- 243.4674
- Rent YoY
- —
- Metro
- —
- State GDP YoY
- ▲ 2.60%
- F500 in state
- 92
Industry mix (Fortune 500 HQ in NY)
| Industry | F500 HQs | Revenue |
|---|---|---|
| Financial Services | 10 | $950B |
|
||
| Consumer Goods | 9 | $162B |
|
||
| Insurance | 4 | $225B |
|
||
| Telecommunications | 2 | $144B |
|
||
| Pharmaceuticals | 2 | $112B |
|
||
| Media / Entertainment | 2 | $69B |
|
||
Price history
-20.0% since first listed4 events — show timeline
- 2026-04-27 Price Changed $119,900 SLCMLS
- 2026-04-27 Relisted — SLCMLS
- 2025-06-05 Price Changed $139,900 SLCMLS
- 2025-04-01 Listed $149,900 SLCMLS
Property tax history
+0.8%/yrLatest (2025): $1,510 · -1.1% YoY. Source: county tax records.
Cash-flow waterfall
monthlySold comps — $/sqft
last 12 mo · ≤1 miLoading sold comps…