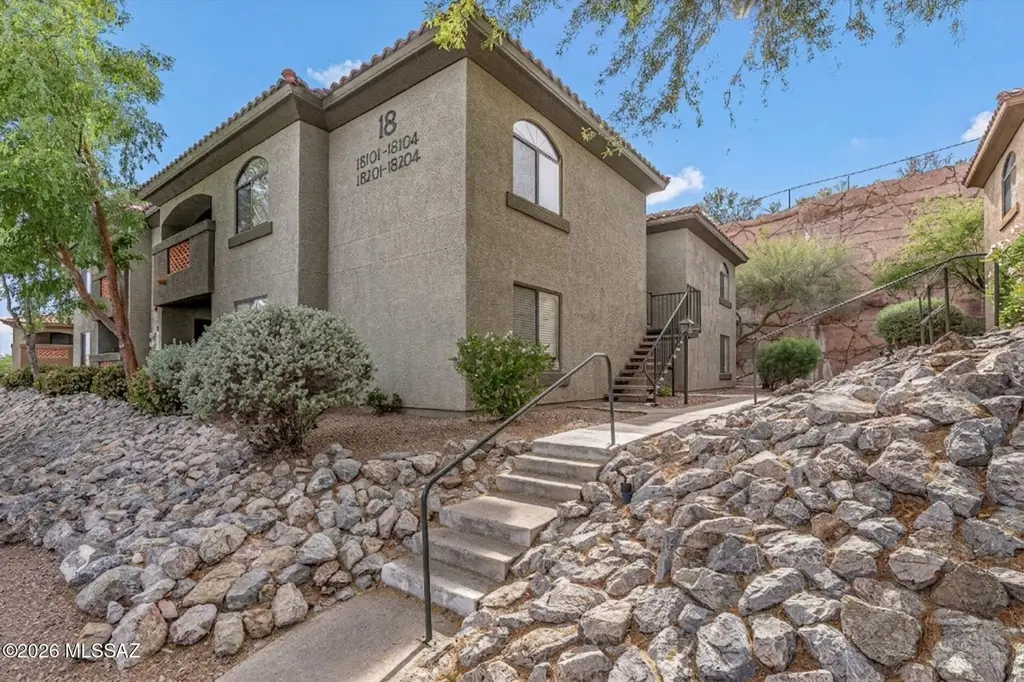
5751 N Kolb Rd #18201 · Catalina Foothills, AZ
Flood risk 1/10 · Minimal
- FEMA flood zone
- X (unshaded)
- Chance of flooding over 30 yrs
- 0.0%
- Est. flood insurance / yr
- $507 – $1,088
Fire risk 5/10 · Moderate
- Est. fire insurance / yr
- $610 – $1,132
Heat risk 7/10 · Major
- Hot days now (above 107°F)
- 7 days/yr
- Hot days in 30 yrs
- 21 days/yr
Wind risk 1/10 · Minimal
- Chance of severe wind over 30 yrs
- —
Air-quality risk 1/10 · Minimal
- Unhealthy air days now
- 0 days/yr
- Unhealthy air days in 30 yrs
- 0 days/yr
Risk factors via First Street. Map © Google.
Why this score? — see what drove the D grade
The composite is a weighted blend of 9 inputs, each scored 0–100. Each bar is that input's sub-score; the figure is the points it added to the 100-point composite (weight × sub-score).
- ARV discount +9.8/15.0
- Cash flow +9.4/30.0
- Schools +5.4/10.0
- 1% rule +3.6/10.0
- Livability +3.6/5.0
- Rent growth +3.2/5.0
- DSCR +2.6/10.0
- Condition / age +2.5/5.0
- Appreciation +0.0/10.0
$225,000
🖨 Deal sheet 📄 Offer letter ✓ Due diligence
Listing remarks MLS
Seller will accept or counter offers between $225,000-235,000. Discover the perfect Foothills lifestyle in this gated Veranda at Ventana condo. This 2nd-floor home offers lovely mountain views from the private balcony & living room. The upgraded kitchen is a highlight, w/ granite counters, stainless appliances & custom pull-out drawers. Enjoy ample storage w/ two walk-in closets & peace of mind from a newer HVAC (2021). Perfect as a starter home, the ultimate 'lock-and-leave' retreat, or savvy investment. Live in the heart of the Foothills, minutes from Sabino Canyon, golf, shopping & dining. Community features 2 pools w/ waterfalls, a spa, fitness center & outdoor fireplaces. A rare combination of views, upgrades & convenience
Key facts
- $309 HOA
- Parking
- Community pool
Neighborhood map
What this means for you Summary
Snapshot
- This is a 2-bed/2.0-bath condo listed at $225k.
Deal economics
- At list price, monthly cash flow is $-160 ($-2k/yr) — negative.
- To cash-flow at today's rent, offer at most $197k (12.6% below list).
- To meet the 1% rule (rent ≥ 1% of price), the offer needs to be $194k (13.6% below list).
- Recommended offer: $194k (13.6% below list) — sets the bar for 1% rule.
- Cap rate 5.4% vs local median 2.5% in Catalina Foothills — top-decile yield for the area; either an underpriced asset or a hidden risk that comps aren't pricing in. Stress-test before assuming the spread holds.
Location & tenants
- Location reads 71/100 on livability (#37 in AZ) — a middle-class / working-renter tenant base. Strengths: employment A+, housing A, crime A-; Watch: amenities F, commute F, cost of living F.
- Catalina Foothills Unified District (4410) (suburban): math 55% / reading 63% proficiency, ranked #15 of 249 in AZ (top 6%) — acceptable for families but not a draw, mixed tenant base, ~2y average lease; only 8% free/reduced lunch — higher-income household profile.
- Market conditions: Rents rising (+2.8%/yr); 213 active listings in the ZIP; 22 comparable units currently listed for rent nearby; rentals at typical pace (median 24d on market — plan ~3-4 weeks tenant-placement turnaround); solid renter incomes; 5,268 units permitted in Pima County in 2024 (996 in 5+ unit buildings).
Forward outlook
- Local home prices are declining (-3.0%/yr); year-one equity from $2k of loan paydown is wiped out by about $7k of value loss. Plan a longer hold.
- Pima County population projected at +8% by 2050 — modest demand growth; plan on rents tracking national, not racing it.
Negotiation context
- It's been on market 63 days — a 6% lower offer ($212k) is reasonable based on typical stale-listing flexibility.
Risks & watch-outs
- Climate carrying-cost: moderate wildfire risk; extreme-heat days projected 7→21/yr by 2055 (HVAC capex compounding) — expect insurance premiums to compound above CPI over the hold.
Questions for the listing agent
- What do current leases actually rent for vs. the listed asking? Can we see a recent rent roll and the last 12 months of T-12 income?
- It's been on market 63 days. Have you received any prior offers? Is the seller open to a 14% concession, seller financing, or rate buy-down credit?
- What does the HOA fee cover, when was the last increase, and are there any pending special assessments or reserve-fund shortfalls?
- Any open or pending special assessments — roof, HVAC, plumbing, elevator, façade? What's the per-unit balance and payoff schedule, and is the seller paying it off at close or rolling it to the buyer?
- Why hasn't it sold? Are there any deal-killer items the seller is aware of (foundation, flood, title, zoning, code violations)?
- Is there a deadline driving the sale (1031 exchange, divorce, estate, relocation)? That informs how much negotiation room exists.
- Schools are B-rated — typically a magnet for longer-tenancy family renters. What's the average tenant stay here, and is there a school-zone premium baked into asking?
- The area grade is low — what's the realistic commute time and amenity access for the typical tenant pool here? Any planned neighborhood developments (good or bad) we should know about?
- What's the average days-on-market for RENTAL listings here right now (not sales)? A rising rental-DOM trend means longer vacancies and softer asking-rent achievability than the comps imply.
- What's the recent tenant-quality profile in this submarket — average credit score on applications, eviction rate, late-payment / NSF rate, and stable-employment percentage? A property-management company in the area should have these aggregated.
- How much new apartment / multifamily construction is in the pipeline within 1–3 miles? Heavy new supply (>2% of stock underway) typically softens rents 12–24 months out; light construction supports rent growth.
Investment metrics
- 1% rule
- 0.86% ✗
- Cap rate
- 5.44%
- Cash-on-cash
- -3.06%
- DSCR
- 0.86
- GRM
- 9.6
CMA / ARV
- ARV (median comp)
- $237,274
- List price
- $225,000
- Delta
- -5.17%
- Verdict
- FAIR
- Comps
- 20 within 1.0 mi
Projected returns pro-forma
-3.0% appreciation · 2.84% rent growth · sell at horizon
- IRR
- -21.5%
- Equity multiple
- 0.26×
- Total profit
- $-46,876
- Equity at exit
- $33,548
- IRR
- -15.5%
- Equity multiple
- 0.13×
- Total profit
- $-54,784
- Equity at exit
- $19,454
Cash invested: $63,000 (down + closing). Projections, not guarantees.
Landlord ↔ Tenant lean methodology
- Overall (STATE)
- 87 Strongly Landlord-Friendly
- State Arizona
- 87 Strongly Landlord-Friendly · R+3
- County
- — inherits STATE
- City
- — inherits STATE
ZIP-level market 85750
- Rents YoY
- 2.8%
- Active inventory
- 213
- Price-to-rent
- 9.6×
Monthly cashflow live
- Estimated rent
- $1,945 high interval (Pro) →
- Mortgage (P&I)
- −$1,180
- Tax from tax record
- −$114 /mo · $1,369/yr
- Insurance
- −$94
- HOA
- −$309
- Vacancy / Maint / Mgmt
- −$408
- Net cashflow
- $-160
Break-even live
UW: 25.0% down · 7.5% · 30yr · 1.5% tax · 5.0% vac · 8.0% maint · 8.0% mgmt
Financing live
Cash to close
- Down payment
- $56,250
- Closing costs
- $6,750
- Reserves months
- —
- Total cash needed
- —
Loan-product check · same deal, 3 products live
Conventional
25% down · 7.5% · 30yr
- Down + closing
- —
- Monthly P&I
- —
- Monthly cashflow
- —
- DSCR
- —
- Eligible?
- —
Personal DTI + credit; lowest rate.
DSCR
20% down · 8.5% · 30yr
- Down + closing
- —
- Monthly P&I
- —
- Monthly cashflow
- —
- DSCR
- —
- Eligible?
- —
No personal income docs; deal must DSCR.
Hard money
10% down · 12.0% · 12mo
- Down + closing
- —
- Monthly P&I
- —
- Monthly cashflow
- —
- DSCR
- —
- Eligible?
- —
Short-term bridge; refi at stabilization.
Rent comps 22 comps
| Address | Beds | Baths | Sqft | Rent | $/sqft | DOM | Units | Dist |
|---|---|---|---|---|---|---|---|---|
| 5751 N Kolb Rd #5208 Tucson, AZ | 1.0 | 1.5 | 701 | $2,000 | $2.85 | 10d | 1 | 0.06mi |
| 5751 N Kolb Rd Tucson, AZ | 2.0 | 2.0 | 944 | $2,000 | $2.12 | 23d | 1 | 0.10mi |
| 5751 N Kolb Rd #39202 Tucson, AZ | 3.0 | 2.0 | 1117 | $2,499 | $2.24 | 23d | 1 | 0.12mi |
| 5751 N Kolb Rd #19108 Tucson, AZ | 1.0 | 1.0 | 701 | $2,000 | $2.85 | 17d | 1 | 0.12mi |
| 5751 N Kolb Rd Tucson, AZ | 1.0–3.0 | 1.0–2.0 | 948 | $1,625 | $1.71 | 2d | 9 | 0.13mi |
| 5800 N Kolb Rd #5124 Tucson, AZ | 2.0 | 2.5 | 976 | $2,700 | $2.77 | 23d | 1 | 0.24mi |
| 5800 N Kolb Rd #2109 Tucson, AZ | 2.0 | 2.0 | 967 | $2,200 | $2.28 | 23d | 1 | 0.27mi |
| 5855 N Kolb Rd Unit 5105 Tucson, AZ | 2.0 | 2.0 | 947 | $2,250 | $2.38 | 23d | 1 | 0.34mi |
| 5855 N Kolb Rd Tucson, AZ | 2.0 | 2.0 | 957 | $2,125 | $2.22 | 23d | 3 | 0.34mi |
| 5855 N Kolb Rd Tucson, AZ | 2.0 | 2.0 | 957 | $2,075 | $2.17 | 3d | 3 | 0.34mi |
| 5855 N Kolb Rd Tucson, AZ | 2.0 | 2.0 | 957 | $2,150 | $2.25 | 43d | 5 | 0.34mi |
| 7050 E Sunrise Dr Tucson, AZ | 1.0–3.0 | 1.0–2.0 | 984 | $1,798 | $1.83 | 3d | 7 | 0.43mi |
| 7050 E Sunrise Dr #15104 Tucson, AZ | 3.0 | 2.0 | 1048 | $2,200 | $2.10 | 23d | 1 | 0.44mi |
| 5565 N Sapphire Dr Tucson, AZ | 3.0 | 2.0 | 1123 | $1,800 | $1.60 | 11d | 1 | 0.50mi |
| 7255 E Snyder Rd #6203 Tucson, AZ | 2.0 | 2.0 | 1004 | $2,400 | $2.39 | 43d | 1 | 1.20mi |
| 6655 N Canyon Crest Dr Tucson, AZ | 1.0–3.0 | 1.0–2.0 | 967 | $2,250 | $2.33 | 17d | 2 | 1.20mi |
| 7255 E Snyder Rd Tucson, AZ | 2.0–3.0 | 2.0 | 1065 | $1,600 | $1.50 | 14d | 4 | 1.22mi |
| 7255 E Snyder Rd #12101 Tucson, AZ | 2.0 | 2.0 | 965 | $2,500 | $2.59 | 43d | 1 | 1.22mi |
| 5434 N Via del Arbolito Tucson, AZ | 2.0 | 2.0 | 1094 | $1,650 | $1.51 | 10d | 1 | 1.24mi |
| 5434 N Via del Arbolito Tucson, AZ | 2.0 | 2.0 | 1094 | $1,700 | $1.55 | 43d | 1 | 1.24mi |
| 6655 N Canyon Crest Dr #8243 Tucson, AZ | 1.0 | 1.0 | 716 | $3,000 | $4.19 | 23d | 1 | 1.30mi |
| 4700 N Kolb Rd Tucson, AZ | 2.0 | 1.0 | 984 | $1,409 | $1.43 | 19d | 1 | 1.37mi |
HOA detail condo
- Monthly dues
- $309 · $3,708/yr
- Likely covers
- waterpoolgymsecurity
- Assessments
- None detected in remarks — confirm with the listing agent.
Listing history 19 events
-
2026-06-18days on market $225,000 Active 63 DOM
-
2026-06-17days on market $225,000 Active 62 DOM
-
2026-06-16days on market $225,000 Active 61 DOM
-
2026-06-15days on market $225,000 Active 60 DOM
-
2026-06-13days on market $225,000 Active 58 DOM
-
2026-06-13days on market $225,000 Active 57 DOM
-
2026-06-10days on market $225,000 Active 55 DOM
-
2026-06-09days on market $225,000 Active 54 DOM
-
2026-06-08days on market $225,000 Active 53 DOM
-
2026-06-07days on market $225,000 Active 52 DOM
-
2026-06-03days on market $225,000 Active 48 DOM
-
2026-06-02days on market $225,000 Active 47 DOM
-
2026-06-01days on market $225,000 Active 46 DOM
-
2026-05-31days on market $225,000 Active 45 DOM
-
2026-05-15price $225,000 764-char remark
Show marketing remark (764 chars)
Seller will accept or counter offers between $225,000-235,000. Discover the perfect Foothills lifestyle in this gated Veranda at Ventana condo. This 2nd-floor home offers lovely mountain views from the private balcony & living room. The upgraded kitchen is a highlight, w/ granite counters, stainless appliances & custom pull-out drawers. Enjoy ample storage w/ two walk-in closets & peace of mind from a newer HVAC (2021). Perfect as a starter home, the ultimate 'lock-and-leave' retreat, or savvy investment. Live in the heart of the Foothills, minutes from Sabino Canyon, golf, shopping & dining. Community features 2 pools w/ waterfalls, a spa, fitness center & outdoor fireplaces. A rare combination of views, upgrades & convenience
-
2026-04-16$237,000 Active 764-char remark
Show marketing remark (764 chars)
Seller will accept or counter offers between $225,000-235,000. Discover the perfect Foothills lifestyle in this gated Veranda at Ventana condo. This 2nd-floor home offers lovely mountain views from the private balcony & living room. The upgraded kitchen is a highlight, w/ granite counters, stainless appliances & custom pull-out drawers. Enjoy ample storage w/ two walk-in closets & peace of mind from a newer HVAC (2021). Perfect as a starter home, the ultimate 'lock-and-leave' retreat, or savvy investment. Live in the heart of the Foothills, minutes from Sabino Canyon, golf, shopping & dining. Community features 2 pools w/ waterfalls, a spa, fitness center & outdoor fireplaces. A rare combination of views, upgrades & convenience
-
2026-04-16price $237,000 764-char remark
Show marketing remark (764 chars)
Seller will accept or counter offers between $225,000-235,000. Discover the perfect Foothills lifestyle in this gated Veranda at Ventana condo. This 2nd-floor home offers lovely mountain views from the private balcony & living room. The upgraded kitchen is a highlight, w/ granite counters, stainless appliances & custom pull-out drawers. Enjoy ample storage w/ two walk-in closets & peace of mind from a newer HVAC (2021). Perfect as a starter home, the ultimate 'lock-and-leave' retreat, or savvy investment. Live in the heart of the Foothills, minutes from Sabino Canyon, golf, shopping & dining. Community features 2 pools w/ waterfalls, a spa, fitness center & outdoor fireplaces. A rare combination of views, upgrades & convenience
-
2022-02-16soldstatus $249,000
-
2005-10-28soldstatus $52,750,000
ⓘ Source: listings_history table (triggers on properties + properties_extension) + one-shot
backfill from property_details.listing_events for pre-trigger history.
Tax reassessment forecast AZ · Resets to sale price
- Current annual tax
- $1,369 · $114/mo
- Projected year-2 tax
- $1,485 · $124/mo
- Expected delta
- +$116/yr (+$10/mo · 8.5%)
ⓘ Screening estimate from a state-policy table — verify with the county assessor before closing.
Climate risk First Street
- Flood 1/10 Low FEMA zone X (unshaded) · 0% chance over 30 yrs
- Wildfire 5/10 Major
- Heat 7/10 Severe 7 d/yr ≥107°F today · 21 d/yr by 30 yrs out
- Wind 1/10 Low
- Air quality 1/10 Low 0 unhealthy d/yr today · 0 by 30 yrs out
Nearby sold comps map
Loading sold comps map…
Walkable amenities ~0.75 mi
Loading nearby amenities…
Taxation est. · year 1
- Rental income
- $23,336
- − Mortgage interest
- −$12,603
- − Property taxes
- −$1,369
- − Insurance
- −$1,125
- − Repairs & maintenance
- −$1,867
- − Management
- −$1,867
- − HOA
- −$3,708
- − Depreciation
- −$6,545
- Taxable loss
- −$5,749
- Est. tax savings @ 24.0%
- +$1,380
- After-tax cash flow
- $-546/yr
For passive investors: Depreciation is non-cash, so a rental often shows a tax loss while cash-flowing — sheltering income. Rental losses are passive: they offset passive income freely, and up to $25,000/yr can offset ordinary (W-2) income if you actively participate and your MAGI is under $100k (phasing out to $0 by $150k); unused losses carry forward. On sale, claimed depreciation is recaptured at up to 25%, and gains may owe capital-gains tax (a 1031 exchange can defer both). Figures are a year-1 estimate at your 24.0% rate — not tax advice; consult a CPA.
Schools (NCES district)
- District
- Catalina Foothills Unified District (4410)
- NCES district ID
- 0401760
- Math proficiency
- 55% ▼ -12.00%
- Reading proficiency
- 63% ▼ -7.00%
- Median HH income
- $84,517
- Composite
- 53.52/100
- National rank
- #1448
- State rank
- #15 of 249 in AZ
Livability — Catalina Foothills
- Score
- 71/100
- State rank
- #37
- US rank
- #7046
Category grades
Schools grade is shown separately in the Schools card above.
Census & demographics
- Census place
- Catalina Foothills, AZ
- County
- Pima County · 1,012,107 people
- City population
- 52,156
- Metro
- Tucson, AZ
- Population (ZIP)
- 24,886
- Household income
- $102,836
- Rent vs Own
- Severe rent burden
- 637.0
Population outlook (Pima County) Hauer SSP2
- Today (2025)
- 1,066,056 people
- By 2030
- 1,086,684 · +1.9%
- By 2040
- 1,117,160 · +4.8%
- By 2050
- 1,149,778 · +7.9%
- By 2075
- 1,271,480 · +19.3%
- By 2100
- 1,321,160 · +23.9%
Race, ethnicity, and origin ACS 2023
- Neighborhood character
- Predominantly White (78%)
- Race & ethnicity
- White 78% Hispanic / Latino 11% Two or more races 9% Asian 4% Black 2%
- Hispanic origin (detail)
- Mexican 8%
- Common ancestry
- Slovak 4% Romanian 3% Portuguese 3%
- Foreign-born
- 11% · Canada, China, South Korea
- Languages at home
- 85% English-only · Spanish 7% Other Asian/Pacific 2% French/Haitian/Cajun 1%
Political lean MEDSL · Pima
- 2024 margin
- D (+15.2) · D 57.0% · R 41.8% · Other 1.2%
- 2008→2024 swing
- +9.1pp toward D · 2008: 6.1pp · 2024: 15.2pp
- All cycles
- 2024: D+15.2 2020: D+18.7 2016: D+13.5 2012: D+5.8 2008: D+6.1
Not yet ingested
- Civics
- —
Market trends
- HPI YoY
- ▼ -319.31%
- Current HPI
- 263.7632
- Rent YoY
- ▲ 2.84%
- Metro
- Tucson, AZ
- State GDP YoY
- ▲ 4.54%
- F500 in state
- 20
Industry mix (Fortune 500 HQ in AZ)
| Industry | F500 HQs | Revenue |
|---|---|---|
| Technology | 2 | $13B |
|
||
| Mining / Metals | 1 | $23B |
|
||
| Environmental Services | 1 | $16B |
|
||
| Metals / Steel | 1 | $14B |
|
||
| Technology Distribution | 1 | $9B |
|
||
| Homebuilding | 1 | $8B |
|
||
Price history
-99.6% since first listed5 events — show timeline
- 2026-05-15 Price Changed $225,000 MLSSAZ
- 2026-04-16 Listed $237,000 MLSSAZ
- 2026-04-16 Price Changed $237,000 MLSSAZ
- 2022-02-16 Sold (Public Records) $249,000 Public Records
- 2005-10-28 Sold (Public Records) $52,750,000 Public Records
Property tax history
+3.3%/yrLatest (2025): $1,369 · +4.8% YoY. Source: county tax records.
Cash-flow waterfall
monthlySold comps — $/sqft
last 12 mo · ≤1 miLoading sold comps…