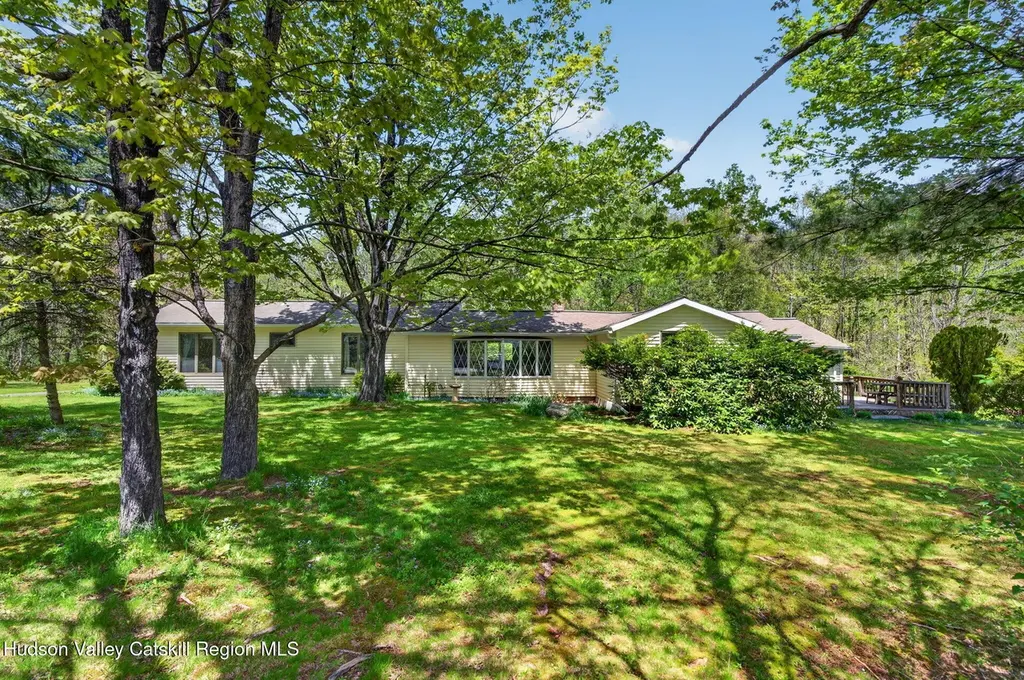
689 Old Rd · Windham, NY
Flood risk 1/10 · Minimal
- FEMA flood zone
- X (unshaded)
- Chance of flooding over 30 yrs
- 0.0%
- Est. flood insurance / yr
- $507 – $1,088
Fire risk 2/10 · Minimal
- Est. fire insurance / yr
- $691 – $1,283
Heat risk 1/10 · Minimal
- Hot days now (above 86°F)
- 7 days/yr
- Hot days in 30 yrs
- 17 days/yr
Wind risk 2/10 · Minimal
- Chance of severe wind over 30 yrs
- 3.0%
Air-quality risk 1/10 · Minimal
- Unhealthy air days now
- 0 days/yr
- Unhealthy air days in 30 yrs
- 0 days/yr
Risk factors via First Street. Map © Google.
Why this score? — see what drove the C grade
The composite is a weighted blend of 9 inputs, each scored 0–100. Each bar is that input's sub-score; the figure is the points it added to the 100-point composite (weight × sub-score).
- Cash flow +19.7/30.0
- ARV discount +7.5/15.0
- DSCR +6.2/10.0
- Appreciation +5.9/10.0
- 1% rule +4.6/10.0
- Schools +4.3/10.0
- Livability +3.0/5.0
- Rent growth +2.5/5.0
- Condition / age +2.5/5.0
$315,000
🖨 Deal sheet 📄 Offer letter ✓ Due diligence
Listing remarks
Step into the charm of this 1930s 2-bedroom, 2-bath ranch, just minutes from the Village of Windham and Windham Mountain. Nestled on a full acre and bordered by 25.5 acres of protected NYC watershed land, the property offers rare privacy and a seamless connection to nature. Wake up to the gentle sounds of a seasonal creek and lush surrounding greenery, a true mountain escape. Outside, a spacious deck invites morning coffee or evening stargazing, while a charming gazebo provides the perfect spot to unwind. A detached garage rounds out the exterior, ideal for storage or a workshop. Inside feel the cozy character of the home with endless potential, whether you're curling up by the fire or host
Key facts
- Charming gazebo
- Seasonal creek
- Renowned hiking
Tags
Property features AI
Exterior
- Parking: Detached garage (1 car); Asphalt driveway; Paved surfaces; Garage faces side
- Utilities: Private well water; Septic tank sewer; 150 Amp electrical service
- Home design: Single-family house; One level
- Construction: Block foundation; Asphalt shingle roof
- Exterior features: Private yard; Storage; Deck; Patio; Gazebo; Shed(s)
Interior
- Kitchen: Dishwasher; Range; Refrigerator
- Bedrooms: Primary bedroom located on the main level
- Bathrooms: 2 full bathrooms
- Heating & cooling: Baseboard heating; Hot water heat; Oil-fired heating
- Interior features: Main-level primary bedroom; Wood-burning fireplace in the living room; Main-level laundry
- Laundry & utility: Washer and dryer included; Laundry on main level
Neighborhood map
What this means for you Summary
Snapshot
- This is a 2-bed/2.0-bath single-family listed at $315k.
Deal economics
- At list price, monthly cash flow is $369 ($4k/yr) — positive.
- The deal already cash-flows at list — no discount required.
- To meet the 1% rule (rent ≥ 1% of price), the offer needs to be $301k (4.5% below list).
- Recommended offer: $301k (4.5% below list) — sets the bar for 1% rule.
- Cap rate 7.7% vs local median 3.4% in Windham — top-decile yield for the area; either an underpriced asset or a hidden risk that comps aren't pricing in. Stress-test before assuming the spread holds.
Location & tenants
- Location reads 60/100 on livability (#964 in NY) — a middle-class / working-renter tenant base. Strengths: housing A+, employment B+; Watch: schools C-, crime D+, cost of living D+.
- Windham-Ashland-Jewett Central School District (rural): math 55% / reading 40% proficiency, ranked #517 of 755 in NY (top 68%) — families likely to look elsewhere, expect single-tenant / working-renter base with shorter leases.
- Market conditions: 2 active listings in the ZIP; 97 units permitted in Greene County in 2024 (0 in 5+ unit buildings).
Forward outlook
- In year one you build about $8k of equity ($2k loan paydown + $6k appreciation (1.8% local appreciation)).
- Greene County population projected at -22% by 2050 — secular population decline; favor cash flow + early exit over multi-decade hold.
- At projected returns (1.8% appreciation + 3.0% rent growth), your $88k cash investment doubles in ~6 years — after that, you're playing with house money.
- By year 5, paydown + projected appreciation supports a ~$34k cash-out refi (75% LTV) — recoverable capital for the next deal without selling this one.
Negotiation context
- It's been on market 25 days — a 2% lower offer ($310k) is reasonable based on typical stale-listing flexibility.
- 8 sale attempts since 3y ago with the ask held roughly flat each time — persistent listings suggest the price (not the market) is what's stuck; bring a comps-based counter.
Risks & watch-outs
- Watch-outs: built in 1930 — expect roof / HVAC / electrical / plumbing capex.
Questions for the listing agent
- Built in 1930 — when were the roof, HVAC, electrical panel, plumbing, and water heater last replaced?
- Is there a deadline driving the sale (1031 exchange, divorce, estate, relocation)? That informs how much negotiation room exists.
- Crime grade is D in this area — have there been break-ins, vandalism, or insurance claims at this property in the last 3 years? What carrier currently insures it and at what premium?
- What's the average days-on-market for RENTAL listings here right now (not sales)? A rising rental-DOM trend means longer vacancies and softer asking-rent achievability than the comps imply.
- What's the recent tenant-quality profile in this submarket — average credit score on applications, eviction rate, late-payment / NSF rate, and stable-employment percentage? A property-management company in the area should have these aggregated.
- How much new for-sale + rental construction is in the pipeline within 1–3 miles? Heavy new supply typically softens prices + rents 12–24 months out; constrained supply supports both.
Investment metrics
- 1% rule
- 0.96% ✗
- Cap rate
- 7.70%
- Cash-on-cash
- 5.02%
- DSCR
- 1.22
- GRM
- 8.7
CMA / ARV
No comps found within radius.
Projected returns pro-forma
1.75% appreciation · 3.0% rent growth · sell at horizon
- IRR
- 8.8%
- Equity multiple
- 1.47×
- Total profit
- $41,055
- Equity at exit
- $120,026
- IRR
- 12.1%
- Equity multiple
- 2.59×
- Total profit
- $139,823
- Equity at exit
- $169,655
Cash invested: $88,200 (down + closing). Projections, not guarantees.
Landlord ↔ Tenant lean methodology
- Overall (STATE)
- 15 Strongly Tenant-Friendly
- State New York
- 15 Strongly Tenant-Friendly · D+10
- County
- — inherits STATE
- City
- — inherits STATE
ZIP-level market 12439
- Home prices YoY
- 0.4%
- Active inventory
- 2
- Price-to-rent
- 8.7×
Monthly cashflow live
- Estimated rent
- $3,009 medium interval (Pro) →
- Mortgage (P&I)
- −$1,652
- Tax from tax record
- −$225 /mo · $2,700/yr
- Insurance
- −$131
- HOA
- −$0
- Vacancy / Maint / Mgmt
- −$632
- Net cashflow
- $369
Break-even live
UW: 25.0% down · 7.5% · 30yr · 1.5% tax · 5.0% vac · 8.0% maint · 8.0% mgmt
Financing live
Cash to close
- Down payment
- $78,750
- Closing costs
- $9,450
- Reserves months
- —
- Total cash needed
- —
Loan-product check · same deal, 3 products live
Conventional
25% down · 7.5% · 30yr
- Down + closing
- —
- Monthly P&I
- —
- Monthly cashflow
- —
- DSCR
- —
- Eligible?
- —
Personal DTI + credit; lowest rate.
DSCR
20% down · 8.5% · 30yr
- Down + closing
- —
- Monthly P&I
- —
- Monthly cashflow
- —
- DSCR
- —
- Eligible?
- —
No personal income docs; deal must DSCR.
Hard money
10% down · 12.0% · 12mo
- Down + closing
- —
- Monthly P&I
- —
- Monthly cashflow
- —
- DSCR
- —
- Eligible?
- —
Short-term bridge; refi at stabilization.
Listing history 31 events
-
2026-06-18days on market $315,000 Active 25 DOM
-
2026-06-17days on market $315,000 Active 24 DOM
-
2026-06-16days on market $315,000 Active 23 DOM
-
2026-06-15days on market $315,000 Active 22 DOM
-
2026-06-13days on market $315,000 Active 20 DOM
-
2026-06-12days on market $315,000 Active 19 DOM
-
2026-06-09days on market $315,000 Active 16 DOM
-
2026-06-08days on market $315,000 Active 15 DOM
-
2026-06-07days on market $315,000 Active 14 DOM
-
2026-06-07days on market $315,000 Active 13 DOM
-
2026-06-04days on market $315,000 Active 10 DOM
-
2026-06-02days on market $315,000 Active 9 DOM
-
2026-06-01days on market $315,000 Active 8 DOM
-
2026-05-31days on market $315,000 Active 7 DOM
-
2026-05-24$315,000 Active
-
2025-12-25historical
-
2025-09-10price $340,000
-
2025-09-10price $340,000
-
2025-07-18status Active
-
2025-07-18status Active
-
2025-07-10status Pending
-
2025-07-09historical Active Under Contract
-
2025-05-02price $343,000
-
2025-05-02price $343,000
-
2025-04-10$345,000 Active
-
2025-03-24$345,000 Active
-
2024-08-12status Active
-
2024-07-29status Pending
-
2024-03-18status Active
-
2024-02-04historical Accepted (Show)
-
2023-11-29$345,000 Active
ⓘ Source: listings_history table (triggers on properties + properties_extension) + one-shot
backfill from property_details.listing_events for pre-trigger history.
Tax reassessment forecast NY · Partial reset (capped growth)
- Current annual tax
- $2,700 · $225/mo
- Projected year-2 tax
- $4,012 · $334/mo
- Expected delta
- +$1,312/yr (+$109/mo · 48.6%)
ⓘ Screening estimate from a state-policy table — verify with the county assessor before closing.
Climate risk First Street
- Flood 1/10 Low FEMA zone X (unshaded) · 0% chance over 30 yrs
- Wildfire 2/10 Low
- Heat 1/10 Low 7 d/yr ≥86°F today · 17 d/yr by 30 yrs out
- Wind 2/10 Low 3% chance of damaging wind over 30 yrs
- Air quality 1/10 Low 0 unhealthy d/yr today · 0 by 30 yrs out
Nearby sold comps map
Loading sold comps map…
Walkable amenities ~0.75 mi
Loading nearby amenities…
Taxation est. · year 1
- Rental income
- $36,104
- − Mortgage interest
- −$17,645
- − Property taxes
- −$2,700
- − Insurance
- −$1,575
- − Repairs & maintenance
- −$2,888
- − Management
- −$2,888
- − Depreciation
- −$9,164
- Taxable loss
- −$756
- Est. tax savings @ 24.0%
- +$182
- After-tax cash flow
- $4,606/yr
For passive investors: Depreciation is non-cash, so a rental often shows a tax loss while cash-flowing — sheltering income. Rental losses are passive: they offset passive income freely, and up to $25,000/yr can offset ordinary (W-2) income if you actively participate and your MAGI is under $100k (phasing out to $0 by $150k); unused losses carry forward. On sale, claimed depreciation is recaptured at up to 25%, and gains may owe capital-gains tax (a 1031 exchange can defer both). Figures are a year-1 estimate at your 24.0% rate — not tax advice; consult a CPA.
Schools (NCES district)
- District
- Windham-Ashland-Jewett Central School District
- NCES district ID
- 3631590
- Math proficiency
- 55% ▲ 5.00%
- Reading proficiency
- 40% ▼ -10.00%
- Median HH income
- $46,942
- Composite
- 42.57/100
- National rank
- #6842
- State rank
- #517 of 755 in NY
Livability — Windham
- Score
- 60/100
- State rank
- #964
- US rank
- #18888
Category grades
Schools grade is shown separately in the Schools card above.
Census & demographics
- Population (ZIP)
- 380
Population outlook (Greene County) Hauer SSP2
- Today (2025)
- 44,963 people
- By 2030
- 43,126 · -4.1%
- By 2040
- 38,756 · -13.8%
- By 2050
- 34,913 · -22.4%
- By 2075
- 28,156 · -37.4%
- By 2100
- 22,296 · -50.4%
Race, ethnicity, and origin ACS 2023
- Neighborhood character
- Predominantly White (89%)
- Race & ethnicity
- White 89% Hispanic / Latino 8% Two or more races 8% Black 3%
- Hispanic origin (detail)
- Cuban 8%
- Common ancestry
- Slovak 7% Lithuanian 3% German 2%
- Foreign-born
- 3%
- Languages at home
- 82% English-only · Spanish 9% French/Haitian/Cajun 8% Other Indo-European 1%
Political lean MEDSL · Greene
- 2024 margin
- R (+17.0) · D 41.5% · R 58.5%
- 2008→2024 swing
- -7.1pp toward R · 2008: -9.9pp · 2024: -17.0pp
- All cycles
- 2024: R+17.0 2020: R+15.6 2016: R+27.4 2012: R+11.1 2008: R+9.9
Not yet ingested
- Civics
- —
Market trends
- HPI YoY
- ▲ 1.75%
- Current HPI
- 449.8271
- Rent YoY
- —
- Metro
- —
- State GDP YoY
- ▲ 2.60%
- F500 in state
- 92
Industry mix (Fortune 500 HQ in NY)
| Industry | F500 HQs | Revenue |
|---|---|---|
| Financial Services | 10 | $950B |
|
||
| Consumer Goods | 9 | $162B |
|
||
| Insurance | 4 | $225B |
|
||
| Telecommunications | 2 | $144B |
|
||
| Pharmaceuticals | 2 | $112B |
|
||
| Media / Entertainment | 2 | $69B |
|
||
Price history
-8.7% since first listed17 events — show timeline
- 2026-05-24 Listed $315,000 HVCRMLS
- 2025-12-25 Listing Removed — OneKey® MLS as Distributed by MLS Grid
- 2025-09-10 Price Changed $340,000 OneKey® MLS as Distributed by MLS Grid
- 2025-09-10 Price Changed $340,000 HVCRMLS
- 2025-07-18 Relisted — HVCRMLS
- 2025-07-18 Relisted — OneKey® MLS as Distributed by MLS Grid
- 2025-07-10 Pending — OneKey® MLS as Distributed by MLS Grid
- 2025-07-09 Contingent — HVCRMLS
- 2025-05-02 Price Changed $343,000 OneKey® MLS as Distributed by MLS Grid
- 2025-05-02 Price Changed $343,000 HVCRMLS
- 2025-04-10 Listed $345,000 OneKey® MLS as Distributed by MLS Grid
- 2025-03-24 Listed $345,000 HVCRMLS
- 2024-08-12 Relisted — HVCRMLS
- 2024-07-29 Pending — HVCRMLS
- 2024-03-18 Relisted — HVCRMLS
- 2024-02-04 Contingent — HVCRMLS
- 2023-11-29 Listed $345,000 HVCRMLS
Property tax history
+4.3%/yrLatest (2025): $2,700 · +4.6% YoY. Source: county tax records.
Cash-flow waterfall
monthlySold comps — $/sqft
last 12 mo · ≤1 miLoading sold comps…