430 Dry Trl · Sunny Slopes, CA
Flood risk 1/10 · Minimal
- FEMA flood zone
- D
- Chance of flooding over 30 yrs
- 0.0%
- Est. flood insurance / yr
- $544 – $1,084
Fire risk 6/10 · Moderate
- Est. fire insurance / yr
- $659 – $1,223
Heat risk 2/10 · Minimal
- Hot days now (above 85°F)
- 4 days/yr
- Hot days in 30 yrs
- 11 days/yr
Wind risk 1/10 · Minimal
- Chance of severe wind over 30 yrs
- —
Air-quality risk 10/10 · Severe
- Unhealthy air days now
- 42 days/yr
- Unhealthy air days in 30 yrs
- 45 days/yr
Risk factors via First Street. Map © Google.
Why this score? — see what drove the D grade
The composite is a weighted blend of 9 inputs, each scored 0–100. Each bar is that input's sub-score; the figure is the points it added to the 100-point composite (weight × sub-score).
- ARV discount +15.0/15.0
- Cash flow +8.7/30.0
- Schools +4.2/10.0
- 1% rule +2.7/10.0
- Rent growth +2.5/5.0
- Condition / age +2.5/5.0
- DSCR +2.4/10.0
- Livability +2.4/5.0
- Appreciation +0.0/10.0
$399,000
🖨 Deal sheet 📄 Offer letter ✓ Due diligence
Listing remarks
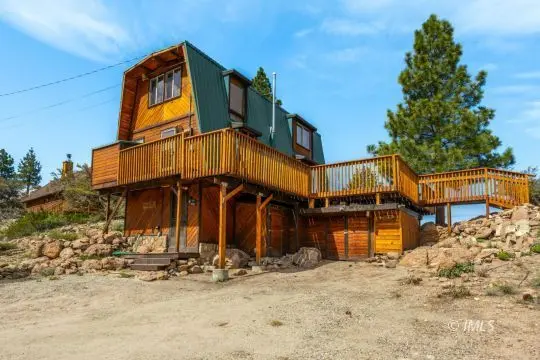
Located in the Pine Glade FS Tract, set among the pines with views of Crowley Lake stretching toward Mammoth, this Forest Service cabin offers a true mountain retreat. With its distinctive gambrel design, metal roof, recent exterior paint, and dual pane windows, the home blends rustic character with thoughtful updates. Inside features knotty pine walls, exposed beams, and a stone fireplace with wood burning stove. Main level has wood flooring, with carpet upstairs and on stairs. Kitchen includes newer appliances and updated gas range. Offered furnished with washer, dryer, outdoor furniture, gas BBQ, and a 2009 ATV. Expansive multi level deck takes full advantage of the surrounding setting.
Key facts
- Metal roof
- Knotty pine walls
- Dual pane windows
Tags
Property features AI
Exterior
- Utilities: Propane service; Septic tank
- Home design: Single family residence; 3 stories
- Construction: Wood siding; Metal roof; Crawl space foundation; Built on Forest Service lease (zoning)
- Exterior features: Deck; Shed(s); Has view
Interior
- Kitchen: Dishwasher; Microwave; Range; Oven; Refrigerator; Trash compactor
- Bedrooms: 3 total stories (bedroom locations not specified)
- Flooring: Carpet; Hardwood; Tile; Wood
- Bathrooms: 1 full bathroom; 1 three-quarter bathroom
- Heating & cooling: Electric heating; Wood stove; Ceiling fan(s)
- Interior features: Window coverings; Furnished; Wood burning fireplace
- Laundry & utility: Washer; Dryer; Electric water heater
Neighborhood map
What this means for you Summary
Snapshot
- This is a 2-bed/2.0-bath other listed at $399k.
Deal economics
- At list price, monthly cash flow is $-333 ($-4k/yr) — negative.
- To cash-flow at today's rent, offer at most $351k (12.1% below list).
- To meet the 1% rule (rent ≥ 1% of price), the offer needs to be $307k (23.1% below list).
- Recommended offer: $307k (23.1% below list) — sets the bar for 1% rule.
Location & tenants
- Location reads 48/100 on livability (#1,188 in CA) — a working-class tenant base; expect higher turnover. Strengths: crime A; Watch: commute C-, amenities F, employment F.
- Mammoth Unified (town): math 37% / reading 52% proficiency, ranked #549 of 1,400 in CA (top 39%) — families likely to look elsewhere, expect single-tenant / working-renter base with shorter leases.
- Market conditions: 252 active listings in the ZIP; solid renter incomes; 123 units permitted in Mono County in 2024 (76 in 5+ unit buildings).
- This rent runs 35% of the median local income ($106k/yr) — at the standard rent-burdened threshold; future hikes will face affordability resistance.
Forward outlook
- Local home prices are declining (-3.0%/yr); year-one equity from $3k of loan paydown is wiped out by about $12k of value loss. Plan a longer hold.
- Mono County population projected at -25% by 2050 — secular population decline; favor cash flow + early exit over multi-decade hold.
Negotiation context
- It's been on market 34 days — a 3% lower offer ($387k) is reasonable based on typical stale-listing flexibility.
Risks & watch-outs
- Climate carrying-cost: major wildfire risk — expect insurance premiums to compound above CPI over the hold.
Questions for the listing agent
- What do current leases actually rent for vs. the listed asking? Can we see a recent rent roll and the last 12 months of T-12 income?
- It's been on market 34 days. Have you received any prior offers? Is the seller open to a 23% concession, seller financing, or rate buy-down credit?
- Built in 1970 — when were the roof, HVAC, electrical panel, plumbing, and water heater last replaced?
- Is there a deadline driving the sale (1031 exchange, divorce, estate, relocation)? That informs how much negotiation room exists.
- The area grade is low — what's the realistic commute time and amenity access for the typical tenant pool here? Any planned neighborhood developments (good or bad) we should know about?
- What's the average days-on-market for RENTAL listings here right now (not sales)? A rising rental-DOM trend means longer vacancies and softer asking-rent achievability than the comps imply.
- What's the recent tenant-quality profile in this submarket — average credit score on applications, eviction rate, late-payment / NSF rate, and stable-employment percentage? A property-management company in the area should have these aggregated.
- How much new for-sale + rental construction is in the pipeline within 1–3 miles? Heavy new supply typically softens prices + rents 12–24 months out; constrained supply supports both.
Investment metrics
- 1% rule
- 0.77% ✗
- Cap rate
- 5.29%
- Cash-on-cash
- -3.58%
- DSCR
- 0.84
- GRM
- 10.8
CMA / ARV
- ARV (median comp)
- $681,042
- List price
- $399,000
- Delta
- -41.41%
- Verdict
- UNDERPRICED
- Comps
- 4 within 1.0 mi
Projected returns pro-forma
-3.0% appreciation · 3.0% rent growth · sell at horizon
- IRR
- -22.3%
- Equity multiple
- 0.23×
- Total profit
- $-85,823
- Equity at exit
- $59,492
- IRR
- -16.3%
- Equity multiple
- 0.09×
- Total profit
- $-101,862
- Equity at exit
- $34,498
Cash invested: $111,720 (down + closing). Projections, not guarantees.
Landlord ↔ Tenant lean methodology
- Overall (STATE)
- 18 Strongly Tenant-Friendly
- State California
- 18 Strongly Tenant-Friendly · D+13
- County
- — inherits STATE
- City
- — inherits STATE
ZIP-level market 93546
- Active inventory
- 252
- Price-to-rent
- 10.8×
Monthly cashflow live
- Estimated rent
- $3,069 medium interval (Pro) →
- Mortgage (P&I)
- −$2,092
- Tax est. 1.5%
- −$499 /mo · $5,985/yr
- Insurance
- −$166
- HOA
- −$0
- Vacancy / Maint / Mgmt
- −$644
- Net cashflow
- $-333
Break-even live
UW: 25.0% down · 7.5% · 30yr · 1.5% tax · 5.0% vac · 8.0% maint · 8.0% mgmt
Financing live
Cash to close
- Down payment
- $99,750
- Closing costs
- $11,970
- Reserves months
- —
- Total cash needed
- —
Loan-product check · same deal, 3 products live
Conventional
25% down · 7.5% · 30yr
- Down + closing
- —
- Monthly P&I
- —
- Monthly cashflow
- —
- DSCR
- —
- Eligible?
- —
Personal DTI + credit; lowest rate.
DSCR
20% down · 8.5% · 30yr
- Down + closing
- —
- Monthly P&I
- —
- Monthly cashflow
- —
- DSCR
- —
- Eligible?
- —
No personal income docs; deal must DSCR.
Hard money
10% down · 12.0% · 12mo
- Down + closing
- —
- Monthly P&I
- —
- Monthly cashflow
- —
- DSCR
- —
- Eligible?
- —
Short-term bridge; refi at stabilization.
Listing history 1 events
-
2026-04-21$399,000 Active 1060-char remark
ⓘ Source: listings_history table (triggers on properties + properties_extension) + one-shot
backfill from property_details.listing_events for pre-trigger history.
Climate risk First Street
- Flood 1/10 Low FEMA zone D · 0% chance over 30 yrs
- Wildfire 6/10 Major
- Heat 2/10 Low 4 d/yr ≥85°F today · 11 d/yr by 30 yrs out
- Wind 1/10 Low
- Air quality 10/10 Extreme 42 unhealthy d/yr today · 45 by 30 yrs out
Nearby sold comps map
Loading sold comps map…
Walkable amenities ~0.75 mi
Loading nearby amenities…
Taxation est. · year 1
- Rental income
- $36,825
- − Mortgage interest
- −$22,350
- − Property taxes
- −$5,985
- − Insurance
- −$1,995
- − Repairs & maintenance
- −$2,946
- − Management
- −$2,946
- − Depreciation
- −$11,607
- Taxable loss
- −$11,004
- Est. tax savings @ 24.0%
- +$2,641
- After-tax cash flow
- $-1,356/yr
For passive investors: Depreciation is non-cash, so a rental often shows a tax loss while cash-flowing — sheltering income. Rental losses are passive: they offset passive income freely, and up to $25,000/yr can offset ordinary (W-2) income if you actively participate and your MAGI is under $100k (phasing out to $0 by $150k); unused losses carry forward. On sale, claimed depreciation is recaptured at up to 25%, and gains may owe capital-gains tax (a 1031 exchange can defer both). Figures are a year-1 estimate at your 24.0% rate — not tax advice; consult a CPA.
Schools (NCES district)
- District
- Mammoth Unified
- NCES district ID
- 0623530
- Math proficiency
- 37% ▲ 1.00%
- Reading proficiency
- 52% ▲ 6.00%
- Median HH income
- $61,602
- Composite
- 41.54/100
- National rank
- #7267
- State rank
- #549 of 1400 in CA
Livability — Sunny Slopes
- Score
- 48/100
- State rank
- #1188
- US rank
- #26009
Category grades
Schools grade is shown separately in the Schools card above.
Census & demographics
- Census place
- Sunny Slopes, CA
- County
- Mono County · 9,000 people
- Metro
- nan
- Population (ZIP)
- 9,000
- Household income
- $105,577
- Rent vs Own
- Severe rent burden
- 182.0
Population outlook (Mono County) Hauer SSP2
- Today (2025)
- 13,077 people
- By 2030
- 12,478 · -4.6%
- By 2040
- 11,119 · -15.0%
- By 2050
- 9,769 · -25.3%
- By 2075
- 6,861 · -47.5%
- By 2100
- 5,762 · -55.9%
Race, ethnicity, and origin ACS 2023
- Neighborhood character
- Predominantly White (67%)
- Race & ethnicity
- White 67% Hispanic / Latino 26% Two or more races 17% Asian 3%
- Hispanic origin (detail)
- Mexican 24%
- Common ancestry
- Romanian 4% Iranian 3% Slovak 3%
- Foreign-born
- 19% · Canada
- Languages at home
- 75% English-only · Spanish 19% Other Indo-European 2% German/W. Germanic 1%
Political lean MEDSL · Mono
- 2024 margin
- Strong D (+20.2) · D 58.1% · R 37.8% · Other 4.1%
- 2008→2024 swing
- +7.0pp toward D · 2008: 13.3pp · 2024: 20.2pp
- All cycles
- 2024: D+20.2 2020: D+22.3 2016: D+11.9 2012: D+7.6 2008: D+13.3
Not yet ingested
- Civics
- —
Market trends
- HPI YoY
- ▼ -338.42%
- Current HPI
- 166.8869
- Rent YoY
- —
- Metro
- nan
- State GDP YoY
- ▲ 3.21%
- F500 in state
- 116
Industry mix (Fortune 500 HQ in CA)
| Industry | F500 HQs | Revenue |
|---|---|---|
| Technology | 27 | $1,492B |
|
||
| Financial Services | 3 | $174B |
|
||
| Retail | 3 | $44B |
|
||
| Insurance | 3 | $26B |
|
||
| Media / Entertainment | 2 | $115B |
|
||
| Pharmaceuticals / Biotech | 2 | $62B |
|
||
Price history
2 events — show timeline
- 2026-05-27 Pending — IMLS
- 2026-04-21 Listed $399,000 IMLS
Cash-flow waterfall
monthlySold comps — $/sqft
last 12 mo · ≤1 miLoading sold comps…