 🌊 Lakefront
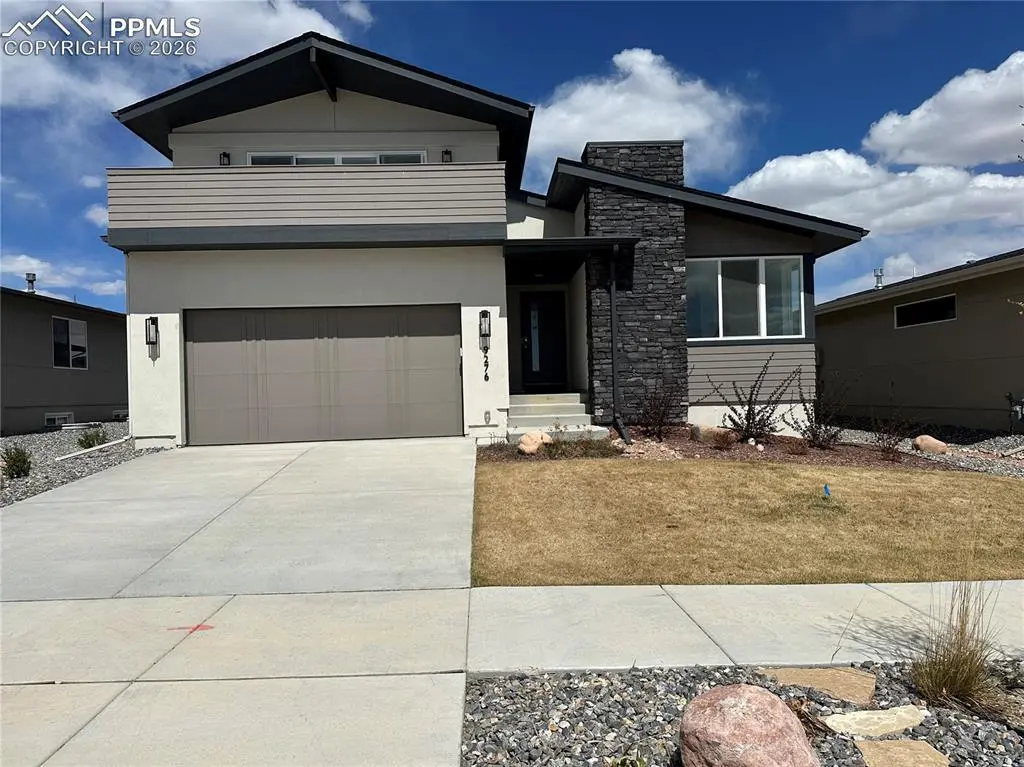
9276 Glitter Way · Colorado Springs, CO
Flood risk 1/10 · Minimal
- FEMA flood zone
- X (unshaded)
- Chance of flooding over 30 yrs
- 0.0%
- Est. flood insurance / yr
- $507 – $1,088
Fire risk 6/10 · Moderate
- Est. fire insurance / yr
- $939 – $1,743
Heat risk 2/10 · Minimal
- Hot days now (above 86°F)
- 7 days/yr
- Hot days in 30 yrs
- 20 days/yr
Wind risk 2/10 · Minimal
- Chance of severe wind over 30 yrs
- —
Air-quality risk 2/10 · Minimal
- Unhealthy air days now
- 1 days/yr
- Unhealthy air days in 30 yrs
- 1 days/yr
Risk factors via First Street. Map © Google.
Why this score? — see what drove the F grade
The composite is a weighted blend of 9 inputs, each scored 0–100. Each bar is that input's sub-score; the figure is the points it added to the 100-point composite (weight × sub-score).
- ARV discount +7.5/15.0
- Cash flow +5.1/30.0
- Schools +5.1/10.0
- Appreciation +4.1/10.0
- Livability +3.9/5.0
- Condition / age +2.5/5.0
- Rent growth +2.3/5.0
- 1% rule +1.0/10.0
- DSCR +0.0/10.0
$549,000
🖨 Deal sheet (PDF) 📄 Offer letter ✓ Due diligence
Key facts
- 6,969 sq ft lot
- 3 garage spots
- Built 2023
Property features AI
Finance
- Other: HOA required
- Financial info: Financing terms: Cash, Conventional, VA (see agent/show remarks)
- HOA & community: HOA with monthly fee; includes covenant enforcement, lawn care, snow removal and trash removal; Community amenities: club house, community center, dog park, hiking/biking trails, lake/pond, parks/open space, playground, pool
Exterior
- Parking: Attached 3-car garage with garage door opener
- Utilities: Water from an association/district; Cable available; Electricity available; Gas available; Solar available; Telephone available; High-speed internet available
- Home design: Single-family home; Existing home; Full basement
- Construction: Wood frame construction; Aluminum/vinyl/steel siding; Composite shingle roof; Full basement (approximately 82% finished)
- Exterior features: Level lot with views of Pikes Peak; Near park and schools; Auto sprinkler system
Interior
- Kitchen: Dishwasher; Disposal; Microwave; Self-cleaning oven
- Bedrooms: Main-floor bedroom
- Bathrooms: 4 full bathrooms
- Heating & cooling: Forced air heating (natural gas); Central air; Ceiling fans
- Interior features: 9-foot-plus ceilings; Vaulted ceilings; Gas fireplace on the main level
- Laundry & utility: Smart home thermostat; Radon mitigation system; Secondary suite in the home
Neighborhood map
What this means for you Summary
Snapshot
- This is a 5-bed/4.0-bath single-family listed at $549k.
Deal economics
- At list price, monthly cash flow is $-1k ($-15k/yr) — negative.
- To cash-flow at today's rent, offer at most $325k (40.8% below list).
- To meet the 1% rule (rent ≥ 1% of price), the offer needs to be $331k (39.7% below list).
- Recommended offer: $325k (40.8% below list) — sets the bar for cash-flow.
Location & tenants
- Location reads 78/100 on livability (#23 in CO, #2,639 nationally) — a middle-class / working-renter tenant base. Strengths: amenities A+, housing A+, health & safety A+; Watch: cost of living C-, crime F.
- Academy School District No. 20 In The County Of El Paso An (urban): math 45% / reading 65% proficiency, ranked #8 of 86 in CO (top 9%) — acceptable for families but not a draw, mixed tenant base, ~2y average lease; only 10% free/reduced lunch — higher-income household profile.
- Zoned schools: Chinook Trail Elementary School (math 62% / reading 82%, grade A-, #26 of 966 statewide, top 4%, 631 students, 8% FRL); Eagleview Middle School (math 42% / reading 59%, grade C, #38 of 270 statewide, top 14%, 948 students, 14% FRL); Pine Creek High School (math 53% / reading 77%, grade B, #31 of 381 statewide, top 8%, 1,815 students, 0% FRL) — zoned schools at 7% FRL track the district average.
- Market conditions: Rents soft (-0.8%/yr); 407 active listings in the ZIP; 4 comparable units currently listed for rent nearby; rentals at typical pace (median 17d on market — plan ~3-4 weeks tenant-placement turnaround); high-income renter base; 3,906 units permitted in El Paso County in 2024 (872 in 5+ unit buildings).
Forward outlook
- Local home prices are declining (-1.8%/yr); year-one equity from $4k of loan paydown is wiped out by about $10k of value loss. Plan a longer hold.
- El Paso County population projected at +28% by 2050 — long-run rental-demand tailwind backs the buy-and-hold thesis.
Negotiation context
- It's been on market 56 days — a 3% lower offer ($533k) is reasonable based on typical stale-listing flexibility.
- 2 sale attempts; this cycle's ask has dropped $100k (15%) from the opening price — seller is motivated, your offer sets the floor, not the list.
Risks & watch-outs
- Climate carrying-cost: major wildfire risk — expect insurance premiums to compound above CPI over the hold.
Questions for the listing agent
- What do current leases actually rent for vs. the listed asking? Can we see a recent rent roll and the last 12 months of T-12 income?
- It's been on market 56 days. Have you received any prior offers? Is the seller open to a 41% concession, seller financing, or rate buy-down credit?
- What does the HOA fee cover, when was the last increase, and are there any pending special assessments or reserve-fund shortfalls?
- Is there a deadline driving the sale (1031 exchange, divorce, estate, relocation)? That informs how much negotiation room exists.
- Schools are B-rated — typically a magnet for longer-tenancy family renters. What's the average tenant stay here, and is there a school-zone premium baked into asking?
- Crime grade is F in this area — have there been break-ins, vandalism, or insurance claims at this property in the last 3 years? What carrier currently insures it and at what premium?
- The area grade is low — what's the realistic commute time and amenity access for the typical tenant pool here? Any planned neighborhood developments (good or bad) we should know about?
- This sits on a lake — are riparian / water-frontage rights deeded with the parcel? Any dock permits, shoreline easements, or HOA water-use restrictions?
- What's the documented flood / surge / shoreline-erosion history here (FEMA AND non-FEMA — e.g., storm surge, creek backup, septic-field saturation)?
- Any water-quality or seasonal algae-bloom issues that affect tenant satisfaction or short-term-rental demand?
- What's the average days-on-market for RENTAL listings here right now (not sales)? A rising rental-DOM trend means longer vacancies and softer asking-rent achievability than the comps imply.
- What's the recent tenant-quality profile in this submarket — average credit score on applications, eviction rate, late-payment / NSF rate, and stable-employment percentage? A property-management company in the area should have these aggregated.
- How much new for-sale + rental construction is in the pipeline within 1–3 miles? Heavy new supply typically softens prices + rents 12–24 months out; constrained supply supports both.
Investment metrics
- 1% rule
- 0.60% ✗
- Cap rate
- 3.52%
- Cash-on-cash
- -9.89%
- DSCR
- 0.56
- GRM
- 13.8
CMA / ARV
- ARV (median comp)
- $1,112,806
- List price
- $549,000
- Delta
- -50.67%
- Verdict
- UNDERPRICED
- Comps
- 20 within 1.0 mi
Show comp detail 12 sales within ~0.75 mi
| Address | Dist | Beds/Ba | Sqft | Sold | Price | $/sf | Match |
|---|---|---|---|---|---|---|---|
| 6903 Enclave Vista Loop | 0.23mi | 4/4.0 (-1) | 3,838 (+1%) | 1mo | $655,000 | $171 | 82 |
| 6677 Thimble Ct | 0.23mi | 4/4.0 (-1) | 3,860 (+1%) | 1mo | $749,000 | $194 | 81 |
| 6656 Enclave Vista Loop | 0.17mi | 5/4.0 | 4,080 (+7%) | 3mo | $725,000 | $178 | 78 |
| 9373 Warrick St | 0.24mi | 4/4.0 (-1) | 4,008 (+5%) | 1mo | $825,000 | $206 | 75 |
| 6459 Jennings Way | 0.14mi | 5/3.5 | 3,292 (-14%) | 1mo | $757,461 | $230 | 68 |
| 9178 Kathi Creek Dr | 0.45mi | 4/2.5 (-1) | 3,886 (+2%) | 0mo | $635,000 | $163 | 64 |
| 6423 Tumble Creek Dr | 0.40mi | 4/4.0 (-1) | 4,194 (+10%) | 0mo | $878,000 | $209 | 60 |
| 9537 Bugaboo Dr | 0.20mi | 4/3.0 (-1) | 3,304 (-13%) | 3mo | $640,000 | $194 | 57 |
| 6017 Miller Run Pl | 0.73mi | 4/3.5 (-1) | 3,827 (+0%) | 3mo | $639,900 | $167 | 56 |
| 6088 Harney Dr | 0.57mi | 4/3.0 (-1) | 3,611 (-5%) | 2mo | $715,000 | $198 | 54 |
| 6073 Miller Run Pl | 0.71mi | 5/3.5 | 4,071 (+7%) | 3mo | $775,000 | $190 | 51 |
| 5849 Brave Eagle Dr | 0.68mi | 6/3.0 (+1) | 4,200 (+10%) | 0mo | $669,000 | $159 | 42 |
Match score weights: distance 35% · size 25% · config 20% · recency 20%. Top-matched comps best support the ARV.
Projected returns pro-forma
-1.81% appreciation · 0.0% rent growth · sell at horizon
- IRR
- -26.2%
- Equity multiple
- 0.02×
- Total profit
- $-151,386
- Equity at exit
- $111,520
- IRR
- -25.5%
- Equity multiple
- -0.61×
- Total profit
- $-247,713
- Equity at exit
- $100,014
Cash invested: $153,720 (down + closing). Projections, not guarantees.
Landlord ↔ Tenant lean methodology
- Overall (STATE)
- 38 Tenant-Leaning
- State Colorado
- 38 Tenant-Leaning · D+4
- County
- — inherits STATE
- City
- — inherits STATE
ZIP-level market 80924
- Home prices YoY
- -1.0%
- Rents YoY
- -0.8%
- Active inventory
- 407
- Price-to-rent
- 13.8×
Monthly cashflow live
- Estimated rent
- $3,312 medium interval (Pro) →
- Mortgage (P&I)
- −$2,879
- Tax from tax record
- −$508 /mo · $6,091/yr
- Insurance
- −$229
- HOA
- −$268
- Vacancy / Maint / Mgmt
- −$695
- Net cashflow
- $-1,267
Break-even live
Sensitivity live
| Price | -10% $-956 | -5% $-1,112 | +0% $-1,267 | +5% $-1,423 | +10% $-1,578 |
|---|---|---|---|---|---|
| Rent | -10% $-1,529 | -5% $-1,398 | +0% $-1,267 | +5% $-1,136 | +10% $-1,006 |
| Rate | -1.0pp $-991 | -0.5pp $-1,128 | base $-1,267 | +0.5pp $-1,409 | +1.0pp $-1,554 |
UW: 25.0% down · 7.5% · 30yr · 1.5% tax · 5.0% vac · 8.0% maint · 8.0% mgmt
Financing live
Cash to close
- Down payment
- $137,250
- Closing costs
- $16,470
- Reserves months
- —
- Total cash needed
- —
Loan-product check · same deal, 3 products live
Conventional
25% down · 7.5% · 30yr
- Down + closing
- —
- Monthly P&I
- —
- Monthly cashflow
- —
- DSCR
- —
- Eligible?
- —
Personal DTI + credit; lowest rate.
DSCR
20% down · 8.5% · 30yr
- Down + closing
- —
- Monthly P&I
- —
- Monthly cashflow
- —
- DSCR
- —
- Eligible?
- —
No personal income docs; deal must DSCR.
Hard money
10% down · 12.0% · 12mo
- Down + closing
- —
- Monthly P&I
- —
- Monthly cashflow
- —
- DSCR
- —
- Eligible?
- —
Short-term bridge; refi at stabilization.
Rent comps 4 comps
| Address | Beds | Baths | Sqft | Rent | $/sqft | DOM | Units | Dist |
|---|---|---|---|---|---|---|---|---|
| 6159 Harney Dr Colorado Springs, CO | 5.0 | 3.5 | 3829 | $3,500 | $0.91 | 16d | 1 | 0.50mi |
| 6209 Leon Young Dr Colorado Springs, CO | 5.0 | 3.5 | 3859 | $3,500 | $0.91 | 16d | 1 | 0.60mi |
| 6380 Knapp Dr Colorado Springs, CO | 4.0 | 3.0 | 3980 | $3,450 | $0.87 | 13d | 1 | 0.91mi |
| 6917 Cumbre Vista Way Colorado Springs, CO | 5.0 | 3.0 | 3500 | $3,150 | $0.90 | 4d | 1 | 1.32mi |
HOA detail
- Monthly dues
- $268 · $3,216/yr
Listing history 28 events
-
2026-06-19status $549,000 Pending 56 DOM
-
2026-06-18days on market $549,000 Active 56 DOM
-
2026-06-17days on market $549,000 Active 55 DOM
-
2026-06-16days on market $549,000 Active 54 DOM
-
2026-06-16status $549,000 Active 53 DOM
-
2026-06-15days on market $549,000 Under Contract - Showing 53 DOM
-
2026-06-14days on market $549,000 Under Contract - Showing 51 DOM
-
2026-06-13days on market $549,000 Under Contract - Showing 50 DOM
-
2026-06-10statusdays on market $549,000 Under Contract - Showing 48 DOM
-
2026-06-09days on market $549,000 Active 47 DOM
-
2026-06-09price $549,000 Active 46 DOM
-
2026-06-08days on market $619,000 Active 46 DOM
-
2026-06-07days on market $619,000 Active 45 DOM
-
2026-06-05days on market $619,000 Active 42 DOM
-
2026-06-03days on market $619,000 Active 41 DOM
-
2026-06-03days on market $619,000 Active 40 DOM
-
2026-06-01days on market $619,000 Active 39 DOM
-
2026-05-31days on market $619,000 Active 38 DOM
-
2026-05-06price $634,000
-
2026-04-22$649,000 Active
-
2026-01-24price $651,000
-
2026-01-15price $699,000
-
2025-12-17price $725,000
-
2025-09-22price $774,000
-
2025-06-26price $799,000
-
2025-06-16price $820,000
-
2025-04-08price $815,000
-
2025-03-31price $825,000
ⓘ Source: listings_history table (triggers on properties + properties_extension) + one-shot
backfill from property_details.listing_events for pre-trigger history.
Tax reassessment forecast CO · Resets to sale price
- Current annual tax
- $6,091 · $508/mo
- Projected year-2 tax
- $6,091 · $508/mo
- Expected delta
- $0/yr ($0/mo · 0.0%)
ⓘ Screening estimate from a state-policy table — verify with the county assessor before closing.
Climate risk First Street
- Flood 1/10 Low FEMA zone X (unshaded) · 0% chance over 30 yrs
- Wildfire 6/10 Major
- Heat 2/10 Low 7 d/yr ≥86°F today · 20 d/yr by 30 yrs out
- Wind 2/10 Low
- Air quality 2/10 Low 1 unhealthy d/yr today · 1 by 30 yrs out
Nearby sold comps map
Loading sold comps map…
Walkable amenities ~0.75 mi
Loading nearby amenities…
Taxation est. · year 1
- Rental income
- $39,740
- − Mortgage interest
- −$30,753
- − Property taxes
- −$6,091
- − Insurance
- −$2,745
- − Repairs & maintenance
- −$3,179
- − Management
- −$3,179
- − HOA
- −$3,216
- − Depreciation
- −$15,971
- Taxable loss
- −$25,394
- Est. tax savings @ 24.0%
- +$6,095
- After-tax cash flow
- $-9,111/yr
For passive investors: Depreciation is non-cash, so a rental often shows a tax loss while cash-flowing — sheltering income. Rental losses are passive: they offset passive income freely, and up to $25,000/yr can offset ordinary (W-2) income if you actively participate and your MAGI is under $100k (phasing out to $0 by $150k); unused losses carry forward. On sale, claimed depreciation is recaptured at up to 25%, and gains may owe capital-gains tax (a 1031 exchange can defer both). Figures are a year-1 estimate at your 24.0% rate — not tax advice; consult a CPA.
Schools (NCES district)
- District
- Academy School District No. 20 In The County Of El Paso An
- NCES district ID
- 0801920
- Math proficiency
- 45% ▼ -5.00%
- Reading proficiency
- 65% ▲ 1.00%
- Median HH income
- $89,325
- Composite
- 50.62/100
- National rank
- #1840
- State rank
- #8 of 86 in CO
Livability — Colorado Springs
- Score
- 78/100
- State rank
- #23
- US rank
- #2639
Category grades
Schools grade is shown separately in the Schools card above.
Census & demographics
- Census place
- Colorado Springs, CO
- County
- El Paso County · 689,348 people
- City population
- 555,783
- Metro
- Colorado Springs, CO
- Population (ZIP)
- 19,619
- Household income
- $139,447
- Rent vs Own
- Severe rent burden
- 464.0
Population outlook (El Paso County) Hauer SSP2
- Today (2025)
- 768,926 people
- By 2030
- 815,739 · +6.1%
- By 2040
- 903,489 · +17.5%
- By 2050
- 981,204 · +27.6%
- By 2075
- 1,155,542 · +50.3%
- By 2100
- 1,202,070 · +56.3%
Race, ethnicity, and origin ACS 2023
- Neighborhood character
- Predominantly White (74%)
- Race & ethnicity
- White 74% Two or more races 10% Hispanic / Latino 9% Asian 5% Black 4%
- Hispanic origin (detail)
- Mexican 6%
- Common ancestry
- Italian 5% Slovak 3% Romanian 2%
- Foreign-born
- 8% · Canada, South Korea, China
- Languages at home
- 89% English-only · Other Indo-European 3% Spanish 3% German/W. Germanic 2%
Political lean MEDSL · El Paso
- 2024 margin
- Lean R (+9.8) · D 43.8% · R 53.5% · Other 2.7%
- 2008→2024 swing
- +9.0pp toward D · 2008: -18.8pp · 2024: -9.8pp
- All cycles
- 2024: R+9.8 2020: R+10.8 2016: R+22.6 2012: R+21.4 2008: R+18.8
Not yet ingested
- Civics
- —
Market trends
- HPI YoY
- ▼ -1.81%
- Current HPI
- 180.049
- Rent YoY
- ▼ -0.85%
- Metro
- Colorado Springs, CO
- State GDP YoY
- ▲ 1.95%
- F500 in state
- 14
Industry mix (Fortune 500 HQ in CO)
| Industry | F500 HQs | Revenue |
|---|---|---|
| Technology Distribution | 1 | $31B |
|
||
| Food / Agriculture | 1 | $18B |
|
||
| Packaging | 1 | $14B |
|
||
| Healthcare | 1 | $13B |
|
||
| Energy | 1 | $10B |
|
||
| Technology | 1 | $4B |
|
||
Price history
-33.5% since first listed16 events — show timeline
- 2026-06-18 Pending — elevateMLS
- 2026-06-16 Relisted — elevateMLS
- 2026-06-10 Contingent — elevateMLS
- 2026-06-08 Price Changed $549,000 elevateMLS
- 2026-05-28 Price Changed $619,000 elevateMLS
- 2026-05-24 Price Changed $629,000 elevateMLS
- 2026-05-06 Price Changed $634,000 elevateMLS
- 2026-04-22 Listed $649,000 elevateMLS
- 2026-01-24 Price Changed $651,000 elevateMLS
- 2026-01-15 Price Changed $699,000 elevateMLS
- 2025-12-17 Price Changed $725,000 elevateMLS
- 2025-09-22 Price Changed $774,000 elevateMLS
- 2025-06-26 Price Changed $799,000 elevateMLS
- 2025-06-16 Price Changed $820,000 elevateMLS
- 2025-04-08 Price Changed $815,000 elevateMLS
- 2025-03-31 Price Changed $825,000 elevateMLS
Property tax history
+113.2%/yrLatest (2025): $6,091 · +42.9% YoY. Source: county tax records.
Cash-flow waterfall
monthlySold comps — $/sqft
last 12 mo · ≤1 miLoading sold comps…