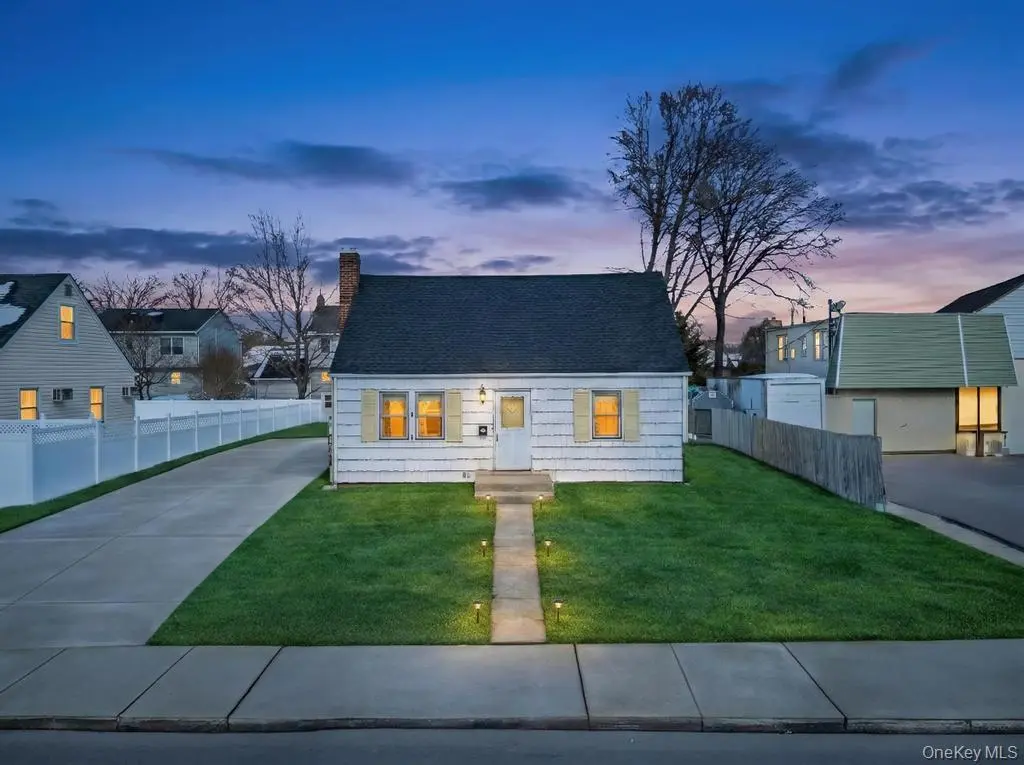
189 Ontario Ave · Massapequa, NY
Flood risk 1/10 · Minimal
- FEMA flood zone
- X (unshaded)
- Chance of flooding over 30 yrs
- 0.0%
- Est. flood insurance / yr
- $473 – $860
Fire risk 3/10 · Minor
- Est. fire insurance / yr
- $691 – $1,283
Heat risk 6/10 · Moderate
- Hot days now (above 94°F)
- 7 days/yr
- Hot days in 30 yrs
- 16 days/yr
Wind risk 6/10 · Moderate
- Chance of severe wind over 30 yrs
- 58.0%
Air-quality risk 4/10 · Minor
- Unhealthy air days now
- 3 days/yr
- Unhealthy air days in 30 yrs
- 5 days/yr
Risk factors via First Street. Map © Google.
Why this score? — see what drove the D grade
The composite is a weighted blend of 9 inputs, each scored 0–100. Each bar is that input's sub-score; the figure is the points it added to the 100-point composite (weight × sub-score).
- ARV discount +15.0/15.0
- Cash flow +7.5/30.0
- Schools +6.6/10.0
- Livability +4.1/5.0
- Rent growth +2.5/5.0
- Condition / age +2.5/5.0
- DSCR +1.6/10.0
- 1% rule +1.4/10.0
- Appreciation +0.0/10.0
$648,888
🖨 Deal sheet 📄 Offer letter ✓ Due diligence
Listing remarks MLS
Introducing this charming and spacious Cape-style home featuring 4 bedrooms and 3 full bathrooms, boasting flexible living space for a variety of needs. The home features beautiful hardwood floors, a bright den/family room, and a Full unfinished basement. A separate 1-bedroom suite with a private entrance on the main level is ideal for guests, extended living, or potential income opportunities. Major updates include a brand-new gas boiler and water heater, along with gas cooking and heating for added efficiency. The fully fenced yard provides great outdoor space for entertaining, gardening, or pets, plus private parking for everyday convenience. A well-maintained home with great bones and incredible potential to make it your own—don’t miss this opportunity!
Key facts
- Fenced yard
- Cape-style home
- Finished basement
Tags
Neighborhood map
What this means for you Summary
Snapshot
- This is a 4-bed/3.0-bath single-family listed at $649k.
Deal economics
- At list price, monthly cash flow is $-803 ($-10k/yr) — negative.
- To cash-flow at today's rent, offer at most $507k (21.9% below list).
- To meet the 1% rule (rent ≥ 1% of price), the offer needs to be $416k (35.8% below list).
- Recommended offer: $416k (35.8% below list) — sets the bar for 1% rule.
- Cap rate 4.8% vs local median 2.5% in Massapequa — top-decile yield for the area; either an underpriced asset or a hidden risk that comps aren't pricing in. Stress-test before assuming the spread holds.
Location & tenants
- Location reads 82/100 on livability (#82 in NY, #1,242 nationally) — a professional / high-income tenant draw. Strengths: schools A+, commute A+, employment A+; Watch: amenities D, cost of living F.
- Plainedge Union Free School District (suburban): math 65% / reading 77% proficiency, ranked #88 of 590 in NY (top 15%) — strong family-tenant draw, lease renewals of 3-5y typical; only 7% free/reduced lunch — higher-income household profile.
- Market conditions: 267 active listings in the ZIP; 3 comparable units currently listed for rent nearby; rentals leasing fast (median 5d on market — plan ~1-2 weeks tenant-placement turnaround); 824 units permitted in Nassau County in 2024 (153 in 5+ unit buildings).
Forward outlook
- Local home prices are declining (-3.0%/yr); year-one equity from $4k of loan paydown is wiped out by about $19k of value loss. Plan a longer hold.
- Nassau County population projected at +7% by 2050 — modest demand growth; plan on rents tracking national, not racing it.
Negotiation context
- It's been on market 105 days — a 9% lower offer ($590k) is reasonable based on typical stale-listing flexibility.
- Current owner paid $325k; list at $649k implies a 100% gain — meaningful room to come down on a strong offer.
Risks & watch-outs
- Watch-outs: built in 1948 — expect roof / HVAC / electrical / plumbing capex.
- Climate carrying-cost: major wind risk, 58% chance of damaging wind over 30y; extreme-heat days projected 7→16/yr by 2055 (HVAC capex compounding) — expect insurance premiums to compound above CPI over the hold.
Questions for the listing agent
- What do current leases actually rent for vs. the listed asking? Can we see a recent rent roll and the last 12 months of T-12 income?
- It's been on market 105 days. Have you received any prior offers? Is the seller open to a 36% concession, seller financing, or rate buy-down credit?
- Built in 1948 — when were the roof, HVAC, electrical panel, plumbing, and water heater last replaced?
- Why hasn't it sold? Are there any deal-killer items the seller is aware of (foundation, flood, title, zoning, code violations)?
- Is there a deadline driving the sale (1031 exchange, divorce, estate, relocation)? That informs how much negotiation room exists.
- Schools are A-rated — typically a magnet for longer-tenancy family renters. What's the average tenant stay here, and is there a school-zone premium baked into asking?
- The area grade is low — what's the realistic commute time and amenity access for the typical tenant pool here? Any planned neighborhood developments (good or bad) we should know about?
- What's the average days-on-market for RENTAL listings here right now (not sales)? A rising rental-DOM trend means longer vacancies and softer asking-rent achievability than the comps imply.
- What's the recent tenant-quality profile in this submarket — average credit score on applications, eviction rate, late-payment / NSF rate, and stable-employment percentage? A property-management company in the area should have these aggregated.
- How much new for-sale + rental construction is in the pipeline within 1–3 miles? Heavy new supply typically softens prices + rents 12–24 months out; constrained supply supports both.
Investment metrics
- 1% rule
- 0.64% ✗
- Cap rate
- 4.81%
- Cash-on-cash
- -5.31%
- DSCR
- 0.76
- GRM
- 13.0
CMA / ARV
- ARV (median comp)
- $806,616
- List price
- $648,888
- Delta
- -19.55%
- Verdict
- UNDERPRICED
- Comps
- 20 within 1.0 mi
Show comp detail 12 sales within ~0.75 mi
| Address | Dist | Beds/Ba | Sqft | Sold | Price | $/sf | Match |
|---|---|---|---|---|---|---|---|
| 202 Hamilton Ave | 0.13mi | 3/1.0 (-1) | 1,420 (+1%) | 5mo | $600,000 | $423 | 76 |
| 251 Hamilton Ave | 0.30mi | 4/2.0 | 1,500 (+6%) | 4mo | $810,000 | $540 | 68 |
| 4 Nottinghill Dr | 0.44mi | 3/1.5 (-1) | 1,371 (-3%) | 1mo | $830,000 | $605 | 63 |
| 130 Cleveland Ave | 0.39mi | 4/2.5 | 1,218 (-14%) | 4mo | $732,000 | $601 | 54 |
| 72 Koehl St | 0.69mi | 3/2.0 (-1) | 1,376 (-2%) | 5mo | $742,000 | $539 | 51 |
| 73 Chicago Ave | 0.70mi | 3/2.0 (-1) | 1,385 (-2%) | 6mo | $715,000 | $516 | 50 |
| 168A N Oak St | 0.63mi | 3/2.0 (-1) | 1,305 (-7%) | 2mo | $740,000 | $567 | 48 |
| 9 Walnut Pl | 0.66mi | 3/2.0 (-1) | 1,514 (+7%) | 3mo | $680,000 | $449 | 46 |
| 3 Walnut Pl | 0.69mi | 3/2.0 (-1) | 1,503 (+7%) | 3mo | $885,000 | $589 | 46 |
| 558 N Hawthorne St | 0.71mi | 5/2.0 (+1) | 1,492 (+6%) | 4mo | $772,000 | $517 | 44 |
| 72 Cleveland Ave | 0.61mi | 4/1.0 | 1,232 (-13%) | 0mo | $800,000 | $649 | 42 |
| 212 N Cedar St | 0.74mi | 3/1.0 (-1) | 1,492 (+6%) | 6mo | $697,000 | $467 | 38 |
Match score weights: distance 35% · size 25% · config 20% · recency 20%. Top-matched comps best support the ARV.
Projected returns pro-forma
-3.0% appreciation · 3.0% rent growth · sell at horizon
- IRR
- -25.4%
- Equity multiple
- 0.14×
- Total profit
- $-156,490
- Equity at exit
- $96,751
- IRR
- -21.7%
- Equity multiple
- -0.12×
- Total profit
- $-202,873
- Equity at exit
- $56,104
Cash invested: $181,689 (down + closing). Projections, not guarantees.
Landlord ↔ Tenant lean methodology
- Overall (STATE)
- 15 Strongly Tenant-Friendly
- State New York
- 15 Strongly Tenant-Friendly · D+10
- County
- — inherits STATE
- City
- — inherits STATE
ZIP-level market 11758
- Active inventory
- 267
- Price-to-rent
- 13.0×
Monthly cashflow live
- Estimated rent
- $4,164 medium interval (Pro) →
- Mortgage (P&I)
- −$3,403
- Tax from tax record
- −$420 /mo · $5,041/yr
- Insurance
- −$270
- HOA
- −$0
- Vacancy / Maint / Mgmt
- −$875
- Net cashflow
- $-803
Break-even live
UW: 25.0% down · 7.5% · 30yr · 1.5% tax · 5.0% vac · 8.0% maint · 8.0% mgmt
Financing live
Cash to close
- Down payment
- $162,222
- Closing costs
- $19,467
- Reserves months
- —
- Total cash needed
- —
Loan-product check · same deal, 3 products live
Conventional
25% down · 7.5% · 30yr
- Down + closing
- —
- Monthly P&I
- —
- Monthly cashflow
- —
- DSCR
- —
- Eligible?
- —
Personal DTI + credit; lowest rate.
DSCR
20% down · 8.5% · 30yr
- Down + closing
- —
- Monthly P&I
- —
- Monthly cashflow
- —
- DSCR
- —
- Eligible?
- —
No personal income docs; deal must DSCR.
Hard money
10% down · 12.0% · 12mo
- Down + closing
- —
- Monthly P&I
- —
- Monthly cashflow
- —
- DSCR
- —
- Eligible?
- —
Short-term bridge; refi at stabilization.
Rent comps 3 comps
| Address | Beds | Baths | Sqft | Rent | $/sqft | DOM | Units | Dist |
|---|---|---|---|---|---|---|---|---|
| 194 N Chestnut St Unit 2 Massapequa, NY | 3.0 | 1.0 | 900 | $3,700 | $4.11 | 1d | 1 | 0.68mi |
| 405 Massapequa Ave Massapequa, NY | 3.0 | 1.0 | 1550 | $3,700 | $2.39 | 4d | 1 | 1.12mi |
| 3883 Franklin Ave Seaford, NY | 4.0 | 2.0 | 1593 | $5,500 | $3.45 | 43d | 1 | 1.45mi |
Listing history 15 events
-
2026-06-18days on market $648,888 Active 105 DOM
-
2026-06-17days on market $648,888 Active 104 DOM
-
2026-06-16days on market $648,888 Active 103 DOM
-
2026-06-15days on market $648,888 Active 102 DOM
-
2026-06-13days on market $648,888 Active 100 DOM
-
2026-06-09days on market $648,888 Active 96 DOM
-
2026-06-08days on market $648,888 Active 95 DOM
-
2026-06-07days on market $648,888 Active 94 DOM
-
2026-06-04days on market $648,888 Active 91 DOM
-
2026-06-03days on market $648,888 Active 90 DOM
-
2026-06-02days on market $648,888 Active 89 DOM
-
2026-06-01days on market $648,888 Active 88 DOM
-
2026-05-31days on market $648,888 Active 87 DOM
-
2026-03-04$648,888 Active 779-char remark
Show marketing remark (779 chars)
Introducing this charming and spacious Cape-style home featuring 4 bedrooms and 3 full bathrooms, boasting flexible living space for a variety of needs. The home features beautiful hardwood floors, a bright den/family room, and a Full unfinished basement. A separate 1-bedroom suite with a private entrance on the main level is ideal for guests, extended living, or potential income opportunities. Major updates include a brand-new gas boiler and water heater, along with gas cooking and heating for added efficiency. The fully fenced yard provides great outdoor space for entertaining, gardening, or pets, plus private parking for everyday convenience. A well-maintained home with great bones and incredible potential to make it your own—don’t miss this opportunity!
-
2025-06-12soldstatus $325,000
ⓘ Source: listings_history table (triggers on properties + properties_extension) + one-shot
backfill from property_details.listing_events for pre-trigger history.
Tax reassessment forecast NY · Partial reset (capped growth)
- Current annual tax
- $5,041 · $420/mo
- Projected year-2 tax
- $8,003 · $667/mo
- Expected delta
- +$2,963/yr (+$247/mo · 58.8%)
ⓘ Screening estimate from a state-policy table — verify with the county assessor before closing.
Climate risk First Street
- Flood 1/10 Low FEMA zone X (unshaded) · 0% chance over 30 yrs
- Wildfire 3/10 Moderate
- Heat 6/10 Major 7 d/yr ≥94°F today · 16 d/yr by 30 yrs out
- Wind 6/10 Major 58% chance of damaging wind over 30 yrs
- Air quality 4/10 Moderate 3 unhealthy d/yr today · 5 by 30 yrs out
Nearby sold comps map
Loading sold comps map…
Walkable amenities ~0.75 mi
Loading nearby amenities…
Taxation est. · year 1
- Rental income
- $49,974
- − Mortgage interest
- −$36,348
- − Property taxes
- −$5,041
- − Insurance
- −$3,244
- − Repairs & maintenance
- −$3,998
- − Management
- −$3,998
- − Depreciation
- −$18,877
- Taxable loss
- −$21,532
- Est. tax savings @ 24.0%
- +$5,168
- After-tax cash flow
- $-4,472/yr
For passive investors: Depreciation is non-cash, so a rental often shows a tax loss while cash-flowing — sheltering income. Rental losses are passive: they offset passive income freely, and up to $25,000/yr can offset ordinary (W-2) income if you actively participate and your MAGI is under $100k (phasing out to $0 by $150k); unused losses carry forward. On sale, claimed depreciation is recaptured at up to 25%, and gains may owe capital-gains tax (a 1031 exchange can defer both). Figures are a year-1 estimate at your 24.0% rate — not tax advice; consult a CPA.
Schools (NCES district)
- District
- Plainedge Union Free School District
- NCES district ID
- 3623190
- Math proficiency
- 65% ▼ -13.00%
- Reading proficiency
- 77% ▲ 1.00%
- Median HH income
- $105,937
- Composite
- 65.5/100
- National rank
- #475
- State rank
- #88 of 590 in NY
Livability — Massapequa
- Score
- 82/100
- State rank
- #82
- US rank
- #1242
Category grades
Schools grade is shown separately in the Schools card above.
Census & demographics
- Census place
- Massapequa, NY
- City population
- 54,741
- Population (ZIP)
- 54,741
Population outlook (Nassau County) Hauer SSP2
- Today (2025)
- 1,409,302 people
- By 2030
- 1,431,482 · +1.6%
- By 2040
- 1,471,607 · +4.4%
- By 2050
- 1,502,845 · +6.6%
- By 2075
- 1,575,403 · +11.8%
- By 2100
- 1,554,356 · +10.3%
Race, ethnicity, and origin ACS 2023
- Neighborhood character
- Predominantly White (80%)
- Race & ethnicity
- White 80% Hispanic / Latino 11% Two or more races 7% Black 6% Asian 2%
- Hispanic origin (detail)
- Puerto Rican 4% Dominican 1%
- Common ancestry
- Romanian 4% Scotch-Irish 2% Italian 1%
- Foreign-born
- 8% · Canada, China
- Languages at home
- 89% English-only · Spanish 6% Other Indo-European 3% Russian/Polish/Slavic 1%
Political lean MEDSL · Nassau
- 2024 margin
- Toss-up / Even · D 47.9% · R 52.1%
- 2008→2024 swing
- -12.6pp toward R · 2008: 8.4pp · 2024: -4.2pp
- All cycles
- 2024: R+4.2 2020: D+9.5 2016: D+5.3 2012: D+6.7 2008: D+8.4
Not yet ingested
- Civics
- —
Market trends
- HPI YoY
- ▼ -765.19%
- Current HPI
- 287.8085
- Rent YoY
- —
- Metro
- —
- State GDP YoY
- ▲ 2.60%
- F500 in state
- 92
Industry mix (Fortune 500 HQ in NY)
| Industry | F500 HQs | Revenue |
|---|---|---|
| Financial Services | 10 | $950B |
|
||
| Consumer Goods | 9 | $162B |
|
||
| Insurance | 4 | $225B |
|
||
| Telecommunications | 2 | $144B |
|
||
| Pharmaceuticals | 2 | $112B |
|
||
| Media / Entertainment | 2 | $69B |
|
||
Price history
+99.7% since first listed2 events — show timeline
- 2026-03-04 Listed $648,888 OneKey® MLS as Distributed by MLS Grid
- 2025-06-12 Sold (Public Records) $325,000 Public Records
Property tax history
-0.4%/yrLatest (2024): $5,041 · +0.5% YoY. Source: county tax records.
Cash-flow waterfall
monthlySold comps — $/sqft
last 12 mo · ≤1 miLoading sold comps…