1477 Artesia Ave · Homestead Valley, CA
Flood risk 1/10 · Minimal
- FEMA flood zone
- D
- Chance of flooding over 30 yrs
- 0.0%
- Est. flood insurance / yr
- $544 – $1,084
Fire risk 4/10 · Minor
- Est. fire insurance / yr
- $659 – $1,223
Heat risk 6/10 · Moderate
- Hot days now (above 97°F)
- 8 days/yr
- Hot days in 30 yrs
- 24 days/yr
Wind risk 1/10 · Minimal
- Chance of severe wind over 30 yrs
- —
Air-quality risk 6/10 · Moderate
- Unhealthy air days now
- 9 days/yr
- Unhealthy air days in 30 yrs
- 12 days/yr
Risk factors via First Street. Map © Google.
Why this score? — see what drove the D- grade
The composite is a weighted blend of 9 inputs, each scored 0–100. Each bar is that input's sub-score; the figure is the points it added to the 100-point composite (weight × sub-score).
- Cash flow +12.7/30.0
- ARV discount +7.5/15.0
- DSCR +3.8/10.0
- Rent growth +3.5/5.0
- 1% rule +2.5/10.0
- Livability +2.5/5.0
- Condition / age +2.5/5.0
- Schools +2.2/10.0
- Appreciation +0.0/10.0
$220,000
🖨 Deal sheet 📄 Offer letter ✓ Due diligence
Listing remarks MLS
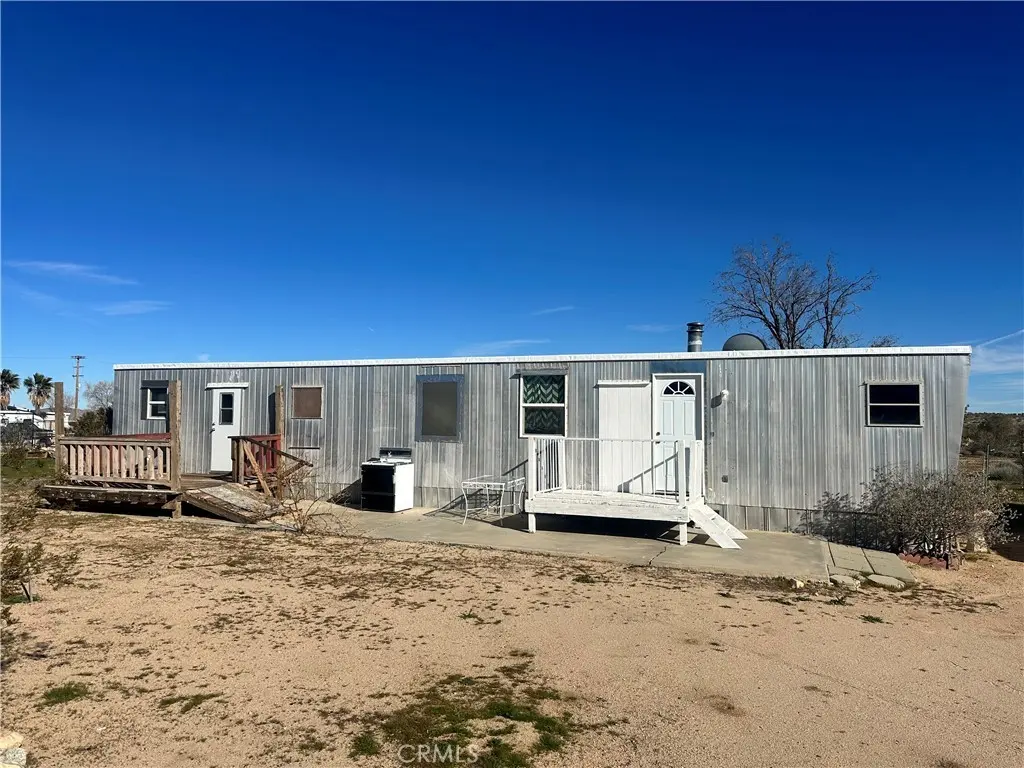
Located just down the road from iconic desert landmarks such as the Integratron, Giant Rock, and the acclaimed restaurant La Copine, in East Flamingo Heights offers a rare opportunity to own in one of the High Desert’s most sought-after areas. Set on spacious 2-acre parcel, this desert dream provides plenty of room for all your desert toys-ATV's, dirt bikes, RV's trailers and more, making it ideal for outdoor enthusiasts and adventure seekers. With wide-open spaces there's endless potential to create your own desert playground, add storage, or expand. With some nice added touches the cozy Manufactured home has 2 bedroom, 2 baths living spaces of the main home can truly shine, making it ideal for a primary residence, weekend retreat, or investment property. The property also features a separate 494-square-foot living area, adding exceptional flexibility and value. Whether used as a guest house, rental unit for additional income, creative studio, or mother-in-law suite, this fully self-contained space includes its own private entrance, providing both privacy and convenience. Surrounded by wide-open desert views, natural beauty, and endless skies, this property captures the peaceful spirit of the area while remaining close to popular destinations and attractions. Perfect for those seeking a unique desert escape with income potential, room to grow, and the charm of a creative High Desert lifestyle.
Key facts
- Separate living area
- Private entrance
- Built 1967
Tags
Neighborhood map
What this means for you Summary
Snapshot
- This is a 2-bed/2.0-bath manufactured listed at $220k.
Deal economics
- At list price, monthly cash flow is $-24 ($-282/yr) — negative.
- To cash-flow at today's rent, offer at most $216k (1.9% below list).
- To meet the 1% rule (rent ≥ 1% of price), the offer needs to be $166k (24.7% below list).
- Recommended offer: $166k (24.7% below list) — sets the bar for 1% rule.
- Cap rate 6.2% vs local median 3.7% in Homestead Valley — top-decile yield for the area; either an underpriced asset or a hidden risk that comps aren't pricing in. Stress-test before assuming the spread holds.
Location & tenants
- Location reads 49/100 on livability (#1,167 in CA) — a working-class tenant base; expect higher turnover. Strengths: housing A+; Watch: schools F, amenities F, commute F.
- Morongo Unified (town): math 15% / reading 38% proficiency, ranked #395 of 517 in CA (top 76%) — low school quality limits family demand, transient renter base, plan for 1-2y turnover.
- Market conditions: Rents rising fast (+4.1%/yr); 563 active listings in the ZIP; 5,458 units permitted in San Bernardino County in 2024 (1,500 in 5+ unit buildings).
- This rent runs 34% of the median local income ($58k/yr) — at the standard rent-burdened threshold; future hikes will face affordability resistance.
Forward outlook
- Local home prices are declining (-3.0%/yr); year-one equity from $2k of loan paydown is wiped out by about $7k of value loss. Plan a longer hold.
- San Bernardino County population projected at +15% by 2050 — modest demand growth; plan on rents tracking national, not racing it.
Negotiation context
- It's been on market 150 days — a 12% lower offer ($194k) is reasonable based on typical stale-listing flexibility.
- 3 sale attempts since 2y ago with the ask held roughly flat each time — persistent listings suggest the price (not the market) is what's stuck; bring a comps-based counter.
- Current owner paid $34k; list at $220k implies a 557% gain — meaningful room to come down on a strong offer.
Risks & watch-outs
- Climate carrying-cost: extreme-heat days projected 8→24/yr by 2055 (HVAC capex compounding) — expect insurance premiums to compound above CPI over the hold.
Questions for the listing agent
- What do current leases actually rent for vs. the listed asking? Can we see a recent rent roll and the last 12 months of T-12 income?
- It's been on market 150 days. Have you received any prior offers? Is the seller open to a 25% concession, seller financing, or rate buy-down credit?
- Built in 1967 — when were the roof, HVAC, electrical panel, plumbing, and water heater last replaced?
- Why hasn't it sold? Are there any deal-killer items the seller is aware of (foundation, flood, title, zoning, code violations)?
- Is there a deadline driving the sale (1031 exchange, divorce, estate, relocation)? That informs how much negotiation room exists.
- Schools are F-rated, which usually means shorter tenancies and higher turnover. Who's the typical renter profile here, and what's been the actual vacancy rate?
- The area grade is low — what's the realistic commute time and amenity access for the typical tenant pool here? Any planned neighborhood developments (good or bad) we should know about?
- What's the average days-on-market for RENTAL listings here right now (not sales)? A rising rental-DOM trend means longer vacancies and softer asking-rent achievability than the comps imply.
- What's the recent tenant-quality profile in this submarket — average credit score on applications, eviction rate, late-payment / NSF rate, and stable-employment percentage? A property-management company in the area should have these aggregated.
- How much new for-sale + rental construction is in the pipeline within 1–3 miles? Heavy new supply typically softens prices + rents 12–24 months out; constrained supply supports both.
Investment metrics
- 1% rule
- 0.75% ✗
- Cap rate
- 6.16%
- Cash-on-cash
- -0.46%
- DSCR
- 0.98
- GRM
- 11.1
CMA / ARV
No comps found within radius.
Projected returns pro-forma
-3.0% appreciation · 4.12% rent growth · sell at horizon
- IRR
- -16.0%
- Equity multiple
- 0.43×
- Total profit
- $-35,350
- Equity at exit
- $32,803
- IRR
- -6.1%
- Equity multiple
- 0.59×
- Total profit
- $-25,152
- Equity at exit
- $19,022
Cash invested: $61,600 (down + closing). Projections, not guarantees.
Landlord ↔ Tenant lean methodology
- Overall (STATE)
- 18 Strongly Tenant-Friendly
- State California
- 18 Strongly Tenant-Friendly · D+13
- County
- — inherits STATE
- City
- — inherits STATE
ZIP-level market 92284
- Home prices YoY
- -33.1%
- Rents YoY
- 4.1%
- Active inventory
- 563
- Price-to-rent
- 11.1×
Monthly cashflow live
- Estimated rent
- $1,657 medium interval (Pro) →
- Mortgage (P&I)
- −$1,154
- Tax from tax record
- −$87 /mo · $1,046/yr
- Insurance
- −$92
- HOA
- −$0
- Vacancy / Maint / Mgmt
- −$348
- Net cashflow
- $-24
Break-even live
UW: 25.0% down · 7.5% · 30yr · 1.5% tax · 5.0% vac · 8.0% maint · 8.0% mgmt
Financing live
Cash to close
- Down payment
- $55,000
- Closing costs
- $6,600
- Reserves months
- —
- Total cash needed
- —
Loan-product check · same deal, 3 products live
Conventional
25% down · 7.5% · 30yr
- Down + closing
- —
- Monthly P&I
- —
- Monthly cashflow
- —
- DSCR
- —
- Eligible?
- —
Personal DTI + credit; lowest rate.
DSCR
20% down · 8.5% · 30yr
- Down + closing
- —
- Monthly P&I
- —
- Monthly cashflow
- —
- DSCR
- —
- Eligible?
- —
No personal income docs; deal must DSCR.
Hard money
10% down · 12.0% · 12mo
- Down + closing
- —
- Monthly P&I
- —
- Monthly cashflow
- —
- DSCR
- —
- Eligible?
- —
Short-term bridge; refi at stabilization.
Listing history 21 events
-
2026-06-18days on market $220,000 Active 150 DOM
-
2026-06-17days on market $220,000 Active 149 DOM
-
2026-06-16days on market $220,000 Active 148 DOM
-
2026-06-15days on market $220,000 Active 147 DOM
-
2026-06-13days on market $220,000 Active 145 DOM
-
2026-06-13days on market $220,000 Active 144 DOM
-
2026-06-09days on market $220,000 Active 141 DOM
-
2026-06-08days on market $220,000 Active 140 DOM
-
2026-06-07days on market $220,000 Active 139 DOM
-
2026-06-04days on market $220,000 Active 136 DOM
-
2026-06-03days on market $220,000 Active 135 DOM
-
2026-06-02days on market $220,000 Active 134 DOM
-
2026-06-01days on market $220,000 Active 133 DOM
-
2026-05-31days on market $220,000 Active 132 DOM
-
2026-01-19$220,000 Active 1423-char remark
Show marketing remark (1423 chars)
Located just down the road from iconic desert landmarks such as the Integratron, Giant Rock, and the acclaimed restaurant La Copine, in East Flamingo Heights offers a rare opportunity to own in one of the High Desert’s most sought-after areas. Set on spacious 2-acre parcel, this desert dream provides plenty of room for all your desert toys-ATV's, dirt bikes, RV's trailers and more, making it ideal for outdoor enthusiasts and adventure seekers. With wide-open spaces there's endless potential to create your own desert playground, add storage, or expand. With some nice added touches the cozy Manufactured home has 2 bedroom, 2 baths living spaces of the main home can truly shine, making it ideal for a primary residence, weekend retreat, or investment property. The property also features a separate 494-square-foot living area, adding exceptional flexibility and value. Whether used as a guest house, rental unit for additional income, creative studio, or mother-in-law suite, this fully self-contained space includes its own private entrance, providing both privacy and convenience. Surrounded by wide-open desert views, natural beauty, and endless skies, this property captures the peaceful spirit of the area while remaining close to popular destinations and attractions. Perfect for those seeking a unique desert escape with income potential, room to grow, and the charm of a creative High Desert lifestyle.
-
2025-07-11status Pending Sale
-
2025-07-09historical
-
2025-03-18$250,000 Active
-
2025-03-01historical
-
2024-08-30$250,000 Active
-
1990-11-06soldstatus $33,500
ⓘ Source: listings_history table (triggers on properties + properties_extension) + one-shot
backfill from property_details.listing_events for pre-trigger history.
Tax reassessment forecast CA · Resets to sale price
- Current annual tax
- $1,046 · $87/mo
- Projected year-2 tax
- $1,672 · $139/mo
- Expected delta
- +$626/yr (+$52/mo · 59.8%)
ⓘ Screening estimate from a state-policy table — verify with the county assessor before closing.
Climate risk First Street
- Flood 1/10 Low FEMA zone D · 0% chance over 30 yrs
- Wildfire 4/10 Moderate
- Heat 6/10 Major 8 d/yr ≥97°F today · 24 d/yr by 30 yrs out
- Wind 1/10 Low
- Air quality 6/10 Major 9 unhealthy d/yr today · 12 by 30 yrs out
Nearby sold comps map
Loading sold comps map…
Walkable amenities ~0.75 mi
Loading nearby amenities…
Taxation est. · year 1
- Rental income
- $19,884
- − Mortgage interest
- −$12,323
- − Property taxes
- −$1,046
- − Insurance
- −$1,100
- − Repairs & maintenance
- −$1,591
- − Management
- −$1,591
- − Depreciation
- −$6,400
- Taxable loss
- −$4,167
- Est. tax savings @ 24.0%
- +$1,000
- After-tax cash flow
- $718/yr
For passive investors: Depreciation is non-cash, so a rental often shows a tax loss while cash-flowing — sheltering income. Rental losses are passive: they offset passive income freely, and up to $25,000/yr can offset ordinary (W-2) income if you actively participate and your MAGI is under $100k (phasing out to $0 by $150k); unused losses carry forward. On sale, claimed depreciation is recaptured at up to 25%, and gains may owe capital-gains tax (a 1031 exchange can defer both). Figures are a year-1 estimate at your 24.0% rate — not tax advice; consult a CPA.
Schools (NCES district)
- District
- Morongo Unified
- NCES district ID
- 0625860
- Math proficiency
- 15% ▼ -12.00%
- Reading proficiency
- 38% ▼ -3.00%
- Median HH income
- $39,399
- Composite
- 22.19/100
- National rank
- #8156
- State rank
- #395 of 517 in CA
Livability — Homestead Valley
- Score
- 49/100
- State rank
- #1167
- US rank
- #25885
Category grades
Schools grade is shown separately in the Schools card above.
Census & demographics
- Census place
- Homestead Valley, CA
- County
- San Bernardino County · 2,030,291 people
- Metro
- Riverside-San Bernardino-Ontario, CA
- Population (ZIP)
- 25,415
- Household income
- $58,373
- Rent vs Own
- Severe rent burden
- 1132.0
Population outlook (San Bernardino County) Hauer SSP2
- Today (2025)
- 2,300,329 people
- By 2030
- 2,378,907 · +3.4%
- By 2040
- 2,523,137 · +9.7%
- By 2050
- 2,642,388 · +14.9%
- By 2075
- 2,880,769 · +25.2%
- By 2100
- 2,909,436 · +26.5%
Race, ethnicity, and origin ACS 2023
- Neighborhood character
- Diverse neighborhood (Simpson 0.55)
- Race & ethnicity
- White 62% Hispanic / Latino 25% Two or more races 18% Black 2% Native American 2% Asian 2% Pacific Islander 1%
- Hispanic origin (detail)
- Mexican 20%
- Common ancestry
- Italian 4% Romanian 2% Slovak 2%
- Foreign-born
- 9% · Canada
- Languages at home
- 82% English-only · Spanish 14% Other Indo-European 1% Other Asian/Pacific 1%
Political lean MEDSL · San Bernardino
- 2024 margin
- Toss-up / Even · D 47.5% · R 49.7% · Other 2.8%
- 2008→2024 swing
- -8.5pp toward R · 2008: 6.3pp · 2024: -2.1pp
- All cycles
- 2024: R+2.1 2020: D+10.7 2016: D+9.8 2012: D+5.4 2008: D+6.3
Not yet ingested
- Civics
- —
Market trends
- HPI YoY
- ▼ -241.13%
- Current HPI
- 486.7185
- Rent YoY
- ▲ 4.12%
- Metro
- Riverside-San Bernardino-Ontario, CA
- State GDP YoY
- ▲ 3.21%
- F500 in state
- 116
Industry mix (Fortune 500 HQ in CA)
| Industry | F500 HQs | Revenue |
|---|---|---|
| Technology | 27 | $1,492B |
|
||
| Financial Services | 3 | $174B |
|
||
| Retail | 3 | $44B |
|
||
| Insurance | 3 | $26B |
|
||
| Media / Entertainment | 2 | $115B |
|
||
| Pharmaceuticals / Biotech | 2 | $62B |
|
||
Price history
+556.7% since first listed7 events — show timeline
- 2026-01-19 Listed $220,000 CRMLS
- 2025-07-11 Pending — CRMLS
- 2025-07-09 Listing Removed — CRMLS
- 2025-03-18 Listed $250,000 CRMLS
- 2025-03-01 Listing Removed — CRMLS
- 2024-08-30 Listed $250,000 CRMLS
- 1990-11-06 Sold (Public Records) $33,500 Public Records
Property tax history
+5.1%/yrLatest (2025): $1,046 · +4.0% YoY. Source: county tax records.
Cash-flow waterfall
monthlySold comps — $/sqft
last 12 mo · ≤1 miLoading sold comps…