 🏷️ Likely Rental
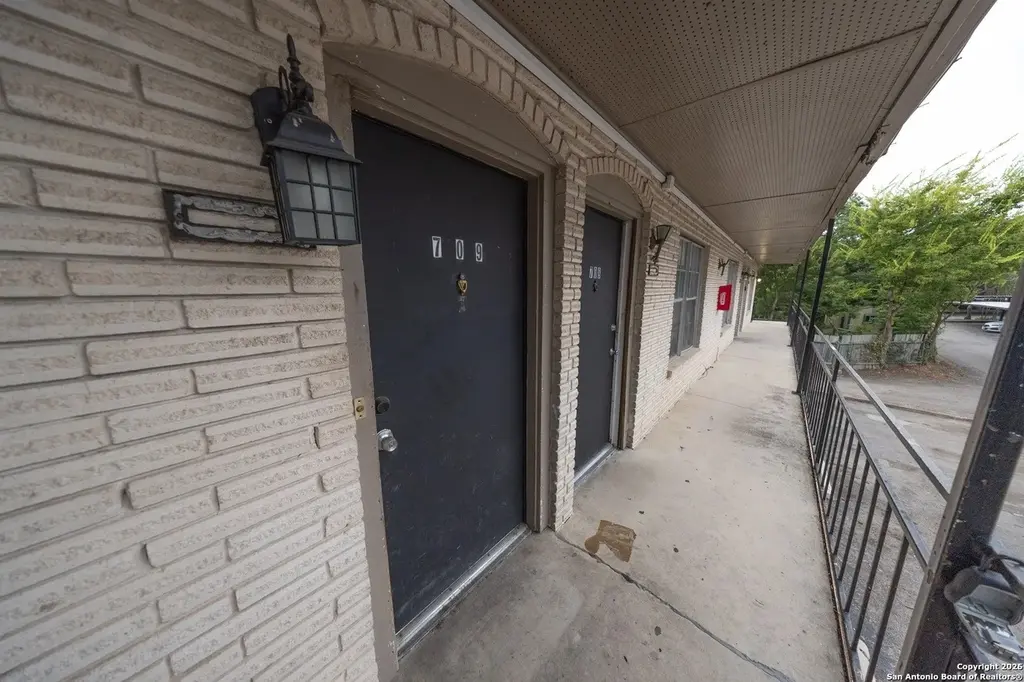
170 De Chantle Apt 709 · San Antonio, TX
Flood risk 1/10 · Minimal
- FEMA flood zone
- X (unshaded)
- Chance of flooding over 30 yrs
- 0.0%
- Est. flood insurance / yr
- $507 – $1,088
Fire risk 1/10 · Minimal
- Est. fire insurance / yr
- $1,222 – $2,270
Heat risk 8/10 · Major
- Hot days now (above 108°F)
- 7 days/yr
- Hot days in 30 yrs
- 22 days/yr
Wind risk 6/10 · Moderate
- Chance of severe wind over 30 yrs
- 71.0%
Air-quality risk 2/10 · Minimal
- Unhealthy air days now
- 1 days/yr
- Unhealthy air days in 30 yrs
- 1 days/yr
Risk factors via First Street. Map © Google.
Why this score? — see what drove the B+ grade
The composite is a weighted blend of 9 inputs, each scored 0–100. Each bar is that input's sub-score; the figure is the points it added to the 100-point composite (weight × sub-score).
- Cash flow +30.0/30.0
- ARV discount +15.0/15.0
- 1% rule +10.0/10.0
- DSCR +10.0/10.0
- Livability +4.0/5.0
- Rent growth +3.2/5.0
- Condition / age +2.5/5.0
- Schools +1.4/10.0
- Appreciation +0.0/10.0
$42,500
🖨 Deal sheet (PDF) 📄 Offer letter ✓ Due diligence
Listing remarks MLS
Fantastic value-add multifamily opportunity in San Antonio! Located at 170 De Chantle, this property features 10 total units consisting of a mix of studio and 1-bed / 1-bath units. Several units are currently vacant, providing immediate upside for an investor to renovate, lease up, and increase cash flow. A recent lease was signed at $750/month, helping confirm current market rent potential. Priced at $45,000 per unit, this asset offers an attractive entry point with room to stabilize and grow income. Whether you're adding to your portfolio or getting started in multifamily, this property presents an excellent opportunity to increase NOI and build long-term equity.
Key facts
- $200 HOA
- Community pool
- Built 1969
Neighborhood map
What this means for you Summary
Snapshot
- This is a 1-bed/1.0-bath condo listed at $42k.
Deal economics
- At list price, monthly cash flow is $177 ($2k/yr) — positive.
- The deal already cash-flows at list — no discount required.
- Meets the 1% rule at list price ($923 rent vs $42k).
- Recommended offer: $37k (12.0% below list) — sets the bar for market timing.
- Cap rate 11.3% vs local median 3.8% in San Antonio — top-decile yield for the area; either an underpriced asset or a hidden risk that comps aren't pricing in. Stress-test before assuming the spread holds.
Location & tenants
- Location reads 80/100 on livability (#31 in TX, #1,616 nationally) — a professional / high-income tenant draw. Strengths: amenities A+, commute A+, cost of living A+; Watch: schools C-, crime F.
- San Antonio ISD (urban): math 12% / reading 22% proficiency, ranked #805 of 826 in TX (top 98%) — low school quality limits family demand, transient renter base, plan for 1-2y turnover; 80% free/reduced lunch — lower-income household profile, screen leases tightly.
- Market conditions: Rents rising (+2.8%/yr); 172 active listings in the ZIP; 40 comparable units currently listed for rent nearby; rentals at typical pace (median 25d on market — plan ~3-4 weeks tenant-placement turnaround); 45% of comp listings sitting > 30 days — soft ceiling on asking rent; 8,308 units permitted in Bexar County in 2024 (2,506 in 5+ unit buildings).
Forward outlook
- Local home prices are declining (-3.0%/yr); year-one equity from $294 of loan paydown is wiped out by about $1k of value loss. Plan a longer hold.
- Bexar County population projected at +50% by 2050 — long-run rental-demand tailwind backs the buy-and-hold thesis.
- At projected returns (-3.0% appreciation + 2.8% rent growth), your $12k cash investment doubles in ~7 years — after that, you're playing with house money.
Negotiation context
- It's been on market 163 days — a 12% lower offer ($37k) is reasonable based on typical stale-listing flexibility.
- 2 sale attempts; this cycle's ask has dropped $2k (6%) from the opening price — seller is motivated, your offer sets the floor, not the list.
Risks & watch-outs
- Watch-outs: property tax is 3.1% of price; HOA is 22% of rent.
- Climate carrying-cost: major wind risk, 71% chance of damaging wind over 30y; extreme-heat days projected 7→22/yr by 2055 (HVAC capex compounding) — expect insurance premiums to compound above CPI over the hold.
Questions for the listing agent
- It's been on market 163 days. Have you received any prior offers? Is the seller open to a 12% concession, seller financing, or rate buy-down credit?
- Built in 1969 — when were the roof, HVAC, electrical panel, plumbing, and water heater last replaced?
- Property tax is high relative to price — has the assessment been appealed recently, and will the sale trigger a re-assessment?
- What does the HOA fee cover, when was the last increase, and are there any pending special assessments or reserve-fund shortfalls?
- Any open or pending special assessments — roof, HVAC, plumbing, elevator, façade? What's the per-unit balance and payoff schedule, and is the seller paying it off at close or rolling it to the buyer?
- Why hasn't it sold? Are there any deal-killer items the seller is aware of (foundation, flood, title, zoning, code violations)?
- Is there a deadline driving the sale (1031 exchange, divorce, estate, relocation)? That informs how much negotiation room exists.
- Crime grade is F in this area — have there been break-ins, vandalism, or insurance claims at this property in the last 3 years? What carrier currently insures it and at what premium?
- What's the average days-on-market for RENTAL listings here right now (not sales)? A rising rental-DOM trend means longer vacancies and softer asking-rent achievability than the comps imply.
- What's the recent tenant-quality profile in this submarket — average credit score on applications, eviction rate, late-payment / NSF rate, and stable-employment percentage? A property-management company in the area should have these aggregated.
- How much new apartment / multifamily construction is in the pipeline within 1–3 miles? Heavy new supply (>2% of stock underway) typically softens rents 12–24 months out; light construction supports rent growth.
Investment metrics
- 1% rule
- 2.17% ✓
- Cap rate
- 11.29%
- Cash-on-cash
- 17.86%
- DSCR
- 1.79
- GRM
- 3.8
CMA / ARV
- ARV (median comp)
- $64,435
- List price
- $42,500
- Delta
- -34.04%
- Verdict
- UNDERPRICED
- Comps
- 15 within 1.0 mi
Projected returns pro-forma
-3.0% appreciation · 2.82% rent growth · sell at horizon
- IRR
- 9.4%
- Equity multiple
- 1.37×
- Total profit
- $4,399
- Equity at exit
- $6,337
- IRR
- 18.6%
- Equity multiple
- 2.54×
- Total profit
- $18,375
- Equity at exit
- $3,675
Cash invested: $11,900 (down + closing). Projections, not guarantees.
Landlord ↔ Tenant lean methodology
- Overall (STATE)
- 87 Strongly Landlord-Friendly
- State Texas
- 87 Strongly Landlord-Friendly · R+5
- County
- — inherits STATE
- City
- — inherits STATE
ZIP-level market 78201
- Home prices YoY
- -28.4%
- Rents YoY
- 2.8%
- Active inventory
- 172
- Price-to-rent
- 3.8×
Monthly cashflow live
- Estimated rent
- $923 high interval (Pro) →
- Mortgage (P&I)
- −$223
- Tax from tax record
- −$111 /mo · $1,335/yr
- Insurance
- −$18
- HOA
- −$200
- Vacancy / Maint / Mgmt
- −$194
- Net cashflow
- $177
Break-even live
Sensitivity live
| Price | -10% $201 | -5% $189 | +0% $177 | +5% $165 | +10% $153 |
|---|---|---|---|---|---|
| Rent | -10% $104 | -5% $141 | +0% $177 | +5% $214 | +10% $250 |
| Rate | -1.0pp $199 | -0.5pp $188 | base $177 | +0.5pp $166 | +1.0pp $155 |
UW: 25.0% down · 7.5% · 30yr · 1.5% tax · 5.0% vac · 8.0% maint · 8.0% mgmt
Financing live
Cash to close
- Down payment
- $10,625
- Closing costs
- $1,275
- Reserves months
- —
- Total cash needed
- —
Loan-product check · same deal, 3 products live
Conventional
25% down · 7.5% · 30yr
- Down + closing
- —
- Monthly P&I
- —
- Monthly cashflow
- —
- DSCR
- —
- Eligible?
- —
Personal DTI + credit; lowest rate.
DSCR
20% down · 8.5% · 30yr
- Down + closing
- —
- Monthly P&I
- —
- Monthly cashflow
- —
- DSCR
- —
- Eligible?
- —
No personal income docs; deal must DSCR.
Hard money
10% down · 12.0% · 12mo
- Down + closing
- —
- Monthly P&I
- —
- Monthly cashflow
- —
- DSCR
- —
- Eligible?
- —
Short-term bridge; refi at stabilization.
Rent comps 40 comps
| Address | Beds | Baths | Sqft | Rent | $/sqft | DOM | Units | Dist |
|---|---|---|---|---|---|---|---|---|
| 170 De Chantle Rd San Antonio, TX | 1.0 | 1.0 | 606 | $1,316 | $2.17 | 17d | 2 | 0.03mi |
| 170 De Chantle Rd San Antonio, TX | 1.0 | 1.0 | 579 | $1,634 | $2.82 | 44d | 1 | 0.03mi |
| 158 De Chantle Rd Unit 129 San Antonio, TX | 1.0 | 1.0 | 625 | $950 | $1.52 | 44d | 1 | 0.09mi |
| 158 De Chantle Rd San Antonio, TX | 1.0 | 1.0 | 625 | $950 | $1.52 | 5d | 4 | 0.10mi |
| 135 De Chantle Rd Unit 215 San Antonio, TX | 1.0 | 1.0 | 580 | $890 | $1.53 | 44d | 1 | 0.12mi |
| 3939 Fredericksburg Rd San Antonio, TX | 1.0 | 1.0 | 385 | $775 | $2.01 | 3d | 1 | 0.34mi |
| 1400 Gardina St San Antonio, TX | 1.0–2.0 | 1.0 | 620 | $745 | $1.20 | 44d | 2 | 0.36mi |
| 923 Vance Jackson Rd San Antonio, TX | 1.0–2.0 | 1.0 | 737 | $750 | $1.02 | 20d | 2 | 0.48mi |
| 4210 Fredericksburg Rd San Antonio, TX | 2.0 | 1.0–2.0 | 687 | $659 | $0.96 | 2d | 55 | 0.55mi |
| 923 Vance Jackson Rd #1301 San Antonio, TX | 1.0 | 1.0 | 739 | $775 | $1.05 | 24d | 1 | 0.56mi |
| 4216 Fredericksburg Rd Balcones Heights, TX | 1.0 | 1.0 | 500 | $949 | $1.90 | 44d | 1 | 0.58mi |
| 346 Leming Dr Unit A San Antonio, TX | 1.0 | 1.0 | 460 | $795 | $1.73 | 44d | 1 | 0.62mi |
| 140 Babcock Rd San Antonio, TX | 1.0–3.0 | 1.0–2.0 | 851 | $825 | $0.97 | 44d | 6 | 0.66mi |
| 516 Gentleman Rd San Antonio, TX | 1.0 | 1.0 | 685 | $750 | $1.09 | 11d | 1 | 0.72mi |
| 516 Gentleman Rd Unit 15 Balcones Heights, TX | 1.0 | 1.0 | 685 | $750 | $1.09 | 24d | 1 | 0.72mi |
| 4300 Fredericksburg Rd San Antonio, TX | 1.0–2.0 | 1.0 | 682 | $799 | $1.17 | 44d | 1 | 0.73mi |
| 600 Gentleman Rd San Antonio, TX | 1.0 | 1.0 | 640 | $875 | $1.37 | 44d | 1 | 0.82mi |
| 600 Gentleman Rd San Antonio, TX | 1.0 | 1.0 | 640 | $875 | $1.37 | 24d | 1 | 0.82mi |
| 3815 Ridgeline Dr Unit Upstairs Apartment San Antonio, TX | — | 1.0 | 560 | $750 | $1.34 | 44d | 1 | 0.92mi |
| 844 E Sunshine Dr Unit 401 San Antonio, TX | 2.0 | 1.0 | 640 | $890 | $1.39 | 22d | 1 | 0.93mi |
| 844 E Sunshine Dr Unit 202 San Antonio, TX | 2.0 | 1.0 | 640 | $950 | $1.48 | 5d | 1 | 0.93mi |
| 811 John Adams Dr San Antonio, TX | 2.0 | 1.0 | 720 | $1,025 | $1.42 | 5d | 1 | 0.94mi |
| 4214 Woodmanor Dr Unit 1 San Antonio, TX | 2.0 | 1.0 | 750 | $1,000 | $1.33 | 44d | 1 | 0.96mi |
| 4223 Woodmanor Dr San Antonio, TX | 2.0 | 1.0 | 750 | $1,000 | $1.33 | 13d | 1 | 0.97mi |
| 4223 Woodmanor Dr Unit 1 San Antonio, TX | 2.0 | 1.0 | 750 | $1,000 | $1.33 | 24d | 1 | 0.98mi |
| 3110 Hillcrest Dr San Antonio, TX | 1.0–2.0 | 1.0 | 650 | $808 | $1.24 | 20d | 9 | 0.99mi |
| 1930 W Hermosa Dr San Antonio, TX | 1.0 | 1.0 | 700 | $800 | $1.14 | 24d | 1 | 1.01mi |
| 234 Senisa Dr #3 San Antonio, TX | — | 1.0 | 500 | $795 | $1.59 | 17d | 1 | 1.04mi |
| 3108 Hillcrest Dr San Antonio, TX | 1.0 | 1.0 | 550 | $1,000 | $1.82 | 44d | 1 | 1.04mi |
| 1405 Donaldson Ave Unit 202 San Antonio, TX | 2.0 | 1.0 | 560 | $995 | $1.78 | 44d | 1 | 1.04mi |
| 2903 Hillcrest Dr San Antonio, TX | 1.0–3.0 | 1.0–2.0 | 962 | $699 | $0.73 | 2d | 16 | 1.04mi |
| 3253 Hillcrest Dr Unit TH 238 Balcones Heights, TX | 1.0 | 1.0 | 578 | $740 | $1.28 | 3d | 1 | 1.15mi |
| 3253 Hillcrest Dr Apt 209 Balcones Heights, TX | 1.0 | 1.0 | 558 | $750 | $1.34 | 44d | 1 | 1.15mi |
| 3253 Hillcrest Dr Unit 19-B San Antonio, TX | — | 1.0 | 480 | $735 | $1.53 | 44d | 1 | 1.15mi |
| 3253 Hillcrest Dr Apt 218 Balcones Heights, TX | 1.0 | 1.0 | 510 | $725 | $1.42 | 44d | 1 | 1.15mi |
| 3253 Hillcrest Dr Apt 54B Balcones Heights, TX | — | 1.0 | 480 | $685 | $1.43 | 44d | 1 | 1.15mi |
| 3253 Hillcrest Dr Unit *109 Balcones Heights, TX | 1.0 | 1.0 | 558 | $735 | $1.32 | 3d | 1 | 1.15mi |
| 3253 Hillcrest Dr Unit 18-B Balcones Heights, TX | — | 1.0 | 480 | $685 | $1.43 | 3d | 1 | 1.15mi |
| 1738 Lee Hall St Unit B San Antonio, TX | 1.0 | 1.0 | 525 | $750 | $1.43 | 44d | 1 | 1.21mi |
| 6945 W Interstate 10 San Antonio, TX | 1.0–2.0 | 1.0–2.0 | 672 | $615 | $0.92 | 2d | 11 | 1.23mi |
HOA detail condo
- Monthly dues
- $200 · $2,400/yr
- Assessments
- None detected in remarks — confirm with the listing agent.
Listing history 18 events
-
2026-06-18days on market $42,500 Active 163 DOM
-
2026-06-17days on market $42,500 Active 162 DOM
-
2026-06-16days on market $42,500 Active 161 DOM
-
2026-06-15days on market $42,500 Active 160 DOM
-
2026-06-13days on market $42,500 Active 158 DOM
-
2026-06-09days on market $42,500 Active 154 DOM
-
2026-06-08days on market $42,500 Active 153 DOM
-
2026-06-07days on market $42,500 Active 152 DOM
-
2026-06-04days on market $42,500 Active 149 DOM
-
2026-06-03days on market $42,500 Active 148 DOM
-
2026-06-02days on market $42,500 Active 147 DOM
-
2026-06-01days on market $42,500 Active 146 DOM
-
2026-05-31days on market $42,500 Active 145 DOM
-
2026-02-26price $42,500 677-char remark
Show marketing remark (677 chars)
Fantastic value-add multifamily opportunity in San Antonio! Located at 170 De Chantle, this property features 10 total units consisting of a mix of studio and 1-bed / 1-bath units. Several units are currently vacant, providing immediate upside for an investor to renovate, lease up, and increase cash flow. A recent lease was signed at $750/month, helping confirm current market rent potential. Priced at $45,000 per unit, this asset offers an attractive entry point with room to stabilize and grow income. Whether you're adding to your portfolio or getting started in multifamily, this property presents an excellent opportunity to increase NOI and build long-term equity.
-
2026-01-06$44,999 New 677-char remark
Show marketing remark (677 chars)
Fantastic value-add multifamily opportunity in San Antonio! Located at 170 De Chantle, this property features 10 total units consisting of a mix of studio and 1-bed / 1-bath units. Several units are currently vacant, providing immediate upside for an investor to renovate, lease up, and increase cash flow. A recent lease was signed at $750/month, helping confirm current market rent potential. Priced at $45,000 per unit, this asset offers an attractive entry point with room to stabilize and grow income. Whether you're adding to your portfolio or getting started in multifamily, this property presents an excellent opportunity to increase NOI and build long-term equity.
-
2025-12-30historical
-
2025-10-29price $44,999
-
2025-09-11$50,000 New
ⓘ Source: listings_history table (triggers on properties + properties_extension) + one-shot
backfill from property_details.listing_events for pre-trigger history.
Tax reassessment forecast TX · Resets to sale price
- Current annual tax
- $1,335 · $111/mo
- Projected year-2 tax
- $1,335 · $111/mo
- Expected delta
- $0/yr ($0/mo · 0.0%)
ⓘ Screening estimate from a state-policy table — verify with the county assessor before closing.
Climate risk First Street
- Flood 1/10 Low FEMA zone X (unshaded) · 0% chance over 30 yrs
- Wildfire 1/10 Low
- Heat 8/10 Severe 7 d/yr ≥108°F today · 22 d/yr by 30 yrs out
- Wind 6/10 Major 71% chance of damaging wind over 30 yrs
- Air quality 2/10 Low 1 unhealthy d/yr today · 1 by 30 yrs out
Nearby sold comps map
Loading sold comps map…
Walkable amenities ~0.75 mi
Loading nearby amenities…
Taxation est. · year 1
- Rental income
- $11,073
- − Mortgage interest
- −$2,381
- − Property taxes
- −$1,335
- − Insurance
- −$212
- − Repairs & maintenance
- −$886
- − Management
- −$886
- − HOA
- −$2,400
- − Depreciation
- −$1,236
- Taxable income
- $1,736
- Est. tax owed @ 24.0%
- −$417
- After-tax cash flow
- $1,709/yr
For passive investors: Depreciation is non-cash, so a rental often shows a tax loss while cash-flowing — sheltering income. Rental losses are passive: they offset passive income freely, and up to $25,000/yr can offset ordinary (W-2) income if you actively participate and your MAGI is under $100k (phasing out to $0 by $150k); unused losses carry forward. On sale, claimed depreciation is recaptured at up to 25%, and gains may owe capital-gains tax (a 1031 exchange can defer both). Figures are a year-1 estimate at your 24.0% rate — not tax advice; consult a CPA.
Schools (NCES district)
- District
- San Antonio ISD
- NCES district ID
- 4838730
- Math proficiency
- 12% ▼ -21.00%
- Reading proficiency
- 22% ▼ -7.00%
- Median HH income
- $30,952
- Composite
- 13.57/100
- National rank
- #9512
- State rank
- #805 of 826 in TX
Livability — San Antonio
- Score
- 80/100
- State rank
- #31
- US rank
- #1616
Category grades
Schools grade is shown separately in the Schools card above.
Census & demographics
- Census place
- San Antonio, TX
- County
- Bexar County · 1,990,555 people
- City population
- 1,806,925
- Metro
- San Antonio-New Braunfels, TX
- Population (ZIP)
- 41,981
- Household income
- $47,121
- Rent vs Own
- Severe rent burden
- 2332.0
Population outlook (Bexar County) Hauer SSP2
- Today (2025)
- 2,336,851 people
- By 2030
- 2,560,728 · +9.6%
- By 2040
- 3,020,569 · +29.3%
- By 2050
- 3,493,522 · +49.5%
- By 2075
- 4,668,459 · +99.8%
- By 2100
- 5,533,242 · +136.8%
Race, ethnicity, and origin ACS 2023
- Neighborhood character
- Predominantly Hispanic (83%)
- Race & ethnicity
- Hispanic / Latino 83% Two or more races 51% White 13% Black 2% Native American 1%
- Hispanic origin (detail)
- Mexican 71%
- Common ancestry
- Arab 1% Lithuanian 1% Slovak 1%
- Foreign-born
- 22% · Canada
- Languages at home
- 43% English-only · Spanish 54% Arabic 1%
Political lean MEDSL · Bexar
- 2024 margin
- Lean D (+9.8) · D 54.3% · R 44.6% · Other 1.1%
- 2008→2024 swing
- +4.2pp toward D · 2008: 5.6pp · 2024: 9.8pp
- All cycles
- 2024: D+9.8 2020: D+18.2 2016: D+13.5 2012: D+4.6 2008: D+5.6
Not yet ingested
- Civics
- —
Market trends
- HPI YoY
- ▼ -103.07%
- Current HPI
- 259.9918
- Rent YoY
- ▲ 2.82%
- Metro
- San Antonio-New Braunfels, TX
- State GDP YoY
- ▲ 3.95%
- F500 in state
- 110
Industry mix (Fortune 500 HQ in TX)
| Industry | F500 HQs | Revenue |
|---|---|---|
| Energy | 16 | $1,198B |
|
||
| Technology | 5 | $198B |
|
||
| Engineering / Construction | 4 | $72B |
|
||
| Energy Services | 3 | $60B |
|
||
| Utilities | 3 | $41B |
|
||
| Healthcare | 2 | $330B |
|
||
Price history
-15.0% since first listed5 events — show timeline
- 2026-02-26 Price Changed $42,500 LERA
- 2026-01-06 Listed $44,999 LERA
- 2025-12-30 Listing Removed — LERA
- 2025-10-29 Price Changed $44,999 LERA
- 2025-09-11 Listed $50,000 LERA
Property tax history
+6.2%/yrLatest (2025): $1,335 · -7.7% YoY. Source: county tax records.
Cash-flow waterfall
monthlySold comps — $/sqft
last 12 mo · ≤1 miLoading sold comps…