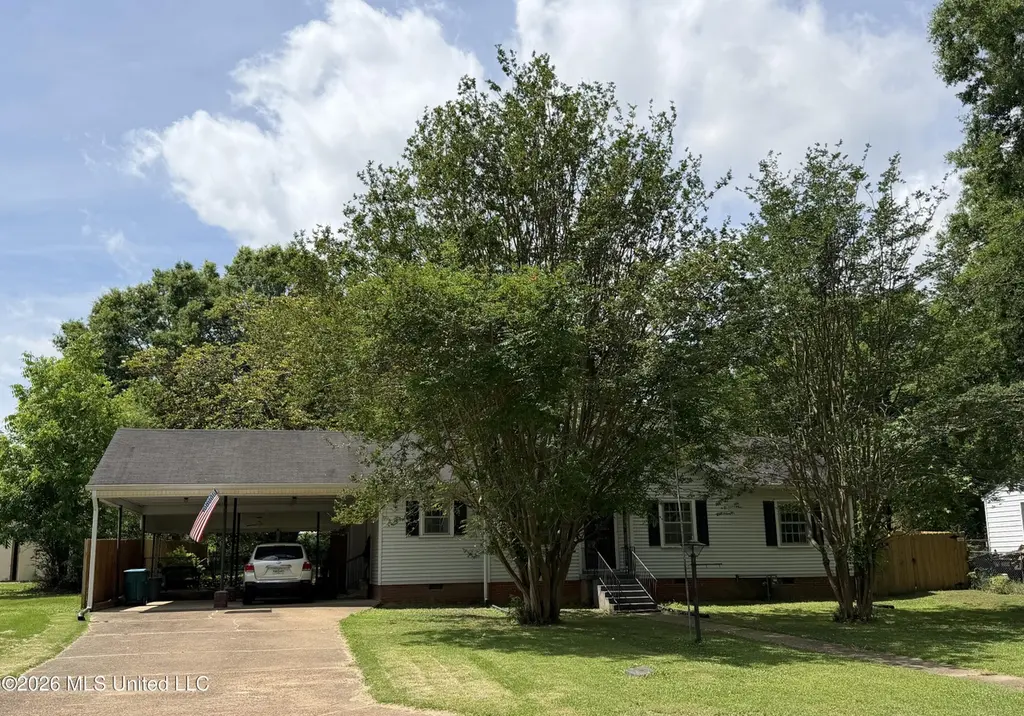
323 Hightower St · Sardis, MS
Flood risk 1/10 · Minimal
- FEMA flood zone
- X (unshaded)
- Chance of flooding over 30 yrs
- 0.0%
- Est. flood insurance / yr
- $507 – $1,088
Fire risk 5/10 · Moderate
- Est. fire insurance / yr
- $1,241 – $2,305
Heat risk 7/10 · Major
- Hot days now (above 109°F)
- 7 days/yr
- Hot days in 30 yrs
- 21 days/yr
Wind risk 5/10 · Moderate
- Chance of severe wind over 30 yrs
- 26.0%
Air-quality risk 2/10 · Minimal
- Unhealthy air days now
- 1 days/yr
- Unhealthy air days in 30 yrs
- 1 days/yr
Risk factors via First Street. Map © Google.
Why this score? — see what drove the C+ grade
The composite is a weighted blend of 9 inputs, each scored 0–100. Each bar is that input's sub-score; the figure is the points it added to the 100-point composite (weight × sub-score).
- Cash flow +30.0/30.0
- DSCR +10.0/10.0
- 1% rule +8.5/10.0
- ARV discount +7.5/15.0
- Livability +3.0/5.0
- Rent growth +2.5/5.0
- Condition / age +2.5/5.0
- Schools +0.4/10.0
- Appreciation +0.0/10.0
$144,900
🖨 Deal sheet 📄 Offer letter ✓ Due diligence
Listing remarks
Great little find in Sardis! Home is move- in ready and has been recently remodeled to include a new furnace, stainless steel appliances, disposal, luxury vinyl floors, lights/fans, faucets, gutters, and new gorgeous Fence that is Shadow box style- and much more as well! The backyard on this house is awesome(huge) and totally fenced, has a massive Magnolia tree, Shed /Workship with covered area. Has a 2 car carport with a covered sitting area attached which makes it so relaxing! Exterior- is brick and Vinyl Siding for low maintenance, ,, ,, ,, ,Want to go fishing? This house is located a few miles from Sardis Dam! It is MOVE IN READY-- Cute as a button and well taken care of!
Key facts
- New furnace
- Shed workshop
- New gorgeous fence
Tags
Property features AI
Exterior
- Parking: Covered carport (2 spaces)
- Utilities: Public water; Public sewer; Electricity connected; Natural gas connected; Cable connected
- Home design: Single-family house; One level
- Construction: Vinyl and brick exterior; Asphalt roof; Conventional foundation; Built in public records (year built source: public records)
- Exterior features: Private yard; Rain gutters; Fenced yard (wood privacy fencing); Landscaped, level lot; Shed(s)
Interior
- Kitchen: Dishwasher; Disposal; Free-standing gas range; Refrigerator; Stainless steel appliances
- Flooring: Luxury vinyl; Vinyl and brick construction (interior finishes may vary)
- Bathrooms: 2 full bathrooms
- Heating & cooling: Central heating (natural gas); Central air conditioning (electric)
- Interior features: Dishwasher; Disposal; Free-standing gas range; Gas water heater; Refrigerator; Stainless steel appliances
Neighborhood map
What this means for you Summary
Snapshot
- This is a 4-bed/2.0-bath single-family listed at $145k.
Deal economics
- At list price, monthly cash flow is $539 ($6k/yr) — positive.
- The deal already cash-flows at list — no discount required.
- Meets the 1% rule at list price ($2k rent vs $145k).
- Recommended offer: $143k (1.5% below list) — sets the bar for market timing.
Location & tenants
- Location reads 59/100 on livability (#235 in MS) — a working-class tenant base; expect higher turnover. Strengths: crime A+, cost of living A+, housing B+; Watch: health & safety D+, amenities F, commute F.
- North Panola School District (rural): math 2% / reading 8% proficiency, ranked #129 of 130 in MS (top 99%) — low school quality limits family demand, transient renter base, plan for 1-2y turnover; 94% free/reduced lunch — lower-income household profile, screen leases tightly.
- Zoned schools: North Panola Middle School (math 4% / reading 10%, grade F, #170 of 179 statewide, top 95%, 281 students, 100% FRL).
- Market conditions: 24 active listings in the ZIP; 1 comparable units currently listed for rent nearby; 10 units permitted in Panola County in 2024 (0 in 5+ unit buildings).
Forward outlook
- Local home prices are declining (-3.0%/yr); year-one equity from $1k of loan paydown is wiped out by about $4k of value loss. Plan a longer hold.
- Panola County population projected at -20% by 2050 — secular population decline; favor cash flow + early exit over multi-decade hold.
- At projected returns (-3.0% appreciation + 3.0% rent growth), your $41k cash investment doubles in ~8 years — after that, you're playing with house money.
Negotiation context
- It's been on market 15 days — a 2% lower offer ($143k) is reasonable based on typical stale-listing flexibility.
Risks & watch-outs
- Watch-outs: built in 1955 — expect roof / HVAC / electrical / plumbing capex.
- Climate carrying-cost: moderate wind risk, 26% chance of damaging wind over 30y; moderate wildfire risk; extreme-heat days projected 7→21/yr by 2055 (HVAC capex compounding) — expect insurance premiums to compound above CPI over the hold.
Questions for the listing agent
- Built in 1955 — when were the roof, HVAC, electrical panel, plumbing, and water heater last replaced?
- Is there a deadline driving the sale (1031 exchange, divorce, estate, relocation)? That informs how much negotiation room exists.
- Schools are F-rated, which usually means shorter tenancies and higher turnover. Who's the typical renter profile here, and what's been the actual vacancy rate?
- What's the average days-on-market for RENTAL listings here right now (not sales)? A rising rental-DOM trend means longer vacancies and softer asking-rent achievability than the comps imply.
- What's the recent tenant-quality profile in this submarket — average credit score on applications, eviction rate, late-payment / NSF rate, and stable-employment percentage? A property-management company in the area should have these aggregated.
- How much new for-sale + rental construction is in the pipeline within 1–3 miles? Heavy new supply typically softens prices + rents 12–24 months out; constrained supply supports both.
Investment metrics
- 1% rule
- 1.35% ✓
- Cap rate
- 10.76%
- Cash-on-cash
- 15.95%
- DSCR
- 1.71
- GRM
- 6.2
CMA / ARV
- ARV (on-the-fly)
- $83,292
- Comps found
- 2
Show comp detail 2 sales within ~0.75 mi
| Address | Dist | Beds/Ba | Sqft | Sold | Price | $/sf | Match |
|---|---|---|---|---|---|---|---|
| 108 E E. Lee St | 0.35mi | 3/1.5 (-1) | 1,320 (+5%) | 10mo | $60,000 | $45 | 61 |
| 507 Franklin St | 0.60mi | 3/1.5 (-1) | 1,370 (+9%) | 19mo | $90,000 | $66 | 35 |
Match score weights: distance 35% · size 25% · config 20% · recency 20%. Top-matched comps best support the ARV.
Projected returns pro-forma
-3.0% appreciation · 3.0% rent growth · sell at horizon
- IRR
- 6.9%
- Equity multiple
- 1.27×
- Total profit
- $10,887
- Equity at exit
- $21,605
- IRR
- 16.2%
- Equity multiple
- 2.33×
- Total profit
- $53,814
- Equity at exit
- $12,528
Cash invested: $40,572 (down + closing). Projections, not guarantees.
Landlord ↔ Tenant lean methodology
- Overall (STATE)
- 90 Strongly Landlord-Friendly
- State Mississippi
- 90 Strongly Landlord-Friendly · R+11
- County
- — inherits STATE
- City
- — inherits STATE
ZIP-level market 38666
- Home prices YoY
- -8.3%
- Active inventory
- 24
- Price-to-rent
- 6.2×
Monthly cashflow live
- Estimated rent
- $1,950 medium interval (Pro) →
- Mortgage (P&I)
- −$760
- Tax est. 1.5%
- −$181 /mo · $2,174/yr
- Insurance
- −$60
- HOA
- −$0
- Vacancy / Maint / Mgmt
- −$410
- Net cashflow
- $539
Break-even live
UW: 25.0% down · 7.5% · 30yr · 1.5% tax · 5.0% vac · 8.0% maint · 8.0% mgmt
Financing live
Cash to close
- Down payment
- $36,225
- Closing costs
- $4,347
- Reserves months
- —
- Total cash needed
- —
Loan-product check · same deal, 3 products live
Conventional
25% down · 7.5% · 30yr
- Down + closing
- —
- Monthly P&I
- —
- Monthly cashflow
- —
- DSCR
- —
- Eligible?
- —
Personal DTI + credit; lowest rate.
DSCR
20% down · 8.5% · 30yr
- Down + closing
- —
- Monthly P&I
- —
- Monthly cashflow
- —
- DSCR
- —
- Eligible?
- —
No personal income docs; deal must DSCR.
Hard money
10% down · 12.0% · 12mo
- Down + closing
- —
- Monthly P&I
- —
- Monthly cashflow
- —
- DSCR
- —
- Eligible?
- —
Short-term bridge; refi at stabilization.
Rent comps 1 comps
| Address | Beds | Baths | Sqft | Rent | $/sqft | DOM | Units | Dist |
|---|---|---|---|---|---|---|---|---|
| 106 E Lee St Sardis, MS | 3.0 | 2.0 | 1530 | $1,950 | $1.27 | 23d | 1 | 0.36mi |
Listing history 7 events
-
2026-06-07statusdays on market $144,900 Pending 15 DOM
-
2026-06-05days on market $144,900 Active 14 DOM
-
2026-06-02days on market $144,900 Active 12 DOM
-
2026-06-01days on market $144,900 Active 11 DOM
-
2026-05-31days on market $144,900 Active 10 DOM
-
2026-05-30days on market $144,900 Active 9 DOM
-
2026-05-21$144,900 Active
ⓘ Source: listings_history table (triggers on properties + properties_extension) + one-shot
backfill from property_details.listing_events for pre-trigger history.
Climate risk First Street
- Flood 1/10 Low FEMA zone X (unshaded) · 0% chance over 30 yrs
- Wildfire 5/10 Major
- Heat 7/10 Severe 7 d/yr ≥109°F today · 21 d/yr by 30 yrs out
- Wind 5/10 Major 26% chance of damaging wind over 30 yrs
- Air quality 2/10 Low 1 unhealthy d/yr today · 1 by 30 yrs out
Nearby sold comps map
Loading sold comps map…
Walkable amenities ~0.75 mi
Loading nearby amenities…
Taxation est. · year 1
- Rental income
- $23,400
- − Mortgage interest
- −$8,117
- − Property taxes
- −$2,174
- − Insurance
- −$724
- − Repairs & maintenance
- −$1,872
- − Management
- −$1,872
- − Depreciation
- −$4,215
- Taxable income
- $4,426
- Est. tax owed @ 24.0%
- −$1,062
- After-tax cash flow
- $5,407/yr
For passive investors: Depreciation is non-cash, so a rental often shows a tax loss while cash-flowing — sheltering income. Rental losses are passive: they offset passive income freely, and up to $25,000/yr can offset ordinary (W-2) income if you actively participate and your MAGI is under $100k (phasing out to $0 by $150k); unused losses carry forward. On sale, claimed depreciation is recaptured at up to 25%, and gains may owe capital-gains tax (a 1031 exchange can defer both). Figures are a year-1 estimate at your 24.0% rate — not tax advice; consult a CPA.
Schools (NCES district)
- District
- North Panola School District
- NCES district ID
- 2803210
- Math proficiency
- 2% ▼ -35.00%
- Reading proficiency
- 8% ▼ -11.00%
- Median HH income
- $32,344
- Composite
- 3.77/100
- National rank
- #10066
- State rank
- #129 of 130 in MS
Livability — Sardis
- Score
- 59/100
- State rank
- #235
- US rank
- #19654
Category grades
Schools grade is shown separately in the Schools card above.
Census & demographics
- Census place
- Sardis, MS
- Population (ZIP)
- 6,258
Population outlook (Panola County) Hauer SSP2
- Today (2025)
- 32,645 people
- By 2030
- 31,477 · -3.6%
- By 2040
- 28,894 · -11.5%
- By 2050
- 26,108 · -20.0%
- By 2075
- 19,292 · -40.9%
- By 2100
- 12,787 · -60.8%
Race, ethnicity, and origin ACS 2023
- Neighborhood character
- Majority Black (54%)
- Race & ethnicity
- Black 54% White 42% Two or more races 4%
- Common ancestry
- Lithuanian 3% Serbian 1% Iranian 1%
- Languages at home
- 99% English-only · Spanish 1%
Political lean MEDSL · Panola
- 2024 margin
- R (+14.8) · D 42.0% · R 56.9% · Other 1.1%
- 2008→2024 swing
- -21.4pp toward R · 2008: 6.5pp · 2024: -14.8pp
- All cycles
- 2024: R+14.8 2020: R+4.2 2016: R+0.5 2012: D+8.6 2008: D+6.5
Not yet ingested
- Civics
- —
Market trends
- HPI YoY
- ▼ -17.45%
- Current HPI
- 192.5985
- Rent YoY
- —
- Metro
- —
- State GDP YoY
- —
- F500 in state
- 0
Price history
1 event — show timeline
- 2026-05-21 Listed $144,900 MLSU
Cash-flow waterfall
monthlySold comps — $/sqft
last 12 mo · ≤1 miLoading sold comps…