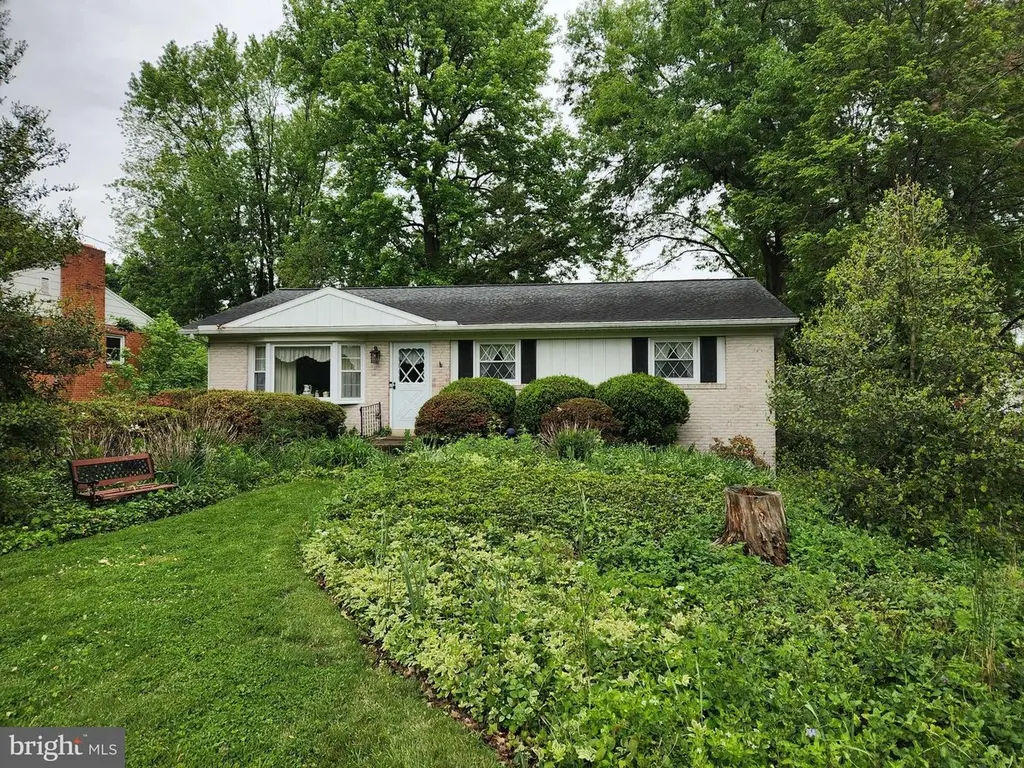
1519 Vista Rd · Manheim, PA
Flood risk 8/10 · Major
- FEMA flood zone
- X (unshaded)
- Chance of flooding over 30 yrs
- 0.99%
- Est. flood insurance / yr
- $473 – $860
Fire risk 1/10 · Minimal
- Est. fire insurance / yr
- $511 – $949
Heat risk 6/10 · Moderate
- Hot days now (above 101°F)
- 7 days/yr
- Hot days in 30 yrs
- 15 days/yr
Wind risk 4/10 · Minor
- Chance of severe wind over 30 yrs
- 18.0%
Air-quality risk 4/10 · Minor
- Unhealthy air days now
- 4 days/yr
- Unhealthy air days in 30 yrs
- 6 days/yr
Risk factors via First Street. Map © Google.
Why this score? — see what drove the D+ grade
The composite is a weighted blend of 9 inputs, each scored 0–100. Each bar is that input's sub-score; the figure is the points it added to the 100-point composite (weight × sub-score).
- ARV discount +15.0/15.0
- Cash flow +11.4/30.0
- Schools +5.3/10.0
- Livability +4.0/5.0
- Rent growth +3.5/5.0
- 1% rule +3.4/10.0
- DSCR +3.3/10.0
- Condition / age +2.5/5.0
- Appreciation +0.0/10.0
$300,000
🖨 Deal sheet (PDF) 📄 Offer letter ✓ Due diligence
Listing remarks
This property will be offered at Public Auction on Monday, July 13, 2026 @ 6pm. The listing price is the opening bid only and in no way reflects the final sale price. 10% down due at auction, 2% transfer tax to be paid by the purchaser, real estate taxes prorated. This Manheim Township home offers a spacious and functional layout with plenty of room for everyday living and entertainment. The main floor features a bright living room, eat-in kitchen, dining room, comfortable family room with access to the deck, four bedrooms, and two full bathrooms. The lower level offers additional versatile living space with a large family room, convenient mudroom/entryway, dedicated laundry room, and a sun
Key facts
- 0.3 acre lot
- 2 garage spots
- Built 1963
Property features AI
Exterior
- Parking: Basement garage with rear entry; Two attached garage spaces; Driveway with two spaces; Total of four parking spaces
- Utilities: Public water; Public sewer; Electric hot water; Natural gas heating; Municipal trash service
- Home design: Detached single-family home; Average condition
- Construction: Brick and masonry construction; Composite/shingle roof; Permanent foundation; Built (year source: assessor)
- Exterior features: Porches including screened porch; Detached structure (detached dwelling)
Interior
- Kitchen: Eat-in kitchen
- Bedrooms: Four bedrooms on the main level
- Flooring: Carpet; Ceramic tile; Hardwood
- Bathrooms: Two full bathrooms (main level)
- Heating & cooling: Hot water heating (natural gas); Window air conditioning units (electric)
- Interior features: Stall shower and tub/shower; Chair railings; Formal separate dining room; Eat-in kitchen; Paneled walls; Partially finished basement with outside entrance and walkout level
- Laundry & utility: Basement laundry
Neighborhood map
What this means for you Summary
Snapshot
- This is a 3-bed/1.5-bath single-family listed at $300k.
Deal economics
- At list price, monthly cash flow is $-158 ($-2k/yr) — negative.
- To cash-flow at today's rent, offer at most $272k (9.3% below list).
- To meet the 1% rule (rent ≥ 1% of price), the offer needs to be $252k (16.1% below list).
- Recommended offer: $252k (16.1% below list) — sets the bar for 1% rule.
- Cap rate 5.9% vs local median 1.5% in Manheim — top-decile yield for the area; either an underpriced asset or a hidden risk that comps aren't pricing in. Stress-test before assuming the spread holds.
Location & tenants
- Location reads 79/100 on livability (#236 in PA, #2,155 nationally) — a middle-class / working-renter tenant base. Strengths: cost of living A+, housing A+, health & safety A+; Watch: amenities D+, commute F.
- Manheim Township SD (suburban): math 53% / reading 68% proficiency, ranked #61 of 539 in PA (top 11%) — acceptable for families but not a draw, mixed tenant base, ~2y average lease.
- Zoned schools: Nitrauer Sch (math 67% / reading 77%, grade A-, #123 of 1,518 statewide, top 9%, 466 students, 33% FRL); Manheim Twp Ms (math 34% / reading 63%, grade C-, #146 of 512 statewide, top 30%, 955 students, 32% FRL); Manheim Twp Hs (math 81% / reading 24%, grade C-, #107 of 437 statewide, top 25%, 1,899 students, 29% FRL).
- Market conditions: Rents rising (+4.0%/yr); 327 active listings in the ZIP; 3 comparable units currently listed for rent nearby; rentals lingering (median 46d on market — plan ~5-8 weeks vacancy on turnover, expect pricing pressure); 100% of comp listings sitting > 30 days — soft ceiling on asking rent; solid renter incomes; 1,093 units permitted in Lancaster County in 2024 (201 in 5+ unit buildings).
Forward outlook
- Local home prices are declining (-3.0%/yr); year-one equity from $2k of loan paydown is wiped out by about $9k of value loss. Plan a longer hold.
- Lancaster County population projected at +5% by 2050 — modest demand growth; plan on rents tracking national, not racing it.
Negotiation context
- It's been on market 16 days — a 2% lower offer ($296k) is reasonable based on typical stale-listing flexibility.
Risks & watch-outs
- Watch-outs: flood insurance adds $56/mo.
- Climate carrying-cost: severe flood risk; extreme-heat days projected 7→15/yr by 2055 (HVAC capex compounding) — expect insurance premiums to compound above CPI over the hold.
Questions for the listing agent
- What do current leases actually rent for vs. the listed asking? Can we see a recent rent roll and the last 12 months of T-12 income?
- Built in 1963 — when were the roof, HVAC, electrical panel, plumbing, and water heater last replaced?
- What's the actual annual flood-insurance premium (NFIP or private), and is the property in a SFHA with mandatory coverage?
- Is there a deadline driving the sale (1031 exchange, divorce, estate, relocation)? That informs how much negotiation room exists.
- Schools are B-rated — typically a magnet for longer-tenancy family renters. What's the average tenant stay here, and is there a school-zone premium baked into asking?
- The area grade is low — what's the realistic commute time and amenity access for the typical tenant pool here? Any planned neighborhood developments (good or bad) we should know about?
- What's the average days-on-market for RENTAL listings here right now (not sales)? A rising rental-DOM trend means longer vacancies and softer asking-rent achievability than the comps imply.
- What's the recent tenant-quality profile in this submarket — average credit score on applications, eviction rate, late-payment / NSF rate, and stable-employment percentage? A property-management company in the area should have these aggregated.
- How much new for-sale + rental construction is in the pipeline within 1–3 miles? Heavy new supply typically softens prices + rents 12–24 months out; constrained supply supports both.
Investment metrics
- 1% rule
- 0.84% ✗
- Cap rate
- 5.88%
- Cash-on-cash
- -1.46%
- DSCR
- 0.93
- GRM
- 9.9
CMA / ARV
- ARV (on-the-fly)
- $450,993
- Comps found
- 10
Show comp detail 10 sales within ~0.75 mi
| Address | Dist | Beds/Ba | Sqft | Sold | Price | $/sf | Match |
|---|---|---|---|---|---|---|---|
| 1800 N Eden Rd | 0.08mi | 4/2.5 (+1) | 1,925 (+2%) | 4mo | $460,000 | $239 | 81 |
| 1365 Sunset Dr | 0.32mi | 3/2.0 | 1,904 (+1%) | 1mo | $625,000 | $328 | 81 |
| 1774 Sammar Rd | 0.06mi | 3/1.5 | 1,717 (-9%) | 10mo | $360,000 | $210 | 74 |
| 1562 Vista Rd | 0.08mi | 3/2.5 | 2,098 (+11%) | 4mo | $425,000 | $203 | 71 |
| 1644 Euclid Dr | 0.19mi | 3/1.5 | 2,006 (+6%) | 18mo | $350,000 | $174 | 66 |
| 1550 Euclid Dr | 0.05mi | 3/2.0 | 1,612 (-15%) | 8mo | $415,000 | $257 | 64 |
| 1909 Northbrook Dr | 0.32mi | 4/2.5 (+1) | 2,040 (+8%) | 8mo | $415,000 | $203 | 56 |
| 1451 New Holland Pike | 0.68mi | 4/2.0 (+1) | 2,004 (+6%) | 1mo | $435,000 | $217 | 50 |
| 2017 Northbrook Dr | 0.45mi | 4/2.5 (+1) | 2,016 (+7%) | 12mo | $506,000 | $251 | 48 |
| 1480 Mission Rd | 0.57mi | 4/2.5 (+1) | 2,011 (+7%) | 24mo | $485,000 | $241 | 34 |
Match score weights: distance 35% · size 25% · config 20% · recency 20%. Top-matched comps best support the ARV.
Projected returns pro-forma
-3.0% appreciation · 3.99% rent growth · sell at horizon
- IRR
- -18.9%
- Equity multiple
- 0.33×
- Total profit
- $-56,058
- Equity at exit
- $44,731
- IRR
- -9.4%
- Equity multiple
- 0.39×
- Total profit
- $-50,825
- Equity at exit
- $25,939
Cash invested: $84,000 (down + closing). Projections, not guarantees.
Landlord ↔ Tenant lean methodology
- Overall (STATE)
- 62 Landlord-Friendly
- State Pennsylvania
- 62 Landlord-Friendly · EVEN
- County
- — inherits STATE
- City
- — inherits STATE
ZIP-level market 17601
- Rents YoY
- 4.0%
- Active inventory
- 327
- Price-to-rent
- 9.9×
Monthly cashflow live
- Estimated rent
- $2,518 medium interval (Pro) →
- Mortgage (P&I)
- −$1,573
- Tax from tax record
- −$394 /mo · $4,725/yr
- Insurance
- −$125
- Flood insurance flood zone
- −$56 /mo · $666/yr
- HOA
- −$0
- Vacancy / Maint / Mgmt
- −$529
- Net cashflow
- $-158
Break-even live
Sensitivity live
| Price | -10% $12 | -5% $-73 | +0% $-158 | +5% $-243 | +10% $-328 |
|---|---|---|---|---|---|
| Rent | -10% $-357 | -5% $-257 | +0% $-158 | +5% $-59 | +10% $41 |
| Rate | -1.0pp $-7 | -0.5pp $-82 | base $-158 | +0.5pp $-236 | +1.0pp $-315 |
UW: 25.0% down · 7.5% · 30yr · 1.5% tax · 5.0% vac · 8.0% maint · 8.0% mgmt
Financing live
Cash to close
- Down payment
- $75,000
- Closing costs
- $9,000
- Reserves months
- —
- Total cash needed
- —
Loan-product check · same deal, 3 products live
Conventional
25% down · 7.5% · 30yr
- Down + closing
- —
- Monthly P&I
- —
- Monthly cashflow
- —
- DSCR
- —
- Eligible?
- —
Personal DTI + credit; lowest rate.
DSCR
20% down · 8.5% · 30yr
- Down + closing
- —
- Monthly P&I
- —
- Monthly cashflow
- —
- DSCR
- —
- Eligible?
- —
No personal income docs; deal must DSCR.
Hard money
10% down · 12.0% · 12mo
- Down + closing
- —
- Monthly P&I
- —
- Monthly cashflow
- —
- DSCR
- —
- Eligible?
- —
Short-term bridge; refi at stabilization.
Rent comps 3 comps
| Address | Beds | Baths | Sqft | Rent | $/sqft | DOM | Units | Dist |
|---|---|---|---|---|---|---|---|---|
| 520 Hedgerow Ln Lancaster, PA | 4.0 | 2.5 | 1834 | $2,900 | $1.58 | 45d | 1 | 1.03mi |
| 862 Pleasure Rd Lancaster, PA | 3.0 | 1.5 | 1707 | $2,300 | $1.35 | 45d | 1 | 1.32mi |
| 1522 Princess Anne Dr Lancaster, PA | 4.0 | 2.0 | 1352 | $2,400 | $1.78 | 45d | 1 | 1.46mi |
Listing history 12 events
-
2026-06-22days on market $300,000 Active 16 DOM
-
2026-06-18days on market $300,000 Active 13 DOM
-
2026-06-17days on market $300,000 Active 12 DOM
-
2026-06-16days on market $300,000 Active 11 DOM
-
2026-06-15days on market $300,000 Active 10 DOM
-
2026-06-14days on market $300,000 Active 8 DOM
-
2026-06-13days on market $300,000 Active 7 DOM
-
2026-06-10days on market $300,000 Active 5 DOM
-
2026-06-09days on market $300,000 Active 4 DOM
-
2026-06-08days on market $300,000 Active 3 DOM
-
2026-06-07remarks 699-char remark
-
2026-06-07$300,000 Active 2 DOM
ⓘ Source: listings_history table (triggers on properties + properties_extension) + one-shot
backfill from property_details.listing_events for pre-trigger history.
Tax reassessment forecast PA · Partial reset (capped growth)
- Current annual tax
- $4,725 · $394/mo
- Projected year-2 tax
- $4,733 · $394/mo
- Expected delta
- +$7/yr (+$1/mo · 0.2%)
ⓘ Screening estimate from a state-policy table — verify with the county assessor before closing.
Climate risk First Street
- Flood 8/10 Severe FEMA zone X (unshaded) · 99% chance over 30 yrs
- Wildfire 1/10 Low
- Heat 6/10 Major 7 d/yr ≥101°F today · 15 d/yr by 30 yrs out
- Wind 4/10 Moderate 18% chance of damaging wind over 30 yrs
- Air quality 4/10 Moderate 4 unhealthy d/yr today · 6 by 30 yrs out
Nearby sold comps map
Loading sold comps map…
Walkable amenities ~0.75 mi
Loading nearby amenities…
Taxation est. · year 1
- Rental income
- $30,221
- − Mortgage interest
- −$16,805
- − Property taxes
- −$4,725
- − Insurance
- −$2,166
- − Repairs & maintenance
- −$2,418
- − Management
- −$2,418
- − Depreciation
- −$8,727
- Taxable loss
- −$7,038
- Est. tax savings @ 24.0%
- +$1,689
- After-tax cash flow
- $-207/yr
For passive investors: Depreciation is non-cash, so a rental often shows a tax loss while cash-flowing — sheltering income. Rental losses are passive: they offset passive income freely, and up to $25,000/yr can offset ordinary (W-2) income if you actively participate and your MAGI is under $100k (phasing out to $0 by $150k); unused losses carry forward. On sale, claimed depreciation is recaptured at up to 25%, and gains may owe capital-gains tax (a 1031 exchange can defer both). Figures are a year-1 estimate at your 24.0% rate — not tax advice; consult a CPA.
Schools (NCES district)
- District
- Manheim Township SD
- NCES district ID
- 4214580
- Math proficiency
- 53% ▼ -10.00%
- Reading proficiency
- 68% ▼ -11.00%
- Median HH income
- $68,335
- Composite
- 53.18/100
- National rank
- #1506
- State rank
- #61 of 539 in PA
Livability — Manheim
- Score
- 79/100
- State rank
- #236
- US rank
- #2155
Category grades
Schools grade is shown separately in the Schools card above.
Census & demographics
- County
- Lancaster County · 390,309 people
- City population
- 23,556
- Metro
- Lancaster, PA
- Population (ZIP)
- 56,382
- Household income
- $102,435
- Rent vs Own
- Severe rent burden
- 1296.0
Population outlook (Lancaster County) Hauer SSP2
- Today (2025)
- 561,011 people
- By 2030
- 570,969 · +1.8%
- By 2040
- 585,929 · +4.4%
- By 2050
- 591,056 · +5.4%
- By 2075
- 594,747 · +6.0%
- By 2100
- 558,850 · -0.4%
Race, ethnicity, and origin ACS 2023
- Neighborhood character
- Predominantly White (78%)
- Race & ethnicity
- White 78% Hispanic / Latino 10% Two or more races 7% Asian 6% Black 4%
- Hispanic origin (detail)
- Puerto Rican 5%
- Common ancestry
- Romanian 5% Slovak 2% Lithuanian 2%
- Foreign-born
- 9% · Canada, Vietnam, China
- Languages at home
- 86% English-only · Spanish 5% Other Indo-European 2% French/Haitian/Cajun 1%
Political lean MEDSL · Lancaster
- 2024 margin
- R (+15.9) · D 41.5% · R 57.5%
- 2008→2024 swing
- -4.1pp toward R · 2008: -11.8pp · 2024: -15.9pp
- All cycles
- 2024: R+15.9 2020: R+15.8 2016: R+19.7 2012: R+19.2 2008: R+11.8
Not yet ingested
- Civics
- —
Market trends
- HPI YoY
- ▼ -383.04%
- Current HPI
- 257.0336
- Rent YoY
- ▲ 3.99%
- Metro
- Lancaster, PA
- State GDP YoY
- ▲ 1.68%
- F500 in state
- 34
Industry mix (Fortune 500 HQ in PA)
| Industry | F500 HQs | Revenue |
|---|---|---|
| Healthcare | 2 | $309B |
|
||
| Insurance | 2 | $27B |
|
||
| Telecommunications / Media | 1 | $124B |
|
||
| Industrial Distribution | 1 | $22B |
|
||
| Financial Services | 1 | $20B |
|
||
| Chemicals / Materials | 1 | $18B |
|
||
Price history
1 event — show timeline
- 2026-06-05 Listed $300,000 BRIGHT MLS
Property tax history
+2.9%/yrLatest (2026): $4,725 · +6.5% YoY. Source: county tax records.
Cash-flow waterfall
monthlySold comps — $/sqft
last 12 mo · ≤1 miLoading sold comps…